Effect of Health Profession Students’ Community Engagement on Open Defecation-Free Status: A Quantitative Assessment of a Community-Led Total Sanitation and Hygiene Program in Southwestern Uganda
Moses Ntaro, JohnBosco Isunju, Fassou M Grovogui, Jonathan Izudi, Lenka Benova, Edgar Mulogo, John C Ssempebwa

TL;DR
Health students in Uganda helped reduce open defecation more effectively than traditional methods, showing they can support sanitation efforts.
Contribution
Demonstrates that student-led community sanitation programs can significantly reduce open defecation in rural areas.
Findings
Student-led CLTS reduced open defecation from 24.69% to 14.04% in intervention villages.
Intervention villages had higher odds of achieving open defecation-free status compared to control villages.
Control group saw an increase in open defecation from 23.69% to 39.92%.
Abstract
Introduction Uganda’s Community-Led Total Sanitation (CLTS) strategy is based on the use of health extension workers (HEWs) for its implementation at the community level. However, identification of other facilitators to improve and accelerate the scaling up of the CLTS intervention has not been explored. This study evaluated the effect of a student-led CLTS intervention on open defecation and open defecation-free status outcomes. Methods The study was conducted in two sub-counties in Kabale district in southwestern Uganda, Rubaya and Buhara. We used a pre-post study with a nonequivalent control group quasi-experimental study design to measure the effect of a student-led CLTS intervention on’ the levels of household open defecation (OD)-free (HODF) status. A total of six parishes from two study sub-counties with no main towns and having low latrine coverage were selected. A total of…
Genes, proteins, chemicals, diseases, species, mutations and cell lines named across the full text — each resolved to its canonical identifier and authoritative record.
Click any figure to enlarge with its caption.
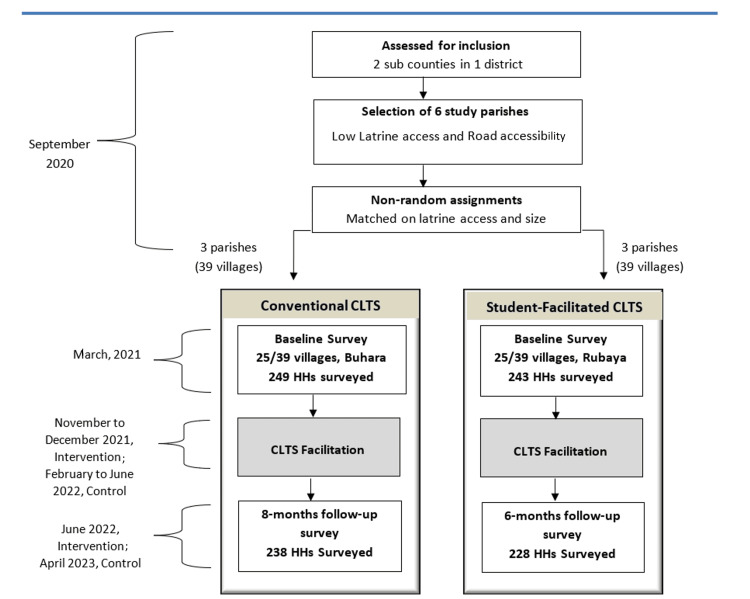 Figure 1
| Sampled villages and households | Number of households surveyed | |||||
| CLTS Intervention groups | Subcounties | Parishes | Number of Villages | Number of households | Before intervention | After intervention |
| Student-Facilitated CLTS | Rubaya | Rwanyana | 6 | 60 | 59 | 56 |
| Kibuga | 6 | 60 | 60 | 51 | ||
| Karujanga | 13 | 130 | 124 | 121 | ||
| Conventional HEWs-Facilitated CLTS | Buhara | Rwene | 7 | 70 | 70 | 63 |
| Kitanga | 8 | 80 | 79 | 74 | ||
| Kafunjo | 10 | 100 | 100 | 103 | ||
| Total | 50 | 500 | 492 | 468 | ||
| Characteristics | Category | Study Groups | p-value | |
| Control (Convention CLTS) | Intervention (Health profession students-facilitated CLTS) | |||
| Age of respondents (in years) | Mean (SD) | 34.6 (19.7) | 32.9 (18.9) | 0.340 |
| Gender of respondents, n (%) | Female | 172 (51.7%) | 161 (48.3%) | 0.500 |
| Marital status, n (%) | Married | 213 (48.7%) | 224 (51.3%) | 0.019 |
| Household size (people), n (%) | > 7 | 226 (49.9%) | 227 (50.1%) | 0.280 |
| Education level, n (%) | Primary | 135 (50.0%) | 135 (50.0%) | 0.700 |
| Economic status, n (%) | Owns radio | 150 (48.7%) | 158 (51.3%) | 0.270 |
| Owns a television screen | 14 (42.4%) | 19 (57.6%) | 0.330 | |
| metal roofing material | 249 (50.6%) | 243 (49.4%) | 1.00 | |
| Spent above USD 16 on latrine building | 93 (46.5%) | 107 (53.5%) | 0.010 | |
| Open defecation, n (%) | Feces observed in the household vicinityv | 59 (49.6%) | 60 (50.4%) | 0.800 |
| Household ODF status, n (%) | Attained ODF statusv | 8 (53.3%) | 7 (46.7%) | 0.830 |
| Compound cleanliness status, n (%) | Waste present around the yardv | 202 (54.4%) | 169 (45.6%) | 0.003 |
| Latrine with superstructure, n (%) | Absence of latrine with superstructurev | 15 (28.8%) | 37 (71.2%) | < 0.001 |
| Latrine sharing, n (%) | Uses shared latrine | 33 (49%) | 34 (51%) | 0.120 |
| Latrine status during rainy season, n (%) | Latrine unusable | 19 (38.8%) | 30 (61.2%) | 0.081 |
| Handwashing station, n (%) | Presence of handwashingv | 36 (43.4%) | 47 (56.6%) | 0.150 |
| Water source, n (%) | Use of improved water source | 124 (49.0%) | 129 (51.0%) | 0.740 |
| Time around water collection, mean±SD | Walking time to water source (minutes) | 18.4 ±29.3 | 21.1 ±31.6 | 0.330 |
| Category of latrine, n (%) | Improved pit latrine | 9 (50.0%) | 9 (50.0%) | 0.930 |
| Hygiene education provided, n (%) | Hygiene education within past 2 months | 162 (47.9%) | 176 (52.1%) | 0.078 |
| Extension worker home visit, n (%) | Visited by extension health worker in past 2 months | 13 (31.7%) | 28 (68.3%) | 0.011 |
| Participated in CLTS triggering, n (%) | Attended CLTS triggering in past 2 months | 14 (26.9%) | 38 (73.1%) | < 0.001 |
| VHT home visit, n (%) | Visited by VHT in past 2 months | 131 (46.6%) | 150 (53.4%) | 0.041 |
| Students' home visit, n (%) | Visited by health profession students in past 2 months | 2 (16.7%) | 10 (83.3%) | 0.020 |
| Time | Variable | Variable Description | Control Group, n (%) | Intervention Group, n (%) | p-value |
| Baseline | Hygiene education provided | Had hygiene education with with past 2 months | 162 (47.9%) | 176 (52.1%) | 0.078 |
| Extension worker home visit | Visited by HEW in past 2 months | 13 (31.7%) | 28 (68.3%) | 0.011 | |
| Participated in CLTS triggering | Attended CLTS triggering in past 2 months | 14 (26.9%) | 38 (73.1%) | < 0.001 | |
| VHT home visit | Visited by VHT in past 2 months | 131 (46.6%) | 150 (53.4%) | 0.041 | |
| Students' home visit | Visited by health profession students in past 2 months | 2 (16.7%) | 10 (83.3%) | 0.020 | |
| Follow up | Hygiene education provided | Had hygiene education with with past 2 months | 201 (49.3%) | 207 (50.7%) | 0.038 |
| Extension worker home visit | Visited by HEW in past 2 months | 31 (34.8%) | 58 (65.2%) | <0.001 | |
| Participated in CLTS triggering | Attended CLTS triggering in past 2 months | 39 (28.3%) | 99 (71.7%) | < 0.001 | |
| VHT home visit | Visited by VHT in past 2 months | 103 (40.1%) | 154 (59.9%) | <0.001 | |
| Students' home visit | Visited by health profession students in past 2 months | 16 (13.0%) | 107 (87.0%) | <0.001 |
| Characteristics | Control Group (n=238), n (%) | Intervention Group (n=228), n (%) | p-value | |
| Presence latrine with superstructure | Yes | 155 (41.2%) | 221 (58.8%) | <0.001 |
| Presence of hole cover | Yes | 65 (43.6%) | 84 (56.4%) | 0.027 |
| No | 173 (54.6%) | 144 (45.4%) | ||
| Evidence of latrine use | Yes | 198 (50.4%) | 195 (49.6%) | 0.49 |
| No | 40 (54.8%) | 33 (45.2%) | ||
| Use of handwashing facility | Yes | 55 (62%) | 34 (38%) | 0.027 |
| No | 29 (44%) | 37 (56%) | ||
| Presence of handwashing facility | Yes | 84 (54.2%) | 71 (45.8%) | 0.34 |
| No | 154 (49.5%) | 157 (50.5%) | ||
| Presence of material at the handwashing station | Yes | 64 (67%) | 31 (33%) | <0.001 |
| No | 20 (33%) | 40 (67%) | ||
| Availability of water at the handwashing station | Yes | 58 (48.7%) | 61 (51.3%) | 0.013 |
| No | 26 (72.2%) | 10 (27.8%) | ||
| Open defecation | Observed | 95 (74.8%) | 32 (25.2%) | <0.001 |
| Not Observed | 143 (42.2%) | 196 (57.8%) | ||
| Household ODF status | Yes | 2 (12.5%) | 14 (87.5%) | 0.002 |
| No | 236 (52.4%) | 214 (47.6%) | ||
| Compound cleanliness status | Waste present | 161 (46.8%) | 183 (53.2%) | 0.002 |
| Waste absent | 77 (63.1%) | 45 (36.9%) | ||
| latrine usable | 226 (51.6%) | 212 (48.4%) | ||
| Share latrine | Yes | 66 (68.8%) | 30 (31.3%) | <0.001 |
| No | 165 (45.5%) | 198 (54.5%) | ||
| Variable | Open Defecation | Open Defecation Free Status | ||
| P-value | Adjusted Odds Ratio (95%CI) | P- value | Adjusted Odds Ratio (95%CI) | |
| Intervention | 0.814 | 1.09 (0.51 - 2.31) | 0.495 | 0.61 (0.14-2.63) |
| Time | 0.91 | 0.09 ( 0.24 – 4.86) | 0.483 | 3.40 (0.10 – 117.60) |
| Intervention * Time interaction | 0.048 | 3.73 (1.01 – 13.77) | 0.001 | 13.20 (3.26– 53.55) |
| Presence of latrine with superstructure | 0.022 | 2.46 (1.15 – 5.25) | N/A | N/A |
| Household spent above $16 on latrine building | 0.960 | 1 (0.70 – 1.46) | <0.001 | 2.89 (1.86 – 4.48) |
| Waste absent around the yard | 0.843 | 1.05 (0.65 – 1.68) | 0.007 | 4.37 (1.56 – 12.19) |
| Respondent married | 0.624 | 0.83 ( 0.40 – 1.77) | 0.791 | 1.32 (0.15 – 11.66) |
| Household visited by HEWs in past 2 months | 0.822 | 0.90 (0.32 – 2.47) | - | - |
| Respondent attended CLTS triggering in past 2 months | 0.323 | 0.69 (0.32 – 1.48) | 0.483 | 1.61 (0.40 – 6.43) |
| Household visited by VHT in past 2 months | 0.393 | 1.36 (0.66 – 2.81) | 0.339 | 2.04 (0.45 – 9.22) |
| Visited by students in past 2 months | 0.966 | 0.97 (0.29 – 3.30) | - | - |
Peer Reviews
No public reviews on file for this paper yet. If you reviewed it on a platform where reviews are public (OpenReview, ICLR, NeurIPS, ICML), you can paste yours below so the community can read it here.
Videos
No videos yet. Explain this paper in a talk, walkthrough, or lecture? Add one.
Taxonomy
TopicsChild Nutrition and Water Access · Global Maternal and Child Health · Food Security and Health in Diverse Populations
Introduction
The 2030 Agenda for Sustainable Development focuses on leaving no one behind in sanitation access. This ambitious agenda requires United Nations (UN) member countries to increase their efforts fivefold if the global target of sanitation access for all is to be achieved [1-3]. Worldwide, 3.5 billion people lack safely managed sanitation, with 419 million people still practicing open defecation (OD) [3]. OD has consequences for child mortality and development [4]. In addition, poor sanitation leads to fecal contamination of the environment, and together with poor hygiene practices such as hand washing, has resulted in an estimated 577,000 deaths annually [5,6]. More so, it’s estimated that two million children die annually due to diseases related to poor access to or quality of water or sanitation and suboptimal hygiene [7].
According to the 2015 UN General Assembly, poor sanitation conditions led the UN to reaffirm the importance of sanitation by prioritizing it in the Sustainable Development Goals (SDGs) as SDG 6 [8]. The goal aims to attain universal access to sufficient and equitable sanitation and hygiene for all, while eradicating OD by 2030, with a focus on initiatives that emphasize community participation.
In low- and middle-income countries (LMICs), for many years, governments and their development partners, like nongovernmental organizations (NGOs), have developed strategies to improve sanitation, such as providing free or subsidized latrine facilities to communities. Also, hygiene and health education programs like Children’s Hygiene and Sanitation Training (CHAST) [9] and Participatory Hygiene and Sanitation Transformation (PHaST) [10] were regularly combined with latrine subsidies [11,12]. Even though these approaches increased latrine coverage and awareness of health benefits [11], sanitation professionals realized that they were limited to creating demand for latrines and behavior change among communities, and largely, they are believed not to have resulted in household OD-free (HODF) status [12-14]. An impact assessment study of a five-year water and sanitation improvement programme in Odisha, a state of India, revealed an increase in latrine coverage from 15% to 48%; unfortunately, in the same study it was established that among the households that had built a latrine, 39% of the adults and 52% of the children reported to still practice OD [15]. To address similar challenges of community failures in demand for latrines and behavior change, the Community-Led Total Sanitation (CLTS) approach was developed [16].
The CLTS methodology has three standard phases as delineated in the CLTS Handbook: pre-triggering, triggering, and follow-up [17]. The initial phase of pre-triggering commences with community engagement and endorsement by leaders. Triggering is a community gathering facilitated by an external moderator who uses participatory tools, such as a sanitation map, designed to elicit an emotional reaction and foster a collective aspiration within the community to improve the inadequate sanitation conditions. Subsequently, facilitators will conduct follow-up visits to the villages to assess progress and assist the community in eradicating OD. Primarily, health extension workers (HEWs) spearhead the adoption of CLTS following a five-day training program [17].
Generally, progress has been made globally through the CLTS approach. For example, some local government areas in Nigeria, some districts in Zambia, and some counties in Kenya attained OD-free (ODF) status following the CLTS interventions [18,19]. Moreover, the CLTS sanitation promotion strategy has so far been adopted in more than 50 LMICs, including Uganda [20]. A study in Mali provided new evidence that increased private latrine ownership has doubled among households in villages that received a CLTS intervention [19]. These findings justified the scale-up of the CLTS programme in rural Mali and implied that the CLTS approach can be effective in improving access to sanitation in rural areas [21]. The CLTS approach has also been associated with improvements in child growth because a CLTS programme reduces child exposure to fecal contamination through reduction in OD and improvement in hand washing behavior [21,22]. However, for CLTS to register the desired result, it depends on the baseline settings, such as a high baseline of OD and high social capital. In addition, for CLTS outcomes to be more sustainable, conditions such as an enabling environment of access to latrine products and materials and sufficient follow-up visits are required [8].
In most of the countries where CLTS has been adopted as a national sanitation strategy, such as Uganda, HEWs, such as health assistants, community development officers, and health inspectors, are tasked with the implementation and roll-out of the strategy. Unfortunately, most of these low-income countries are undergoing a global health workforce crisis of a shortage of health professionals in rural and remote areas [23]. Similarly, the Ngor declaration on sanitation and hygiene, signed by African ministers at AfricaSan 4, identified the sanitation and hygiene human resource gap. It also established that the government’s over-reliance on community volunteers has affected the scale-up and sustainability of sanitation outcomes. This realization led to the formulation of Ngor commitment 5 to focus on addressing this gap at all levels [24]. In the face of this Human Resource for Health (HRH) gap, it is not possible for many African countries to have adequate HEWs for sanitation and hygiene promotion and CLTS implementation. In addition, national and local resources are always insufficiently allocated to sanitation, and governments often overdepend on development partners such as NGOs and humanitarian agencies for short-term CLTS interventions in selected areas [24].
Therefore, with regard to the hygiene and sanitation improvement coverage raised by the SDGs, new strategies are required. This is because the earlier national strategies for CLTS did not account for the SDG shift and the Ngor Declaration on sanitation and hygiene, which focus on universal access to adequate and sustainable hygiene services within the next six years (2030). With this goal integrated into national policies and plans among African countries, the scale and pace will need to increase drastically if SDG 6.2 is to be attained [24]. This, therefore, will require innovative and appropriate strategies that will support and scale up the existing hygiene and sanitation promotion interventions such as CLTS.
Some studies have been conducted to evaluate the performance of different actors in CLTS implementation. Such studies provide very useful information to guide the scale-up of the CLTS strategy. In a study conducted in Ethiopia, teachers were compared to HEWs in CLTS facilitation. The findings of this study revealed that teachers were less effective compared to the HEWs. This occurred due to teachers' additional responsibilities and a preliminary absence of support from local officials [6]. Interestingly, in the second year following completion of the CLTS intervention, the less effective teacher, facilitated CLTS caught up with the HEW-facilitated CLTS in sustaining CLTS outcomes [6]. In another related study in Ghana, natural leaders from the community were selected and trained in participatory, social, and technical skills during a HEW-facilitated CLTS intervention, which substantially improved the CLTS outcomes [25]. These studies provide evidence that CLTS outcomes can be sustained in the short term when interventions include training and building capacity for local actors [26]. Therefore, identifying appropriate actors in order to maximize CLTS outcomes is still a priority in CLTS implementation and scale-up.
Educators in medical schools acknowledged the central role in training to better serve and be accountable to communities. This is because social accountability is increasingly becoming an indispensable role for medical schools. Medical schools are required to contribute to improving the health status of the local communities and contribute to the “Health for All” strategy [23,27,28]. Therefore, many health professional training institutions globally have integrated Community-Based Education (CBE) into the training curricula [29]. The CBE curricula demand that health professional students have part of their learning within communities. It exposes medical students to realities in healthcare in less privileged communities. Gradually, medical education training has further evolved to student community engagement programs such as Community Engaged Medical Education (CEME), which stresses an interdependent and reciprocal relationship between the health profession training institutions and the community served. It envisages that community people are not just observers or recipients providing the settings for medical education training, but are also engaged in the education and services to provide solutions to their health problems in the community. Therefore, students' experiential learning objectives and activities are fundamentally aligned to priority community health care needs, and the student is the center of partnership between the community and the medical school for improving community health status [23]
Studies have shown that community-based education (CBE) programs improve students’ abilities to serve communities. It also increases their empathy, together with communication skills [30]. Most studies that have been done on students involved in CBE programmes have focused on the effect of learning activities in communities on students, such as students’ willingness to practice in a rural setting [31-33]. On the other hand, in a few studies looking at the contribution of students among host communities, they have revealed that students support the delivery of healthcare in health facilities and provide health education to communities [34,35]. These studies further recommend the need for a comprehensive examination of CBE programs in different settings in order to further quantify and document the contributions of health profession students [34].
A study by the consortium of medical schools in Uganda showed that improved malaria prevention and treatment-seeking behavior among parents of children under five years was associated with CBE presence in their communities [29]. In a related study, students participating in the CBE program provided health talks and demonstrations that increased awareness of behaviors and disease prevention in the communities. Students achieved this through engaging with the local communities in activities such as home visits and health workshops [36].
Mbarara University of Science and Technology (MUST), located in South Western Uganda, was established in 1989 and is based on the CBE philosophy. Its oldest faculty, the Faculty of Medicine, has been running a CBE programme since its inception. Annually, health profession students conduct health education activities among CBE host communities. In the CBE student host communities in South Western Uganda, sanitation and hygiene remain a major challenge, with more than half of the households (55%) using unimproved pit latrines. Generally, its sanitation status is more like that at the national where about 8.7% (22.4 million people) practice OD, and many villages are not ODF [37].
The Uganda Ministry of Health is implementing the Uganda Sanitation Fund (USF) programme funded by the Global Sanitation Fund (GSF) with the aim of eliminating OD to attain ODF communities [38]. To achieve the purpose of the USF programme, four outcomes were agreed upon, which, among others, include identifying innovative sanitation and hygiene approaches that are scalable. Following its five years of implementation in 44 out of 102 districts using the CLTS strategy, 78% of the villages have been triggered, and 37% of the villages have been certified as ODF [39]. Despite the achievements, the programme that is mostly donor-funded remains with challenges of further scaling up and sustaining the CLTS intervention [40]. Therefore, there is a need to identify and innovate approaches that will complement the Ministry of Health's effort to scale up and sustain the CLTS intervention. It’s in this line that we proposed investigating the contribution of student community engagement in the CLTS implementation to attain ODF status is an innovation in the above direction. This study, therefore, fills the knowledge gap on the use of health profession students in the CBE program as new actors to facilitate the CLTS intervention and examine their effect on household ODF status.
Therefore, this study evaluated the effect of a student-led CLTS intervention by comparing OD and ODF status outcomes between intervention villages (villages that received the student-facilitated CLTS) and control villages (which received routine sanitation intervention by the HEWs).
Materials and methods
This study had a pre-post structure with a non-equivalent control group quasi-experimental study design. It was conducted in two subcounties (Rubaya and Buhara) of Uganda from March 2021 to April 2023. The study was approved by the Higher Degrees Research Ethics Committee, School of Health Sciences, College of Public Health, Kampala, Uganda. It was registered with the Uganda National Council of Science and Technology (registration number HS1135ES).
Study population
Kabale district was selected because it hosts most of the Mbarara University of Science and Technology (MUST) students on their student community engagement placement. Two subcounties (Rubaya and Buhara) with poor sanitation indicators were selected. In Uganda's decentralized government structure, both the district and subcounty possess political authority and financial autonomy [41]. The district local governments supervise and support the subcounty local governments [41]. Within the subcounties, a total of six road-accessible parishes with no main towns and having low latrine coverage according to the subcounties and district reports were selected [42]. These were pre-matched based on latrine accessibility and parish size (number of households). We manually designated them to receive either conventional or student-facilitated CLTS (Figure 1). The pre-matching was done in order to minimise bias and reach closer to random assignment to attain similar comparison groups. We used pre-matching because it is an established, valuable tool for evaluating community demand-driven sanitation policies [43].
Timeline and sequence of the pre-post quasi-experimental study designAdapted from: Crocker et al., 2016 [6]CLTA: Community-Led Total Sanitation; HH: household
Each parish has approximately 13 villages. Then we assigned randomly 25 selected villages in the three parishes of Rubaya subcounty to receive the student CLTS intervention, and the other 25 randomly selected villages in Buhara to receive the conventional CLTS. To avoid contamination between the intervention and the control villages, the subcounties of Rubaya and Buhara had a buffer subcounty between them.
CLTA intervention
The CLTS intervention consisted of three standard stages as explained in the CLTS Handbook [17]. The CLTS concentrated on a single day of ‘triggering’ and two follow-up visits that were referred to as post-triggering follow-up visits. This bottom up community sanitation approach involved health profession students who facilitated entering the selected villages and, by using a selection of tested community participatory techniques, elicited emotions such as shame, embarrassment and disgust among community members during village meeting to help community members realize that by practicing OD they are always feeding on each other’s feces. This realization was designed to bring about a transformation in the villages as the village members made strong decisions to come up with a plan to stop OD.
Health Profession Student-Led CLTS
The community engagement program known as the CBE Research and Service (COBERS) under the Faculty of Medicine at MUST organized its annual student engagement course, referred to as the Leadership and Community Placement (LCP) course, for undergraduate health profession students. The undergraduate health profession students who undertake the LCP course are fourth-year medicine, third-year nursing science, third-year medical laboratory sciences, third-year physiotherapy, second-year pharmacy, and first-year pharmaceutical sciences. A total of 355 students were divided into interdisciplinary student teams of about 7-12 students and placed across 23 urban and 10 rural communities by the COBERS program. While in these communities, students supported by a university supervisor undertook a community diagnosis and designed a low-cost intervention, mostly educational, to address the priority community challenge. One of these groups, comprising 12 students, was selected, trained, and prepared to participate in the CLTS intervention in the rural placement community in Rubaya sub-county, Kabale district.
Training of the student group: The training for the selected 12 students on how to facilitate CLTS was done in their first week of the three-week community engagement program. The four-day training was delivered by the Kabale district CLTS lead trainer, who was one of the district’s health workers. Although the training was a day less than the standard five days, it was similar to that provided to the HEWs facilitating CLTS within the district.
The 12 students were divided into four teams, comprising three students per team. Student teams were briefed by the health inspector in charge of their operation area before engaging in the CLTS activity. Since there were two HEWs in the sub-county trained in CLTS facilitation, they were expected to work along with the student teams; however, they only managed to attend two to three triggering sessions. The four student teams implemented CLTS in the 25 villages within three weeks of community engagement. The students came up with a work plan and triggered all 25 villages, and also did a post-triggering follow-up visit in each village. They also facilitated the selection of natural leaders to form village sanitation committees in each village. Details of the activities that students did during the CLTS implementation in every village were provided in village CLTS implementation reports. A month after the triggering and community placement, students travelled to these villages and, with guidance from the HEWs, conducted a post-triggering follow-up. During this follow-up, students visited an average of 10 homes, reinforcing the sanitation and hygiene promotion messages and practices aimed at making households attain an ODF status using a checklist.
Pre-triggering, triggering, and post-triggering approaches used by the students: Student teams conducted pre-triggering community entry visits to their respective villages within a period of two days. In addition to informing the community leaders of the objectives of the visit, it also included setting the dates for the triggering exercise in the villages. Triggering employed the steps and techniques of Kar and Chambers [17] that have been adopted locally into the CLTS strategy within the country. The steps they followed are given below.
Step one was the defecation area transect walk/walk of shame. During this transect walk, students, together with the community members, walked through the village locating OD areas. They ensured that community members stand in OD areas inhaling the unpleasant smell and in the discomfort of the sight of feces/shit. This disgusting sight experience and the smell accompanied by visitors to their community were aimed at triggering community mobilization, as more people gathered to see what was happening. Feces identified during the transect walk were carried to the meeting point to be used during the demonstrations.
Step two was the trigger for disgust. Following the transect walk, students, together with the community members, congregated at the meeting point to conduct demonstrations about the oral faecal transmission routes. Two demonstrations were often performed. One was the water bottles demonstration to show contamination of drinking water with feces, and the second was food contamination using a piece of cake. During the water contamination demonstration, a grass leaf was always picked and made to touch the collected faeces, and then stirred in the water in the bottle. The bottle could be shaken to ensure that the faeces introduced are barely seen. Later, the water could be offered to one of the community members to drink, who would always completely refuse. During the food contamination demonstration, a piece of cake on a plate would be placed next to the feces. This would attract flies from the faeces to the cake. The contaminated cake would be offered to someone, too, who would also refuse it. At this point, students with the aid of the F-diagram would show community members the different agents and pathways that make faeces get to the mouth.
The third step was the calculation of the amount of feces and medical expenses. Finally, students facilitated families to calculate the feces they produce in a year, and also the medical expenses related to fecal-related diseases. This brought the ignition moment with the community members realizing that they have been eating each other’s faeces and then deciding on the collective solution of ending OD. Sanitation committees were formed, and their names were written down; students agreed with the committees on the plans for the follow-up.
The post-triggering follow-up took the USF's approach called the Follow-up MANDONA. MANDONA refers to an action-oriented community follow-up approach that aims at motivating communities to adapt simple, immediate, doable actions (SIDAs) to drive towards attaining an ODF status. The students conducted two follow-up visits, with the first one a few days after triggering to support communities in attaining the ODF status.
Finally, the verification and certification of ODF villages was expected to follow the ongoing process of villages first declaring themselves ODF, then followed by certification from the authorities, which was not part of the scope of our study.
The CLTS by HEWs in the Control Villages
In the 25 control villages in Buhara subcounty, HEWs implemented CLTS using the local government guidelines. Since CLTS is the sanitation promotion strategy used in Kabale, similar steps of pre-triggering, triggering, and post-triggering follow-up were used by the HEWs. The CLTS implementation by HEWs was led and supervised by the district principal health inspector. The principal investigator of the current study received a report from the principal health inspector about the CLTS implementation process that indicated that the activity took five months.
Eligibility criteria
All sampled households that had the heads of the household or their spouses at home during the household data collection exercise were included in the study. Sampled households that had very old household heads or their spouses who were unable to respond to the questionnaire were excluded from the study. In addition, any eligible individual who was deemed to be mentally unwell or under the influence of drugs or alcohol was excluded from the study. Finally, only those who provided consent were included in the study.
Sample size estimation
Since we were interested in a proxy indicator of a health outcome, we calculated the sample size necessary to measure the effect of change in OD. In addition, we inflated the calculated sample size because our study units were villages receiving the intervention, although our primary outcomes were measured on individuals in the households nested within those villages. Using the sample size calculation formula for studies using clusters [44], the sample size (m) was inflated by the design effect, and intracluster correlations (ICC) were accounted for. We assumed power of 80%, 5% confidence two-sided, and ICC (ρ) of 0.12 and design effect (DE) = [1+ n-1]ρ. The formula used was: \begin{document}m = \left( \frac{(Z_{1-\alpha/2} + Z_{1-\beta})^2 \left[ P_1(1 - P_1) + P_2(1 - P_2) \right]}{D^2} \right) \times \left[1 + (n - 1)\rho \right]\end{document} , where, n is the number of individuals per cluster, which is approximately 70; P_1_ is the proportion of households with ODF status in the control arm, which is 0.2; P_2_ is the proportion of households with ODF status in the intervention arm, which is 0.4; D is the approximate difference in OD between the intervention and control arms, which is 10%. Therefore, the total sample size for each arm (control and intervention) = 210. Considering a 5% loss to follow-up (210 x 1.05), we calculated a sample size of 220 in each group.
However, for intervention studies involving clusters, where n individuals are in each cluster. Then, C, the number of clusters required, was determined using the formula: \begin{document}c = 1 + \frac{(Z_{\alpha/2} + Z_{\beta})^2 \left[ \frac{\pi_0(1 - \pi_0)}{n} + \frac{\pi_1(1 - \pi_1)}{n} + k^2(\pi_0^2 + \pi_1^2) \right]}{(\pi_0 - \pi_1)^2}\end{document}
Here, k is the coefficient of variation of the true proportions between clusters within each group. Previous studies show that k is < 0.25 [45].
The study area comprised villages (clusters) with approximately 70 eligible participants distributed among 70 households. The intervention was delivered in villages. Before and after the intervention, surveys were conducted to measure the proportion of households with ODF in the two arms. We proposed a K, conservative value of 0.12 [43] and a 10 pp. difference between intervention and control [6]. The ODF status proportion was estimated at 0.03. Therefore, to determine the number of villages (clusters) required in each arm, we assumed that the proportion of ODF status in the control villages increased to 0.2, ∏o=0.2 and that we required 80% power (zβ=0.84) to detect a significant difference (P<0.05: Zα/2=1.96) if the intervention increases the ODF status by 37% to 40%, ∏1=0.4. As earlier determined n, 70 is the number of eligible participants in each cluster. Therefore, the number of clusters (villages) c, required in the treatment group, was calculated using the second formula above, which is 25. To obtain households to participate in the study, a list of households was compiled for all the selected villages, and an average of 10 households per village was randomly sampled proportionate to the village population.
Six parishes were sampled from each of the two study subcounties in Kabale district. All the villages in the parishes were listed, and 50 villages were randomly selected. An average of 10 households were selected from each village. This provided a sample size of 492 respondents for the baseline survey and 468 for the follow-up survey that targeted the same households that were surveyed at baseline (Table 1).
Data collection
The household surveys and observations of household sanitation and hygiene were completed at the baseline (March 2021), and the follow-up surveys in the intervention area were conducted in June 2022 and in control villages in April 2023. The differences in the time for the interventions in the two groups were solely based on the activity plans for the two implementing institutions (the District Health Office, Kabale, and the Community Engagement Unit at MUST). Household surveys collected data on demographics, sanitation, hygiene, interactions, and recall of CLTS activities. Sanitation outcomes were assessed by observing OD and ODF status at the household [46]. Information was then collected from heads of households or their spouses about contextual and behavioral factors influencing latrine use and handwashing practices. These included the economic status of the household, which was estimated by collecting information on household effects such as radio ownership, television ownership, type of materials used for latrine construction, and amount of funds used for latrine construction. Other variables included age, household size, educational level attained, cleanliness of latrine, status of latrine, distance of latrine, past diarrhea illness, knowledge about health risks, distance to water source, type of water source, baseline OD, and latrine use. In addition, using the RANAS (Risks, Attitudes, Norms, Abilities, and Self-regulation) model factors, information on behavioral factors such as risks, attitudes, norms, abilities, and self-regulation was collected.
The questionnaire tool used was adopted from Crocker et al. [6] and Harter et al. [25]. The questionnaire was translated from English into Rukiga. The translated questionnaire was utilized in interviewer training and examined by the first author and interviewers to confirm that the meaning of the questions remained unchanged. The interviewers conducted a pretest of the questionnaire in non-study areas with 11 households to verify content validity, language suitability, and question clarity. The survey utilized the mobile data collection software KoBoCollect v2021.3.4 (Kobo, Cambridge, Massachusetts, United States) [47], installed on tablet devices, and had a duration of approximately 45-60 minutes.
Data analysis
Descriptive statistics from household surveys and observations were used to establish differences between the intervention and control groups at baseline. The primary outcomes were changes in OD levels and ODF status in households. The OD and ODF status were established through observations at the latrine and household premises as described earlier. The difference-in-difference (DID) estimator was used to determine the level of change in households' OD and ODF status between the intervention and control groups, taking into account the baseline differences. A logistic regression model was built with OD and ODF status outcomes as the dependent variables. The analysis included data collected at two time points, that is, before and after the CLTS interventions. OD and ODF status were modeled using a logistic regression as a function of treatment group, time, and eight covariates (presence of latrine with superstructure, household spent above $16 on latrine building, absence of waste around the yard, respondent married, household visited by extension health worker in past two months, respondent attended CLTS triggering in past two months, household visited by the village health team (VHT) in past two months, household visited by students in past two months). The “svyset” command in STATA/BE 17 (StataCorp LLC, College Station, Texas, United States) was utilized to account for unequal selection probability, non-response rates, and village clustering of outcomes.
Although pre-matching was done and a DID estimator, together with a multivariable regression, was performed to cater for baseline differences between the groups, outcomes of interest were not solely attributed to interventions since our study design did not involve nonrandom assignment.
Results
Baseline statistics
The two groups were similar in most characteristics, except that there were more married respondents, spending more than $16 in building latrine, more households with clean compounds, fewer households with latrine superstructure, and more reporting of participation in community engagement activities were observed in the intervention group (Table 2). More so, the primary outcomes, OD and HODF status, were not different in the two groups. Although pre-matching eliminated most of the sanitation difference, it did not completely eliminate the household latrine ownership difference at baseline (Table 2).
Sanitation outcomes
Following the implementation of CLTS in the intervention and control groups, that is to say from the baseline to follow-up, the proportion of households practicing open defecation decreased (24.7% to 14.0%). Also the households that obtained the ODF status increased (2.9% to 6.1%) only in the intervention group. In the control group, the open defecation increased (23.7% to 39.9%) and households with the ODF status reduced (3.2% to 0.8%).
There were significant differences in most of the sanitation characteristics after the CLTS implementation, with the intervention group recording better results. Apart from the proportion of households with handwashing materials at the handwashing station being higher in the control group, most of the other good sanitation characteristics were better in the intervention group (Table 5). The difference-in-difference estimator was performed using open defecation and open defecation-free status, modeled using a logistic regression as a function of treatment group, time, and eight covariates that were statistically significant at baseline. The results showed that the households in the intervention group had a higher odds of not practicing open defecation (3.73; 95%CI: 1.01 - 13.77) compared to the households in the control group. Similarly, in the intervention group, households had more odds of attaining the open defecation free status (13.20; 95%CI: 3.26- 53.55) compared to the control group (Table 5).
Health promotion and CLTS activities by HEWs and students
Before the intervention, households in the student-CLTS facilitated parishes reported having received more household visits from HEWs, VHTs, and students. They had also participated more previously in CLTS triggering compared to the conventional CLTS parishes. However, this does not affect the intervention effect estimates presented earlier because these baseline community engagement activities were included as covariates in the outcome regression models. After the intervention, the findings showed that household visits by HEWs, VHTs, and students increased more drastically in the student-CLTS facilitated parishes, and the increases were more statistically significant (Table 3).
There were significant differences in most of the sanitation characteristics after the CLTS implementation, with the intervention group recording better results (Table 4). Apart from the proportion of households with handwashing materials at the handwashing station being higher in the control group, most of the other good sanitation characteristics were better in the intervention group.
The difference-in-difference estimator was performed using OD and ODF status modeled using a logistic regression as a function of treatment group, time, and eight covariates that were statistically significant at baseline. The results showed that the households in the intervention group had higher odds of not practicing open defecation (3.73; 95%CI: 1.01-13.77) compared to the households in the control group (Table 5). Similarly, in the intervention group, households had more odds of attaining the open defecation free status (13.20; 95%CI: 3.26-53.55) compared to the control group
Discussion
We found that health profession students have the ability to facilitate sanitation promotion at the community level. There have been no prior rigorous studies of health profession students leading a CLTS intervention during their mandatory academic community engagement program. Our findings are in agreement with a previous study by Atuyambe et al. that demonstrated effective contributions by students to healthcare delivery at health facilities and improved sanitation services at the community level [34]. In their study, they were able to qualitatively explore the student contributions expressed by the community leaders, members of the village health, and health facility leaders. However, by the nature of their study design, quantification of the student contributions towards sanitation improvements was not possible. In the current study, we have attempted to quantify the student contribution in sanitation promotion using more rigorous household sanitation indicators of OD and ODF status to further strengthen the evidence of the contributions of the community engagement programs of university health professions training schools.
There was a threefold reduction in OD practice and a twofold increase in HODF status in the student-facilitated CLTS parishes (intervention group) compared to the conventional HEWs-facilitated parishes (control group). This finding of a reduction in OD in the intervention group is consistent with previous studies that have demonstrated the effect of CLTS in reducing OD and latrine utilization [6,12,21,48,49]; however, the reduction was not registered in the control group. Studies have also shown that communities have attained ODF status certification after CLTS implementation [42-52]. Most of the studies used clusters, such as villages, as the unit of measurement for open ODF status certification. Few studies have measured ODF status at the household level. Okolimong et al. [52] established a higher HODF status (35%) compared to the 6.1% that we have reported in the student CLTS-facilitated parishes. The lower percentage in this study can partly be explained by the very low, less than 3% of households with HODF status before the intervention, and the short time between the intervention and evaluation.
The increase of OD and reduction of the proportion of HODF status in the control group can be explained by the low proportion of households with latrines and HEW visits. Although the CLTS intervention is expected to trigger communities to construct low-cost latrines [53], our findings show that most of those who had latrines had used no money or less than $16 to build them. Secondly, according to the CLTS implementation report by the district health focal person who was responsible for the parishes in the control group, it was indicated that the activity took five months. It is more likely than not that HEWs implemented the CLTS hurriedly to meet the timelines of this study. It’s also likely that the two HEW workers who were charged with the CLTS implementation and follow-up activities also got engaged in other job demands, such as supervision of bed net distribution exercise, health inspections of markets, and workplaces, thus implying that all the community activities required, especially community follow-up activities after triggering, may have not been conducted adequately in the control group villages. This is also reflected in our baseline findings, which showed low household community engagement activities by HEWs in the same parishes. Crocker et al. agree that there are some areas where the HEWs are busy, and other CLTS facilitators should be identified to support them in CLTS implementation [6]. Other studies, while establishing the most important activities for successful CLTS implementation resulting in ODF communities, have ranked follow-up and monitoring activities first [54]. Hence, no effect of the CLTS intervention was seen in the control group villages at the time of the follow-up survey. However, we argue that since this is their routine work with subsequent follow-up activities beyond the study period, improvements in latrine coverage will be realized so that OD reduction and ODF status attainment are achieved. Nevertheless, these findings emphasize the importance of monitoring CLTS interventions in order to ensure that OD is eliminated and ODF status is realized in the effort to prevent and control diarrheal diseases.
Although our findings show a reduction of OD and an increase in household ODF status in the intervention group, we also recognize the contribution of other factors. Our results show that the intervention group had a higher proportion of latrines with superstructures, were slightly economically better, and had less dirty compounds. These factors were accounted for in the DID logistic regression models, and the presence of a latrine with superstructure remained statistically significant for the OD reduction. Also, in the model for HODF status, households that had spent $16 or more and had less dirty compounds had higher odds of attaining the ODF status. This underpins the importance of understanding enabling contextual factors in CLTS interventions to achieve the elimination of OD. Orgill-Meyer et al. similarly report that ODF cannot be sustained if there are no latrine facilities [55]. Therefore, it’s paramount that CLTS interventions be complemented with poverty-targeted subsidies to support households in constructing latrine facilities [56].
We also observed that community engagement activities at the household level increased very significantly in the parishes with students. This was expected since the students worked with the VHT team members in community mobilizations and follow-up activities. The two HEWs working in the subcounty that received the student intervention were expected to support and guide the students. However, it is important to note that HEWs' home visits further increased at the households in the villages covered by the intervention group. This could either be that they also participated in the follow-up activities after the students had triggered the communities, or it could even be for other interventions, such as bed net distribution, which was happening around the same time. Whether it is the latter or former, students triggered a higher household engagement of VHTs and HEWs that contributed to the positive sanitation results presented in this study. This agrees with the philosophy of COBERS and Community Engaged Medical Education that students can act as change agents and facilitate communities to solve their problems [57]. This study demonstrates the contribution of student-led intervention when aligned with district priorities.
Limitations
One limitation of this study was the nonrandom assignment of the parishes, although differences were controlled for. Few study sites were used, although these sites represent rural subcounties in the district. The study duration was limited to less than eight months, and only the immediate effects could be evaluated. However, this still provided findings that can be a basis for long-term follow-up. Finally, assessing the quality of CLTS was not done since it was out of the scope of this study. However, the mentioned limitations do not affect the results presented.
Strengths
The application of a DID estimator, along with the incorporation of baseline covariates that differ between the groups, reduces the likelihood of bias in the effect estimates of the intervention relative to the control in this study.
Conclusions
Students were able to use the CLTS approach to reduce OD in the parishes with the support of the existing health infrastructure. This therefore demonstrates that students can be an important resource in supporting rural communities that may be facing problems in the availability of human resources in resource-constrained settings.
Existing CLTS programmes should look at harnessing other resource persons, such as students under the COBERS approach, to promote and facilitate communities towards achieving the ODF status in the different communities.
The reference list from the paper itself. Each links out to its DOI / PubMed record.
- 1World Health Organization water, sanitation and hygiene strategy 2018-2025.Water, Sanitation and Hygiene: Strategy 2018-2025 8 2024 Geneva, Switzerland World Health Organization 2018 https://iris.who.int/bitstream/handle/10665/274273/WHO-CED-PHE-WSH-18.03-eng.pdf
- 2Leaving no one behind: evaluating access to water, sanitation and hygiene for vulnerable and marginalized groups Sci Total Environ Ezbakhe F Giné-Garriga R Pérez-Foguet A 53754668320193114605910.1016/j.scitotenv.2019.05.207 · doi ↗ · pubmed ↗
- 3UNICEF. Progress on household drinking water, sanitation and hygiene 2000-2022: Special focus on gender. Avaialable at: https://data unicef org/resources/jmp-report-2023 Progress on Household Drinking Water, Sanitation and Hygiene 2000-2022: Special Focus on Gender 8 2024 New York, NY United Nations Children’s Fund (UNICEF)2023 https://cdn.who.int/media/docs/default-source/wash-documents/jmp-2023_layout_v 3launch_5july_low-reswhowebsite.pdf?sfvrsn=c 52136 f 5_3&download=true
- 4Measuring open defecation in India using survey questions: evidence from a randomised survey experiment BMJ Open Vyas S Srivastav N Mary D 09201910.1136/bmjopen-2019-030152 PMC 677335331558454 · doi ↗ · pubmed ↗
- 5The elimination of open defecation and its adverse health effects: a moral imperative for governments and development professionals J Water Sanit Hyg Dev Mara D 11272017 https://iwaponline.com/washdev/article-abstract/7/1/1/30446/The-elimination-of-open-defecation-and-its-adverse?redirected From=fulltext
- 6Teachers and sanitation promotion: an assessment of community-led total sanitation in Ethiopia Environ Sci Technol Crocker J Geremew A Atalie F Yetie M Bartram J 651765255020162721188110.1021/acs.est.6b 01021 PMC 4917925 · doi ↗ · pubmed ↗
- 7Forecasts of mortality and economic losses from poor water and sanitation in sub-Saharan Africa P Lo S One Fuente D Allaire M Jeuland M Whittington D 015202010.1371/journal.pone.0227611 PMC 708327032196493 · doi ↗ · pubmed ↗
- 8Goal 6: Ensure access to water and sanitation for all 4 2025 2023 https://www.un.org/sustainabledevelopment/water-and-sanitation/