Interplay Among Muscle Oxygen Saturation, Activation, and Power on a Swim-Bench
Vittorio Coloretti, Claudio Quagliarotti, Giorgio Gatta, Maria Francesca Piacentini, Matteo Cortesi, Silvia Fantozzi

TL;DR
This study examines how muscle oxygen saturation, electrical activation, and power output interact during swimming exercises using oximeters and sEMG.
Contribution
The study is the first to combine oximeters and sEMG during swimming exercises with mechanical power output analysis.
Findings
Both SmO2 and sEMG signals increased significantly with higher mechanical power during the incremental test.
sEMG detected muscle fatigue through changes in spectral indexes, while no such correlation was found with SmO2.
Strong correlations were observed between mechanical power and SmO2, as well as between mechanical power and sEMG amplitude.
Abstract
Muscle activity during exercise is typically assessed using oximeters, to evaluate local oxygen saturation (SmO2), or surface electromyography (sEMG), to analyze electrical activation. Despite the importance of combining these analyses, no study has evaluated both of them during specific swimming exercises in combination with mechanical power output. This study aimed to assess muscle activity during an incremental test on a swim-bench utilizing oximeters and sEMG. Nine male swimmers performed a five-steps test: PRE (3 min at rest), STEP 1, 2, and 3 (swimming at a frequency of 25, 30, and 40 cycle/min for a duration of 2, 2, and 1 min, respectively), and POST (5 min at rest). Each swimmer wore two oximeters and sEMG, one for each triceps brachii. Stroke frequency and arm mechanical power (from ~13 to ~52 watts) estimated by the swim-bench were different among all steps, while no…
Genes, proteins, chemicals, diseases, species, mutations and cell lines named across the full text — each resolved to its canonical identifier and authoritative record.
Click any figure to enlarge with its caption.
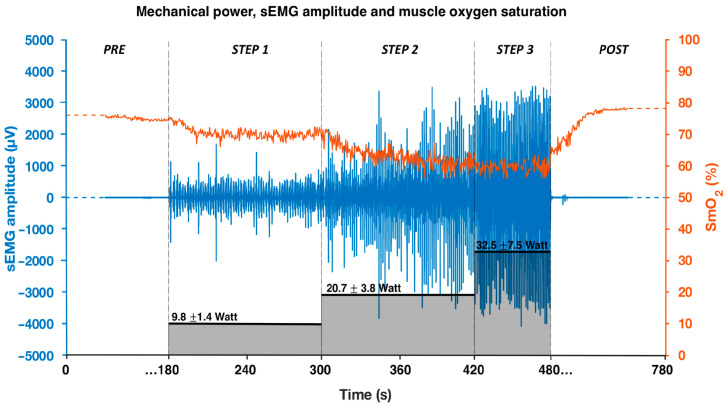 Figure 1
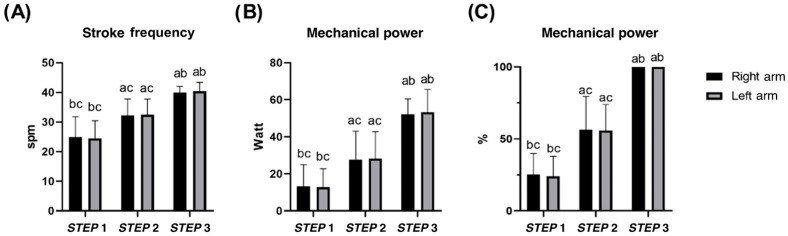 Figure 2
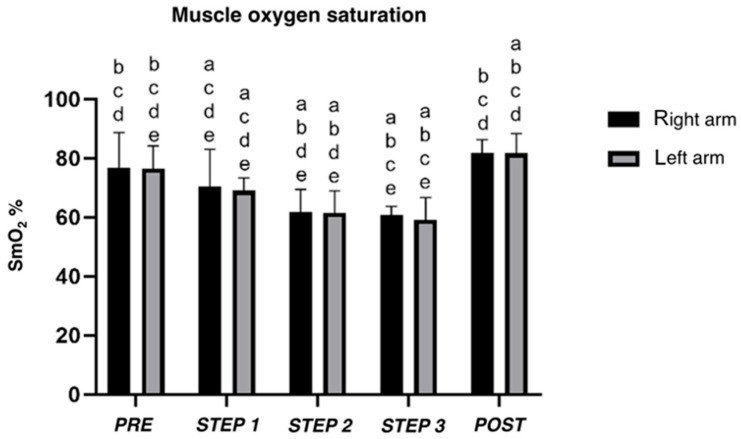 Figure 3
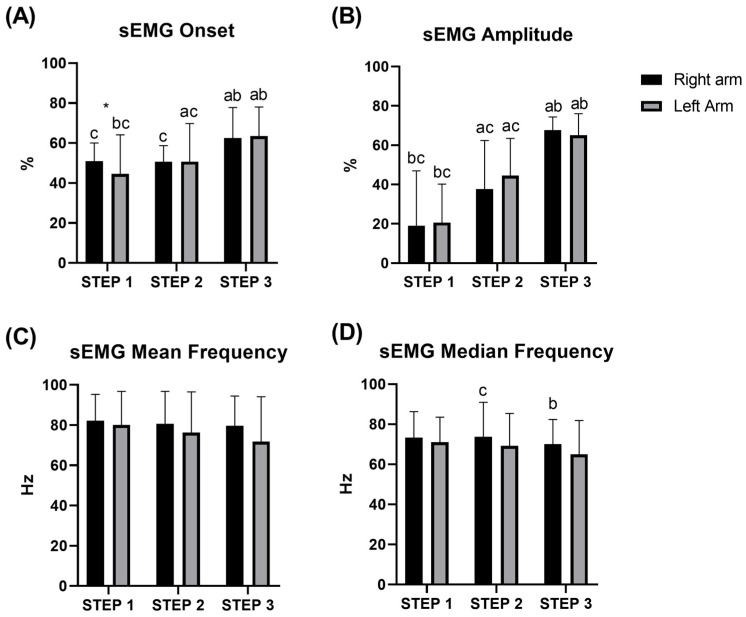 Figure 4
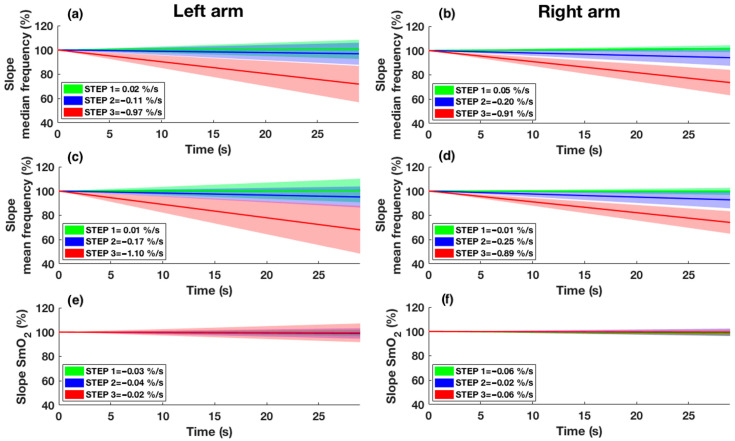 Figure 5
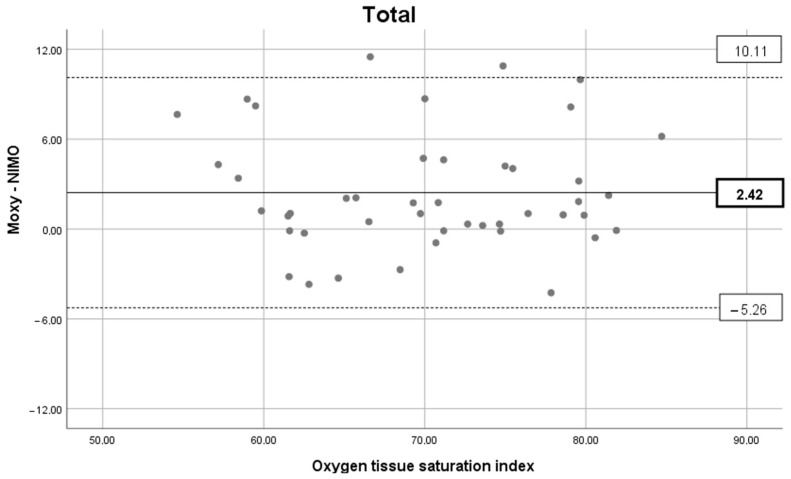 Figure 6
Peer Reviews
No public reviews on file for this paper yet. If you reviewed it on a platform where reviews are public (OpenReview, ICLR, NeurIPS, ICML), you can paste yours below so the community can read it here.
Videos
No videos yet. Explain this paper in a talk, walkthrough, or lecture? Add one.
Taxonomy
TopicsSports Performance and Training · Cardiovascular and exercise physiology · Muscle activation and electromyography studies
1. Introduction
Assessing muscle activity during exercise is crucial for understanding movement patterns, thereby enabling the advancement of biomechanics models, performance optimization, and injury prevention [1,2]. Since muscle activity requires energy production, largely supported by aerobic metabolism in many sports performances, scientists and practitioners in sports science have focused on the assessment of skeletal muscle oxygen delivery and utilization [3,4]. This assessment is normally performed by the evaluation of muscle oxygen saturation (SmO_2_) facilitated by the recent availability of various non-invasive commercial instruments [3,4]. While oximeter sensors have primarily been used to assess SmO_2_ in cycling, running, sport climbing, and resistance training [3], their application in swimming remains limited. Existing swimming studies have focused on evaluating the influence of warm-up or breathing pattern on muscle oxygenation [5,6], as well as studying the relationship between SmO_2_ and other physiological parameters (i.e., heart rate and blood lactate concentration) as an acute effect [7], after different types of recovery [8] or after a training period [9].
As the energy demand for sport performance increases, muscle electrical activation also rises in terms of motor unit recruitment and synchronization [10]. Surface electromyography sensors are used to implement an ecological methodology for measuring muscle electrical activation (sEMG) [2]. In swimming, sEMG was utilized primarily to assess muscle activation patterns in different stroke phases [11], to evaluate electrical manifestation of local muscular fatigue [12], and to analyze muscle synergies [13].
Muscle electrical activation and local muscle oxygenation during swimming may be interconnected, as both reflect the muscle’s energy demand and consumption. As swimming effort increases, the corresponding rise in muscle oxygen consumption, driven by higher energy demands, is linked to greater muscle activity. The distinct physiological insights provided by oximetry and electromyography highlight the need to explore their relationship in greater depth. Integrating SmO_2_ and electrical activation would offer a more holistic and complementary assessment of muscle activity [3]. Indeed, instrumentation including both oximeter and sEMG sensors has been developed [14], and several studies have evaluated muscle oxygenation and activation during strength exercises [14], isometric exercises [15], or dynamic movements (mainly in cycling) [1,14,16,17]. However, no scientific article evaluating muscle activity during simulated swimming exercises by both sensors has been published to date [3], as those undertaken were focused on upper limb and/or on isometric exercises [18]. For water propulsion, it is essential to perform this type of analysis in dynamic controlled conditions, ensuring precise power measurement and movement patterns that closely mimic swimming. In this respect, the swim-bench has been recognized as the most effective tool for dry-land simulated swimming analysis [19].
This study combined the use of oximeters and sEMG for the assessment of the muscle activity of triceps brachii during an incremental test on a swim-bench. The primary objective is to investigate the relationship between muscle oxygen saturation, activation, and power, exploiting SmO_2_, sEMG, and swim-bench, respectively. It was hypothesized that a relationship among these variables will persist even under dynamic conditions and more complex sport-specific movements, such as simulated swimming. Furthermore, since minimal body encumbrance is a required feature for swimming training applications, the measurement agreement between a wearable, wireless oximeter and a wired counterpart was assessed, to control for potential instrumentation-related discrepancies. (see Appendix A).
2. Materials and Methods
2.1. Participants
The inclusion criteria for the study required participants to be male swimmers specialized in sprint or middle-distance events, with experience in using a swim-bench; while the exclusion criteria were recent muscle or joint injuries, orthopedic, or cardiovascular disease within 3 months before the test.
Nine male swimmers (22.3 ± 2.3 yrs, 181.8 ± 4.9 cm, 76.6 ± 5.2 kg), including five sprinters and four middle-distancers with a personal race best corresponding to 756.4 ± 87.4 World Aquatics points (Level 2–3 [20]) were recruited for the study (see Supplementary Materials for details). All swimmers had been training for at least 12 years, and they had swum, in the last 5 years, a minimum of six days per week, with a training volume ranging between 6 and 7 km per session. They were well-trained in the crawl technique and confident in the use of a swim-bench. Only male and national-level swimmers were included to avoid gender and level biases. Information about the study procedures was provided to each swimmer several days before the data acquisition.
2.2. Design
After a standard warm-up of 20 min (simulating dry warm-up before a swimming race and including performing a few minutes at slow pace followed by some spurts on a swim-bench), one incremental step test was performed at the swim-bench by each swimmer wearing two oximeters and two sEMG sensors, one for each triceps brachii. During the test, participants adopted a prone position and were instructed to simulate the front crawl swimming action as closely as possible, including the arm recovery phase. The incremental test was composed of five steps: PRE (3 min at rest), STEP 1, 2, and 3 (simulated swimming at a frequency of 25, 30, and 40 stroke cycles per minute for durations of 2 min, 2 min, and 1 min, respectively), and POST (5 min at rest). A metronome allowed participants to maintain a constant stroke frequency. The swimmers were instructed to be in a fully rested and hydrated state and avoid intensive exercises 48 h before the test.
2.3. Methodology
The swimmers performed the test using an integrated swimming machine (swim-bench) for the assessment of arm power output (prototype instrumentation [19,21,22]). The calibration of the air-dynes, both static and dynamic, was carried out following the detailed methodology and features outlined by Zamparo and Swaine [21]. The incremental test was adopted similarly to previous studies conducted with the aim of assessing muscle activation at different intensities [1,23]. The swim-bench measured both stroke frequency and mechanical power expressed by each stroke. The mean value within the central 30 s for each step was used.
Two different near-infrared spectroscopy-derived muscle oxygen saturation sensors were placed in the same position on the right (MOXY, 2 Hz; Fortiori Design LLC, Hutchinson, MN, USA) and left (NIMO, 40 Hz; Nirox srl, Borgosatollo (BS), Italy) arm triceps brachii belly. The sensors were fixed with adhesive and cohesive bands (Fixomull and CoPlus, BSN Medical, Hamburg, Germany) adjacent to the respective sEMG sensor on the same muscle belly, and both were covered with a black plastic bag to prevent exposure to extraneous light. Each oximeter emitting near-infrared light can measure the tissue concentration of oxyhemoglobin (O_2_Hb) and deoxyhemoglobin (HHb). During all the trials, the tissue hemoglobin saturation index (SmO_2_, expressed in % and calculated as [O_2_Hb]/([O_2_Hb] + [HHb]) was directly assessed by the two oximeters.
Two wireless and waterproof surface electromyography (sEMG) sensors (MiniWave, Cometa, Milano, Italy) with a sampling frequency of 2000 Hz were used to assess muscle activation. To enhance the contact between electrodes and the body, the skin of each participant was shaved and abraded following the standards set by SENIAM [24]. Subsequently, Ag/AgCl disposable electrodes (30 × 24 mm) with an active area of 0.8 cm^2^ and an inter-electrode distance of approximately 2 cm were applied in a bipolar configuration. The electrodes were positioned on the belly of the left and right triceps brachii, adjacent to the respective oximeter sensor on the same muscle belly. To optimize signal detection, the surface electrodes were aligned parallel to the direction of the muscle fibers [24]. The sensors were secured to the skin utilizing a cohesive bandage (CoPlus, BSN Medical, Hamburg, Germany) to minimize movement artifacts. The raw signals were: (i) filtered within a band-pass filter (Butterworth, 20–450 Hz), (ii) rectified, and (iii) smoothed using a low-pass filter (6 Hz, 4th order Butterworth) to obtain the linear envelope. The temporal interval of the signal activation interval was assessed for each stroke cycle, and it was expressed as a percentage of the total stroke cycle duration (onset). The mean activation for each stroke cycle onset was expressed as the percentage of the signal maximal value, identified during each step (amplitude). Moreover, to obtain information about the electrical manifestation of local muscular fatigue during the trial, spectral analysis was carried out on each activation interval and the mean and median frequency of the power spectrum of each stroke cycle were identified [25]. Subsequently, the slopes of the mean frequency, median frequency, and SmO_2_ were analyzed. To account for differences in scale between variables, data were normalized: EMG spectral parameters (mean and median frequency) and SmO_2_ were scaled relative to their range values recorded throughout the test. All values are expressed as percentages. The slope of each step was then computed via linear regression to assess the within-step temporal variation of the spectral indices and muscle oxygenation [25].
Thus, at each step, the mean ± standard deviation was estimated in the 30 central seconds (between 45 and 75 in STEP 1 and 2, and between 15 and 45 in STEP 3) for all the parameters analyzed by the swim-bench, oximeter sensors, and sEMG.
All the analyses discussed were conducted using MatLab (MathWorks, Naticks, MA, USA, 2020b).
2.4. Statistical Analysis
The statistical package SPSS version 25.0 (IBM, Chicago, IL, USA) for Windows OS was used for statistical analysis. The significance level was set at p ≤ 0.05. Data are presented as the median ± interquartile range.
The non-parametric Friedman test, both with Kendall’s Wallis as the effect size, was performed to assess the differences between steps in the scalar variables, such as stroke frequency, power output, sEMG parameters (amplitude, onset, mean frequency, and median frequency) and SmO_2_. Moreover, the same analysis was performed to compare the slope of the mean/median frequency and the slope of SmO_2_ between the steps and arms. The Wilcoxon test, both with the biserial correlation (r) as effect size, was utilized as a post hoc test in the case of significance in the Friedman test. The non-parametric Mann–Whitney U-test, both with biserial correlation (r) as the effect size, was performed to assess the differences in scalar variables between the right and left arm. The correlation between each measured variable of the same arm was assessed by biserial correlation (r). The value of r was considered as follows: small (0.100–0.299), moderate (0.300–0.499), large (0.500–0.699), very large (0.700–0.899), and extremely large (≥0.900) [26]. Post hoc power analysis was performed utilizing G*Power (version 3.1; Heinrich Heine Universität Düsseldorf). All power analyses had an alpha level of 0.05, nine subjects, and a specific effect size.
3. Results
Raw data acquired by the sEMG and oximeter sensors during the test are presented together with the mechanical power in Figure 1. As mechanical power increases, a reduction in muscle oxygenation and an increase in muscle activation are observed.
Stroke frequency and mechanical power measured by the swim-bench were different among all steps (all p < 0.05), and consistent between arms. No differences were observed between arms for both variables (all p > 0.05; see Supplementary Materials for details) (Figure 2).
Muscle oxygen saturation (Figure 3) decreased between each step for both arms (left arm; p < 0.05). Comparing PRE- and POST-incremental step tests, different results for right (p = 0.086) and left arms (p = 0.038) were found (see Supplementary Materials for details).
Electromyography signal of the triceps brachii indicated differences between all steps in amplitude and onset (all p < 0.05), except for the right arm between STEP 1 and 2 (p = 0.26). No differences were observed between the left and right arm (all p > 0.05), except for STEP 1 for the onset (p = 0.024) (Figure 4). No differences were detected either between the steps or between the arms, for both the mean frequency and median frequency of the sEMG signal (see Supplementary Materials for details).
The mean and median frequency slope as well as the SmO_2_ slope are shown in Figure 5. Slope analysis revealed differences between steps for mean (p = 0.013 and p = 0.001, respectively, for the left and right arm) and median frequency (p = 0.004 and p = 0.002, respectively, for the left and right arm) and no differences for SmO_2_ (p = 0.459 and p = 0.895, respectively, for the left and right arm). Post hoc analysis showed differences between STEP 1 and 3, and STEP 2 and 3 (p < 0.05) for the median and mean frequency of both arms, except for the median frequency of the right arm, which showed differences even between STEP 1 and 2 (p < 0.05). No differences were detected between arms (p > 0.05).
Correlations between the mean values of mechanical power, SmO_2_, and sEMG are presented in Table 1 for the right and left arms. Significant correlations were observed between mechanical output (power and stroke frequency) and the sEMG parameters (amplitude and onset), while negative correlations were found between mechanical output (power and stroke frequency) and SmO_2_, or between SmO_2_ and the sEMG amplitude. Correlations between the slope of SmO_2_ and the sEMG spectral indexes are presented in Table 2, where no significant correlations were detected. These correlations were consistent across both arms.
The Appendix A provides information on the concurrent agreement between the wearable, wireless oximeter on the right arm (MOXY), and a cabled gold standard oximeter on the left arm (NIMO), while detailed statistical analysis of power, activation, and muscle oxygenation are available in the Supplementary Materials.
4. Discussion
The present study aimed to assess the interplay among muscle oxygenation, activity, and power simultaneously during swimming simulation. As the muscle activation required to generate greater mechanical power increased, a reduction in muscle oxygenation was observed in a controlled incremental exercise on the swim-bench. The relationship between local oxygenation and electrical muscle activity was found only for the amplitude of the EMG signal, but not for the frequency content or the duration of the activation.
The three incremental steps were characterized by different mechanical features. The same mechanical work of both upper limbs was controlled through the use of a metronome and verified by no significant difference between arms in stroke frequency and mechanical power. Under these dynamic controlled conditions of simulated swimming, the results obtained from the two instruments revealed that both oximeters and sEMG are capable of identifying the three distinct exercise intensities. Indeed, a decrease in SmO_2_, meaning an increase in local oxygen consumption, and an increase in both the onset and amplitude of the electromyographic signal are observed for each step. These instruments could, therefore, be useful to obtain more information on exercise intensity, allowing for a more in-depth analysis in the aquatic environment of different swimming techniques [27,28], different recovery profiles and adaptation [9,28,29], or electrical manifestation of muscle fatigue, as well as of the influence of mental fatigue protocols [12,30].
Investigating the relationship among the three different features of muscle, significant correlations were observed between mechanical work and oxygenation, and between mechanical work and all parameters of muscle activation, except for the mean/median frequency. However, the correlation between SmO_2_ and sEMG was significant only for the amplitude feature (r > −0.500, p < 0.05). Similarly to the relationship between propulsive phase and swimming velocity in aquatic environment [31], an increase in the percentage duration of the activation phase with higher swimming intensity was observed in this study. However, it seems that among the parameters estimated from EMG, only the signal amplitude is representative of the intensity of the muscle contraction, showing a large correlation with SmO_2_ [32].
Previously, other studies have evaluated the relationship between the information from an oximeter and sEMG during isometric and dynamic exercises. Regarding isometric exercises, similar results to ours were highlighted. Moalla et al. [15] found a negative correlation between muscle oxygenation and the EMG root mean square during isometric knee extension (r = −0.71). Later, Praagman et al. [18] found a linear relationship between oxygen consumption, EMG amplitude, and external loads during isometric contractions of the biceps breve and brachioradialis muscle. In particular, the correlation between oxygen consumption and EMG amplitude was higher than ours for the biceps breve (r = 0.81) and brachioradialis (r = 0.94). Regarding dynamic exercises, in a very similar study to ours, Miura et al. [1] found a high correlation (r = −0.947 to −0.993) in the vastus lateralis muscle between EMG impulse and SmO_2_ during constant work rate (from 50 to 250 watts) on a cycling ergometer. Despite the similarity, the data analyses were different from the present study. For instance, the mean SmO_2_ was compared to the impulse of EMG, both calculated over 30 s of exercise. By contrast, in our work, only the amplitude of the onset part of the signal was considered as the percentage of the maximal force, excluding the signal portion where the muscle was considered deactivated. This procedure allowed us to analyze both the information regarding duration of the activation (i.e., onset) and the intensity of the activation (i.e., amplitude). Moreover, in a more recent study, which utilized EMG and an oximeter during the Astrand–Rhyming Step Test and the Astrand Treadmill Test, a positive correlation was found between data from the oximeter and sEMG with results similar to ours (0.788 and 0.470 for active and non-active participants, respectively) [16]. However, in contrast to the present work, the results derive from the correlation of the HHb and sEMG patterns of the gastrocnemius muscle, instead of the mean SmO_2_ and mean amplitude value of sEMG. In summary, our results appear to agree with previous studies, except for a slightly lower value of the negative correlation. This discrepancy could be attributed to the different approaches in the studies. On one side, because dynamic exercises are more influenced by movement noise than isometric exercises [33], on the other, muscles with a smaller belly may lead to increased difficulty in collecting data [34].
On the other hand, our data showed no differences in the average mean and median frequency of the electromyographic signal throughout the test, thus failing to detect an electrical manifestation of muscle fatigue using this type of approach. Typically, such manifestations are detected through the slope of the spectral indices during isometric contraction [35,36,37], or under constant and high-intensity workloads, as in the case of swimming [12,25]. In the present study, we hypothesized that different workloads might induce different degrees of peripheral muscle fatigue, which would be reflected in the average spectral indices. Accordingly, we applied a simplified method by averaging the spectral EMG indices over the mid-portion of each test step. However, this analytical approach may have lacked sensitivity, masking intra-cycle spectral variability. Indeed, using conventional analysis, a difference in the slope of the regression line between steps was revealed, suggesting that muscle fatigue may manifest differently depending on exercise intensity [38]. Notably, no significant correlation was found between muscle oxygenation assessed via oximeters, and the electrical manifestation of fatigue, either when comparing average values or when evaluating the slopes of the respective regression trends. In fact, although a progressive decline in mean and median EMG frequencies was evident, this was not paralleled by a comparable trend in tissue oxygenation, which exhibited relatively flatter slope profiles.
These results are in contrast with previous studies investigating local fatigue by oximeter and sEMG sensors simultaneously [35,36,37]. However, previously published papers have investigated this relationship during isometric contractions. Taelman et al. [36] observed that, during isometric contractions, a likely factor contributing to muscle fatigue is the constriction of blood vessels and the resulting poor perfusion. This is a physiological condition that does not occur to the same extent during dynamic movements, which may explain the discrepancies observed in comparison with the studies cited. Moreover, it is known how the assessment of dynamic, rather than static, contractions can hide several issues, such as changes in volume conductor properties and electrode position shifts to the analyzed muscle fibers due to variations in joint angle [39]. In contrast, the cyclic nature of the exercise may help in reducing variability and measurement artifacts [39], as reliability in biomechanics is linked to the reliability of the EMG spectral parameters [40].
The present study has some limitations. Considering the limited number of subjects involved, power analysis was performed and showed values higher than 78% (see Supplementary Materials). Another limitation was that only stroke frequency was used to control the intensity of the trial, instead of a percentage of MVC [15,18] or wattage imposed [1]. This was caused by the instrumental limitation of the swim-bench. However, post-control of the stroke frequency and mechanical power showed the incremental work of both arms with no difference in the sides of the body, as well as consistency across subjects. Moreover, the present study analyzed only the triceps brachii muscles, even though other muscles are also particularly involved in the technical swimming act (e.g., latissimus dorsi, pectoralis major, or biceps brachii [2]). Although the triceps brachii is one of the most important and extensively studied muscles in swimming, the lack of analysis of additional muscles may conceal potential compensatory strategies [41]. Consequently, the results and considerations presented in this study should be interpreted taking account of this limitation and cannot be generalized to other muscles. In the present study, only the average value of the middle portion of each step was analyzed to assess the correlation between the sEMG and SmO_2_ parameters due to a lack of direct synchronization of the individual devices used. It would, therefore, be interesting in the future to carry out an instantaneous point-to-point comparison of the various parameters, although in our specific case, all the values were observed to be stable within the middle portion of each step. Finally, the relationship between the EMG amplitude and mechanical power is treated in this work as linear, without considering motor unit derecruitment or selective fatigue of fast-twitch fibers. However, considering that the relationship was based on the mean value of the step, the magnitude of this approximation should be less significant.
In the future, a multi-muscles analysis could help to further understand the degree of utilization and coordination of the different muscles involved during specific movements, as in the case of swimming. In particular, the use of instruments with water-resistant features would allow analysis in the real swimming environment [9,42,43], as in the case of the development of the wireless oximeter used in this study. Moreover, it would also be interesting to investigate in more detail the relationship between the electrical manifestation of muscular fatigue indexes and oxygenation related to peripheral fatigue, which surprisingly showed no interactions. In this context, the individuation of the physiological benchmarks (such as ventilatory/lactate thresholds, %HR or %VO_2_max) may highlight other considerations about the responses of SmO_2_ and sEMG during an effort.
In conclusion, the results obtained indicate that both oximeters and sEMG enable assessment of effort variation during swimming simulation, as already highlighted in isometric and cycling exercises. In particular, it shows that there are correlations between muscle activation and oxygenation during dynamic exercises, or sport-specific exercise as in this case, not only on the lower limbs [16] but also on the upper limbs. Nonetheless, this relationship appears to be confined to the identification of differing effort corresponding to different exercise intensities during the test, whereas only sEMG demonstrated the ability to detect localized fatigue through the electrical manifestations of muscular fatigue. This observation may indicate that, under dynamic conditions, sEMG represents a more suitable tool for the assessment of fatigue manifestation, while the oximeter may be more appropriate for distinguishing between varying levels of exercise intensity.
The reference list from the paper itself. Each links out to its DOI / PubMed record.
- 1Miura H. Araki H. Matoba H. Kitagawa K. Relationship Among Oxygenation, Myoelectric Activity, and Lactic Acid Accumulation in Vastus Lateralis Muscle During Exercise with Constant Work Rate Int. J. Sports Med.20002118018410.1055/s-2000-30110834349 · doi ↗ · pubmed ↗
- 2Martens J. Figueiredo P. Daly D. Electromyography in the four competitive swimming strokes: A systematic review J. Electromyogr. Kinesiol.20152527329110.1016/j.jelekin.2014.12.00325556010 · doi ↗ · pubmed ↗
- 3Perrey S. Quaresima V. Ferrari M. Muscle Oximetry in Sports Science: An Updated Systematic Review Sports Med.20245497599610.1007/s 40279-023-01987-x 38345731 PMC 11052892 · doi ↗ · pubmed ↗
- 4Perrey S. Ferrari M. Muscle Oximetry in Sports Science: A Systematic Review Sports Med.20184859761610.1007/s 40279-017-0820-129177977 · doi ↗ · pubmed ↗
- 5Mc Gowan C.J. Pyne D.B. Thompson K.G. Raglin J.S. Osborne M. Rattray B. Elite sprint swimming performance is enhanced by completion of additional warm-up activities J. Sports Sci.2017351493149910.1080/02640414.2016.122332927631544 · doi ↗ · pubmed ↗
- 6Grossman K.J. Lim D.J. Murias J.M. Belfry G.R. The Effect of Breathing Patterns Common to Competitive Swimming on Gas Exchange and Muscle Deoxygenation During Heavy-Intensity Fartlek Exercise Front. Physiol.20211272395110.3389/fphys.2021.72395134899369 PMC 8652135 · doi ↗ · pubmed ↗
- 7Dalamitros A.A. Semaltianou E. Toubekis A.G. Kabasakalis A. Muscle Oxygenation, Heart Rate, and Blood Lactate Concentration During Submaximal and Maximal Interval Swimming Front. Sports Act. Living 2021375992510.3389/fspor.2021.75992534966893 PMC 8711718 · doi ↗ · pubmed ↗
- 8Pratama A.B. Yimlamai T. Effects of Active and Passive Recovery on Muscle Oxygenation and Swimming Performance Int. J. Sports Physiol. Perform.2020151289129610.1123/ijspp.2019-053732942256 · doi ↗ · pubmed ↗