Nutritional Risk Factors Model of Community-Dwelling Older People in Poland–Pilot Study
Robert Gajda, Marzena Jeżewska-Zychowicz, Karolina Rak, Monika Maćków

TL;DR
This pilot study in Poland identifies key nutritional risk factors for older adults, including unhealthy eating and body weight perception, and proposes a model for further testing.
Contribution
The study introduces a new nutritional risk factors model tailored for older people in Poland using exploratory and confirmatory factor analysis.
Findings
Three key factors were identified: unhealthy eating, meal irregularities, and body weight perception.
The model showed acceptability through confirmatory factor analysis and reliability metrics.
Variation in nutritional risk factors was observed based on gender, education, and social factors.
Abstract
Nutritional risk factors are country-specific and change over time, requiring systematic verification. Objective: The study was designed to develop a nutritional risk factors model for seniors living in a Polish community. Methods: The pilot study was conducted in 2022 and 2023 among 301 people aged 60 and older in the Lower Silesia region of Poland. The questionnaire contained 107 test items describing dietary problems rated on a five-point Likert scale. The pre-study concerned understanding of the test items, rating the reproducibility (kappa statistic) and reliability of the scale (α-Cronbach coefficient). The factor structure of the model was developed using structural equation modelling (SEM) in the program R (version 4.3.2.). An exploratory factor analysis (EFA) extracted the three-factor model. Results: The factors were described as unhealthy eating (eight test items),…
Genes, proteins, chemicals, diseases, species, mutations and cell lines named across the full text — each resolved to its canonical identifier and authoritative record.
Click any figure to enlarge with its caption.
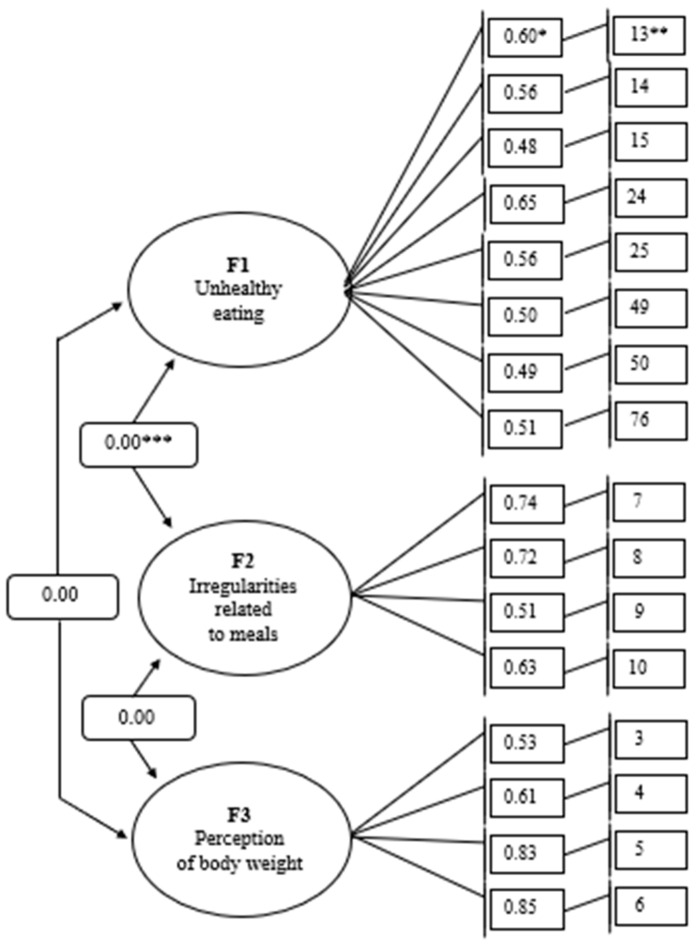 Figure 1
- —Wroclaw University of Environmental and Life Sciences
- —National Science Centre, Poland
Peer Reviews
No public reviews on file for this paper yet. If you reviewed it on a platform where reviews are public (OpenReview, ICLR, NeurIPS, ICML), you can paste yours below so the community can read it here.
Videos
No videos yet. Explain this paper in a talk, walkthrough, or lecture? Add one.
Taxonomy
TopicsNutrition and Health in Aging · Nutritional Studies and Diet · Nutrition, Health and Food Behavior
1. Introduction
Globally, the number and proportion of adults aged 60 and older are increasing [1]. By 2050, the number of people aged 65 and over will be around 1.5 billion, meaning that one in six people worldwide will be of this age [2]. In Poland, the subpopulation of older people aged 60 and over in 2023 accounted for 26.3% of the total population, and the proportion has been growing steadily yearly since 2006 [3]. As the population ages, the prevalence of chronic diseases and multimorbidity will also increase [4,5]. For older people, non-communicable diseases are the main health risk [6]. Until recently, cardiovascular disease, cancer, and type 2 diabetes accounted for 11 million diet-related deaths [7]. In addition, 255 million attributable disability-adjusted life years (DALYs) could be traced back to nutritional risk factors [8].
Human eating behaviour changes over time as it is linked to the life cycle, and the environment in which it operates [9,10,11,12,13]. The reasons relate to changing demographic, sociocultural, psychological, globalisation, climatic, and epidemiological conditions over time [9,10,11,12,13]. Improvements towards healthy eating behaviours could prevent one out of five deaths worldwide [7]. However, changes in these behaviours can contribute to identifying various nutritional problems, which experts define as nutritional risk factors [14,15]. Among the global population, the most commonly identified dietary risk factors are low intake of vegetables, fruits, whole grains, and dairy products [7,16,17]. The consumption of these food groups is below the theoretical minimum risk exposure level (TMREL), which minimizes the risk of all causes of death [7]. Diets lacking in vegetables (<290–430 g per day), fruit (<200–300 g per day), whole grains (<100–150 g per day) and dairy products (<350–520 g per day) cause 65% of all diet-related deaths and 72% of all diet-related DALYs [18]. The need to identify new risk factors was confirmed during the COVID-19 pandemic [11]. At that time, excessive food consumption and consumption of highly processed food were identified as risk factors [19,20,21,22]. Among the older people, the problem is even greater. The increase in risk factors in this age group is related to the changes in the body and state of health [23] and to the lower socioeconomic status of older people [24]. Among the most commonly reported nutritional risk factors noted in the literature are as follows: change in body weight due to improper diet [25,26,27,28]; food intake that differs from dietary recommendations for older people [25,29,30,31]; problems with over- or under-consumption of food supplements and meal replacements [25,28,30,32]; problems associated with poor nutrition resulting from various functional disorders of the gastrointestinal tract [25,26,27,33]; nutritional problems linked to lack of social support [25,26,34,35]; problems with access to food [25,26,34]; problems with food preparation [25,26]; and change in appetite due to medication [25,26,27].
It is essential to eliminate nutritional risk factors in the lives of older people. Studies have shown that healthier eating habits are associated with better individual health outcomes, such as reduced risks of all-cause mortality, frailty, cardiovascular diseases, chronic conditions, type 2 diabetes, and neurodegenerative diseases [36,37,38,39,40,41,42]. Healthier eating habits, such as increased consumption of fruits and vegetables, can also lower the risks of depression, anxiety, central obesity, and cognitive health issues like Alzheimer’s disease in older adults [43,44,45,46,47]. Conversely, older adults with lower dietary diversity are more likely to experience anxiety or loneliness [48,49]. Despite the consensus on the definition of malnutrition, there is still no distinction between nutritional risk and malnutrition risk [50]. While the risk of malnutrition refers to individuals with indicators of malnutrition, such as very low food intake, weight loss, and abnormal functional and health parameters, nutritional risk refers to conditions and factors related only to a reduced quantity, increased quantity, or inappropriate quality of food consumed. Over time, failure to address these conditions or factors can lead to malnutrition or overweight-related health problems [25].
Older people living in the community may have problems with food consumption and therefore may be vulnerable to nutritional risks [28,30,51,52,53]. This can lead to poorer health and higher mortality rates [27,28,29,30]. According to a worldwide study using the SCREEN-14 questionnaire (Seniors in the Community: Risk Evaluation for Eating and Nutrition), the problem of high nutritional risk among older people (age 65 and older) affects 61.5 to 70.1% [54], and individual and environmental factors determine these risks.
The nutritional risk is more widespread than the risk of malnutrition and is most likely to affect community-dwelling older people in Poland as well [55]. Based on the SCREEN-14 questionnaire, a recent study found that as many as 77.5% of Polish older people living in the community are affected by high nutritional risk [56,57]. In this context, the study focused on what nutritional risk factors occur in older people living in local communities in Poland and how sociodemographic and economic factors differentiate the occurrence of nutritional risk factors. This study aimed to develop a nutritional risk factors model of community-dwelling older people in Poland, considering selected sociodemographic and economic characteristics.
2. Materials and Methods
2.1. Study Design and Sample
The pilot study was conducted between December 2022 and December 2023, with participants aged 60 and older. A non-probability sample selection was used. The choice of this method was based on the fact that it is cost-effective and helps to recruit reluctant individuals to the study. The references from known individuals helped recruit the study group. Through the Wrocław Center for Social Development, clubs, foundations, and other senior citizen organizations in the city of Wroclaw and in several counties of the Lower Silesian province—Wrocław, Świdnik, Trzebnica, and Sieradz districts—were asked to participate in the study. A total of 301 questionnaires were distributed to twelve senior citizen organizations, including six in the city of Wrocław (n = 183), one each in the districts of Trzebnica (n = 12) and Sieradz (n = 10), and two in the districts of Świdnica (n = 64) and Wrocław (n = 32). The study was conducted in small groups in the presence of one of the authors, who thoroughly explained and supported respondents in completing the questionnaires. The questionnaire was completed in person by the respondents. In case of any difficulties, the study’s author completed the questionnaire. The recruitment criteria were age 60 and over and residence in the community. The exclusion criterion for the study was the lack of informed consent to participate in the study. The recruitment principles for the study is presented in Table 1. Ultimately, 301 respondents aged between 60 and 94 (71.6 ± 5.77) participated in the study, including 241 women and 60 men.
The study was conducted under the guidelines presented in the Declaration of Helsinki [58]. Participation in the survey was voluntary. Informed consent to participate in the study, permission to publish the study results, and permission to process personal data for scientific purposes were obtained from all participants. The Bioethics Committee of the Medical University of Wrocław approved the study on 21 December 2022, opinion number: KB-912/2022.
2.2. Questionnaire
The questionnaire was developed to identify nutritional risk factors based on the available literature on nutritional risk among older people. The questionnaire contained 107 test items describing nutritional risk factors [25,26,27,28,29,31,34,35,59]. The test included the following items: changes in body weight over the past 6 months and perceptions of body weight (items 1–6); nutritional problems, i.e., food intake and nutrition from the dietary recommendations recommended for the older people according to the guidelines of the National Center for Nutrition Education in Poland [31] (items 7–60); consumption of dietary supplements and meal replacements (items 61–75); problems associated with food consumption due to various functional disorders of the gastrointestinal tract (items 76–84); problems with access to food (items 85–89); problems with food preparation (items 90–92); problems with food consumption for social reasons (items 93–103); and changes in appetite related to drug intake (items: 105–107). A 5-point Likert scale was used to assess nutritional risk situations, with a range of responses: no (1), rather not (2), neither no nor yes (3), rather yes (4), yes (5).
Questions on gender, age, place of residence, education, social activity, family relationships, family and social financial support, personal financial situation, and household economic situation were used to characterize the study group and to differentiate nutritional risk factors in sociodemographic and economic terms, which were taken from the KomPAN questionnaire [60].
To prepare the questionnaire for the study, a pre-study consisting of two stages was conducted:
Pre-testing was conducted to assess understanding of each test item. Sixteen people at a selected senior citizens’ club in Wrocław were asked to participate in the pre-testing phase. A 3-point scale was used to assess understanding of the description of the situation, with the following answers: I understand (1 point), I partially understand (2 points), I do not understand (3 points). This was followed by a panel discussion among the same people, which focused on their understanding of the situation and suggestions regarding the misunderstood content. For each item, a mean score of 1.5 or more (X ≥ 1.5) indicated misunderstanding. One hundred seven items were tested, among which eighty-eight were incorrectly understood. Based on this information and the results of the discussion panel, 10 test items were removed from the questionnaire. Other items were corrected grammatically, logically, and linguistically. The revised questionnaire (97 test items) was retested with a group of 17 people in a selected senior citizens’ club in the Świdnica district using the same rating scale and the criterion for understanding the description of the item (X ≥ 1.5). This time, all items were understandable, considering the adopted criteria.
In the next stage, the reproducibility and reliability of the questionnaire were assessed. At a selected senior citizen club in Wrocław, 93 people were asked to fill out a questionnaire and, after 3 weeks, to fill it out again (retest). To verify the measurement accuracy of the tested variables, a reliability analysis was performed using Cronbach’s alpha method [29]. The Cronbach’s alpha reliability coefficient for the scale (97 test items) was estimated at α = 0.88 (M = 2.10; SD = 0.41) and showed that this measure’s reliability had a high measurement accuracy. Cohen’s kappa statistic was used to assess the questionnaire’s reproducibility. The questionnaire achieved excellent agreement by 7 test items, good by 37, moderate by 27, and poor by 26. All sixteen items included in the model of nutritional risk factors described in the Results section had at least moderate agreement, which was considered acceptable.
A description of the nutritional risk items included in the study questionnaire (97 test items) is provided in the Appendix A (Table A1).
2.3. Statistical Analysis
Descriptive statistics were used to show the sociodemographic and economic characteristics of the sample.
The reliability of the questionnaire for identifying nutritional risk factors of Polish seniors was tested using Cronbach’s alpha coefficient, with a value higher than 0.70 considered acceptable [61,62]. The concordance of the test items (test–retest) of the questionnaire was assessed using the kappa statistic (Cohen’s kappa index). Concordance of test items is very good when the kappa statistic is ≥0.81, good (0.61–0.80), moderate (0.41–0.60), poor (0.21–0.40), and bad (≤0.20) [63,64,65]. A kappa index of at least 0.41 was considered acceptable.
To develop the factor model of the nutritional risk, structural equation modelling (SEM) was carried out in the program R and using the package “lavaan” [66]. The ULSMV (unweighted least squares mean and variance adjusted test statistic) algorithm was used for the calculation. ULSMV is often the preferred estimation algorithm due to its ability to handle ordinal data (e.g., Likert scale) that does not meet the assumptions of normal distribution [67].
Exploratory factor analysis (EFA) with varimax rotation with Kaiser normalization allowed confirmation of the factor structure. The following criteria were used to determine the number of factors: an eigenvalue of 1.0, a scree plot test, and factor loadings of at least 0.45. The Kaiser–Meyer–Olkin (KMO) measure of 0.780 and Bartlett’s sphericity test at p < 0.0001 confirmed the factoriality of the data [68].
The fit of the factor structure identified during the EFA was tested using confirmatory factor analysis (CFA). The following model fit indices were evaluated: chi-square/degree of freedom (χ^2^/df), comparative fit index (CFI), Tucker–Lewis index (TLI), Bollen’s incremental fit index (IFI), root mean square error of approximation (RMSEA), standardized root mean square residual (SRMR), goodness-of-fit statistic (GFI), and adjusted goodness-of-fit statistic (AGFI). Acceptable values of the listed parameters are χ^2^/df below 2 or 3; CFI ≥ 0.95; TLI ≥ 0.95; IFI ≥ 0.95; RMSEA < 0.06; SRMR < 0.01; GFI and AGFI, the closer the value is to 1, the better the explanation of the theoretical model by the data [62,69,70,71].
To test the model using SEM analysis, the direction of influence (→) of the emergent factor (latent variable) on the test items was determined, and the determination coefficients were calculated (R^2^) [72].
The test items trafficities in the model were assessed using two indicators: AVE (average variance extracted) to assess convergent accuracy and HTMT (heterotrait–monotrait ratio) to assess differentia accuracy. AVE > 0.50 indicates that the assumption of convergent accuracy is satisfied. HTMT ≤ 0.80 suggests that the assumption of differential accuracy between measurements is met. The reliability of the measurement was assessed using Cronbach’s alpha index and CR (composite reliability). Cronbach’s alpha coefficients and CR > 0.70 indicate acceptable measurement accuracy [73,74,75].
Two categories were identified within each factor: low factor intensity and high factor intensity. The median for the factorial values was used as the cut-off point. For factor 1 (F1), Me = −0.023, factor 2 (F2), Me = −0.140, and factor 3 (F3), Me = −0.120, with low intensity < Me and high intensity ≥Me. The chi^2^ test determined the differences between factor intensity and selected sociodemographic and economic characteristics. A p-value < 0.05 was considered significant.
3. Results
3.1. Characteristics of Study Sample
The sociodemographic and economic characteristics of the study group are shown in Table 2. The study sample consisted of 301 respondents, represented mainly by women (80.1%), people aged 60–74 (72.8%), and residing in Wrocław city (60.8%), the district of Świdnica (21.2%), or the district of Wrocław (10.6%). The most significant number of respondents had secondary education (50.5%), average financial status (80.1%), and declared no need for family (81.4%) or social financial support (86.0%).
3.2. Structure of the Factorial Model
The structure of the factor model is shown in Table 3. The EFA analysis resulted in three factors described as the following: factor 1 “unhealthy eating”, factor 2 “irregularities related to meals”, factor 3 “perception of body weight”. Factor 1 (F1) concerns dietary situations related to low dietary variety, limiting or omitting healthy foods, and eating unhealthy foods simultaneously. This factor identified a low frequency of vegetable consumption (less than twice a day) and a high frequency (daily) of consuming highly processed foods (powdered soups, canned or jarred, refrigerated, and frozen foods). This factor also included opinions on the difficulty of choosing healthy foods when shopping. Factor 2 (F2) was related to situations involving incorrect number or frequency of meals, too few meals (less than three meals per day/breaks between meals longer than four hours), or too many meals (more than six meals per day/breaks between meals shorter than two hours). Factor 3 (F3) considered situations related to weight change and included subjective assessments indicating too low weight (I think my weight is too low/would like to increase my weight) or too high weight (I think my weight is too high/would like to decrease my weight).
3.3. Characteristics of Factorial Model
The EFA and CFA resulted in a factor model with the correlation of factors shown in Figure 1. All test items included in the selected factors obtained acceptable values of standardized factor loadings (β > 0.4). The CFA was also used to estimate model fit indexes (Table 4). The values of the CFI, TLI, NFI, IFI, RMSAE, and SRMR measures indicate a relatively good fit of the data to the tested model. The values of the GFI and AGFI measures ranged from 0.93 to 0.95. The closer the values are to 1.00 for the GFI and AGFI measures, the better the explanation of the theoretical model by the data. The chi-square test result did not meet the conditions for fitting the data to the tested model, slightly exceeding the acceptable criterion (χ^2^/df = 3.34).
SEM analysis showed that all the emerging factors significantly impacted the variables tested in the model. In addition, the SEM analysis showed that none of the emerging factors had their non-specific indicators. The direction of influence of the emergent factors in the model on the variables tested and an assessment of the predictive power of the factor model are shown in Table 5. Test items such as: “I think my body weight is too low” (R^2^ = 0.73), “I think my body weight is too high” (R^2^ = 0.69), “I eat three or fewer meals per day” (R^2^ = 0.55), “I eat six or more meals per day” (R^2^ = 0. 52), “I eat raw vegetables and fruits less than twice a day” (R^2^ = 0.43), “The gaps between my meals are longer than four hours” (R^2^ = 0.40), are explained by the model by at least 40%. The model explained the remaining test items by at least 24%.
Verification of the assumption of measurement reliability showed that Cronbach’s alpha (internal reliability) and CR coefficient (construct reliability) met this assumption for all factors in the tested model. Verification of the assumption of meeting convergent accuracy (AVE) showed that only factor 3 met the assumptions (Table 6). On the other hand, verifying the assumption of differential accuracy (HTMT) showed that factor 1 and factor 2 measure different information, similarly, factor 1 and factor 3, and factor 2 and factor 3. Thus, HTMT analysis meets the assumption of differential accuracy for the models tested (Table 7).
3.4. Sociodemographic and Economic Determinants of the Nutritional Risk Factors
Age, place of residence, family and social financial support, personal financial situation, and household economic situation did not differentiate the intensity of nutritional risk factors. High intensity of factor 1 (F1) related to unhealthy eating was more common in men. As education increased, the proportion of people with a high intensity of this factor decreased, but it improved as family relationships deteriorated (Table 7). A greater frequency of various social activities and poorer family relationships were associated with high factor 2 (F2) intensity involving meal irregularities. High intensity of factor 3 (F3) related to perceived body weight was more common among women, those with higher education, higher social activity, and poorer family relationships (Table 8).
4. Discussion
The identification of nutritional risk factors currently experienced by community-dwelling older people in Poland was driven by two main reasons: 1/changing nutritional risk factors over time, which requires monitoring [9,10,11,12,13]; 2/the higher exposure of older people than other population groups to nutritional risks and associated health consequences [27,28,29,30,51,52,53]. This study aimed to identify nutritional risk factors in community-dwelling older people, considering selected sociodemographic and economic characteristics.
To achieve the aim, the model of nutritional risk factors was developed, and then the validity and reliability of the model were assessed using structural equation modelling (SEM). The model fits the data because values of fitness indexes, i.e., indexes of absolute fit (RMSEA and GFI) and incremental fit (CFI and TLI) achieved acceptance. Only the index parsimonious fit (χ^2^/df) slightly exceeds the fit criterion [76,77]. By the recommendation, using at least one fitness index from each model category confirms the model’s fitness [78], allowing the model to be accepted. The model’s validity was assessed using convergent, construct, and discriminant validity. The convergent validity was achieved because all items in a measurement model were statistically significant [79]. However, a construct “perception of body weight” obtained the value of AVE higher than 0.50, which was expected [74]. The construct validity was achieved because the values of absolute fit indexes (i.e., RMSEA and GFI) and incremental fit indexes (i.e., CFI and TLI) confirmed it. The discriminant validity was also achieved because the measurement model was free from redundant items. Moreover, the HTMT ratio was less than 1.0, indicating that the constructs have good discriminant validity [75]. The internal consistency of the model, estimated by the Cronbach’s alpha index, is considered adequate for each one of the factors because its value was greater than 0.6 [80]. The construct reliability was confirmed by a value of CR ≥ 0.6, which is required [74]. Although the indicators obtained are satisfactory, it should be noted that the model was developed on data from only a specific sample. Thus, the findings in this study cannot be generalized because the testing of the model is limited to the sample examined in this study. Therefore, further research is needed to confirm the usefulness of this model [81].
In the identified model, one of the factors is related to nutritionally adverse situations, including those associated with poor dietary variety, limiting or omitting healthy foods from meals while consuming unhealthy foods, low frequency of vegetable consumption, and frequent consumption of highly processed foods. Previous studies, including Polish seniors, have reported the poor quality of the diet in a significant proportion of the elderly population [57,82,83], unfavourable dietary patterns [1,58], and/or low diversity of food intake [84,85]. Eating behaviour, dietary patterns, and diet quality are determined by several factors [1,84,86]. Among the differentiating factors are gender [86,87,88,89,90,91,92]; age [1,87,89,91,92]; education [84,86,88,89,91,92]; economic situation [1,86]; and social situation, including family and social support, loneliness, social isolation, and family relationships [93,94,95,96,97]. In addition, socioeconomic status, which usually refers to residence, education, social support, and economic situation, plays a crucial role [1,24,82,84]. In this study, age, place of residence, family, social and financial support, personal financial situation, and household economic situation did not differentiate the unhealthy eating factor. The association between age and eating behaviour patterns in older people is inconclusive [1]. While age was negatively associated with a “vegetable-based” pattern [87], no relationship was observed between age and the “Mediterranean” or “healthy” pattern [91,92]. In another study, a “healthy” nutritional pattern was negatively associated with age group 75 years or older in a group of women. At the same time, no association was observed in the younger age group [89]. Similarly, in the case of economic and social factors, the situation seems unclear [1,86,93,94,95,96,97]. Some studies show no relationship between income and “healthy” nutritional patterns in older people, others show a positive relationship [1,86]. In the case of social factors, while several studies have assessed the relationship between various social characteristics and dietary patterns, they have observed a different relationship [93,94,95,96,97]. Higher levels of socioeconomic status tended to be associated with more favourable diets of older people [24,82,84]. Zhu et al. [98] showed that people of low socioeconomic status tend to lead unhealthy lifestyles, including eating foods of low nutritional value. The results confirmed that the intake of foods beneficial to diet quality (vegetables, fruit, whole grains, milk, and fish) increased with higher socioeconomic status [56,98].
Research indicates that older women have a more favourable diet than men [86,87,88,89,90,91,92]. In this study, the high severity of the factor associated with unhealthy eating was more common among men, which may have been justified by the findings reporting that older women are more likely to be associated with a “healthy” or “Mediterranean” nutritional pattern [89,91,92]. It was associated with higher consumption of vegetables and pulses, fruit, cereals, potatoes, fish, seafood, and dairy products [86]. Furthermore, while habitual vegetable intake among older people was too low and is associated with risky eating behaviours, women consumed more vegetables. They were less likely to engage in risky eating behaviours than men [1].
In published studies, lower education was associated with “unfavourable” nutritional patterns or risky eating behaviours [1]. In this study, higher education was more often associated with a low intensity of factor 1 and vice versa for lower education. This finding can be confirmed by other studies, in which higher education among older people was associated with a more favourable diet, mainly a higher intake of vegetables, fruit, whole grains, and dairy products [86,88,89,91,92] and greater diversification of food consumption [84].
A similar relationship was noted for family relationships. Very good relationships were associated with low severity, and poor relationships were associated with high severity of the unhealthy eating factor. Living with a family or in a care institution was associated with more favourable eating patterns than living alone [97]. Older people characterized by close family or friendship relationships were shown to be less able to guide their preferences when choosing food [99], which may have resulted from the excessive caring function of family or friends for older people. In contrast, older people with weakened family ties were shown to have a greater capacity to be guided by their preferences. Still, the consequence of this capacity was food choice, determining lower diet quality [99].
Unhealthy eating was associated with the frequent consumption of highly processed foods by older people, mainly concentrated and semi-prepared foods or ready-to-heat meals, which can be explained in several ways. The study was conducted during the period following the lifting of the COVID-19 pandemic measures in Poland [100], which may have influenced changes in dietary behaviour [101] related to the consumption of highly processed foods [19,20,21,22]. Moreover, in the case of older people, access to this type of food was made easier, if only because of the offer of small chain and neighbourhood shops located near their residence [102,103,104], with high interest during the pandemic.
A greater frequency of various social activities and poorer family relationships were associated with high irregularities related to meals. The higher frequency of meal intake was mainly among older people eating out, especially men and those of higher socioeconomic status [105]. On the one hand, the higher social activity of older people may determine a higher frequency of eating out and therefore consuming more meals. On the other hand, high social activity may limit the time spent eating out and thus reduce the number of meals. Older people’s consumption of meals at home increases the regularity of their meals. It optimizes the number of meals consumed, with women and those with better socio-economic status being more likely to do so [105]. Poorer diet quality is related to the number of meals, lower meal quality, poorer perception of meals, and poorer enjoyment, which is seen primarily among older people living alone [106,107]. These negative dietary experiences are often seen among single men than women [106]. In contrast, eating meals by older people in the family or in the company of others was associated with higher energy and nutrient intake due to higher consumption of cereal products, meat, oils and other fats, vegetables, fruit, and mushrooms [108]. While we do not see studies evaluating the relationship between family relationships and the number and frequency of meals consumed, indirect information [106,107,108] may suggest that good family relationships among older people may influence better meal structure related to the number and frequency of meals consumed, but this requires further research.
Factor 3 was related to weight perception and included subjective assessments indicating that body weight was too low or high and a declared desire for its increase or decrease. The dynamic nature of the ideal body image, which is influenced by the changing prevalence of overweight and obesity over time [109], implies corresponding fluctuations in self-perceived body weight [110]. Consequently, research to date indicates an increasing tendency for people to identify themselves as overweight or obese [111,112,113]. A recent study found that older people perceive their body weight to be too high regardless of their actual body weight or when this was not the case [114,115]. Older people’s perceptions of their body weight consistently reveal a tendency to underestimate their actual weight, in contrast to the younger subpopulation [116,117,118,119,120]. Despite this, there is a noticeable gap in existing research on weight perception among older people [115]. Research indicates that older people’s perceptions of their body weight being too low are overlooked. Only one study found that older people, regardless of gender, who perceived their body weight as too high or too low had higher rates of poor health [121]. In this study, the weight perception factor was more common among women, those with higher education, higher social activity, and poorer family relationships. Previous research indicates differences regarding older people’s perceptions of body weight, but only in the context of gender. It was shown that it was predominantly women who undertook weight reduction efforts who perceived themselves to be overweight or obese, regardless of actual body weight [114,115].
4.1. Limitations of the Study
Although the study was carried out with a high degree of rigour, pre-verifying the survey instrument using a discussion panel, relevance and reliability tests, and using the best statistical tool for factor model design, the SEM analysis [67,122], this study has several limitations. Above all, the study is cross-sectional—the causal relationship between risk factors and their determinants and the changes in these factors over time cannot be assessed. In addition, the non-probabilistic sampling does not make it possible to relate the results to the entire population of older people in Poland. The risk factors involve subjective measures that rely on participant self-reporting, which may limit the accuracy of results [123]. Due to the peculiarities of the study group in which the model was tested and the limitations indicated earlier, it is suggested that the study be conducted again to confirm its relevance [124].
4.2. Practical Application of the Study
The procedure used in the study allowed for the inclusion of a large number of items describing various situations of older people that may constitute nutritional risk factors. These include change in body weight due to improper diet [25,26,27,28]; food intake that differs from dietary recommendations for older people [25,29,30,31]; problems with over- or under-consumption of food supplements and meal replacements [25,28,30,32]; problems associated with poor nutrition resulting from various functional disorders of the gastrointestinal tract [25,26,27,33]; nutritional problems linked to lack of social support [25,26,34,35]; problems with access to food [25,26,34]; problems with food preparation [25,26]; and change in appetite due to medication [25,26,27]. The use of modelling allowed us to reduce the number of risk factors, which can help monitor the problem of nutritional risk in the elderly population. The separation of three factors represented by 16 items results in a short scale, which can be used to monitor the problem of nutritional risk in the elderly environment. However, because this is a preliminary study, carried out in a non-representative group, further testing of this scale is necessary.
5. Conclusions
The identification of three nutritional risk factors in a group of older people living in one region in Poland is the result of an adopted and implemented research procedure. These risk factors include unhealthy eating, irregularities related to meals, and perception of body weight. Focusing on irregularities in nutrition and perception of body weight as nutritional risk factors reveals a very narrow perspective. At the same time, the results of previous studies present a comprehensive perspective of nutritional risk. The search for tools to diagnose nutritional risk in older people is becoming necessary due to the difficulty in conducting such studies. The results obtained allowed for developing a 16-item scale. Further testing in a representative group of older people in Poland and other countries is necessary to confirm the possibility of its use in diagnosing nutritional risk among older people.
The reference list from the paper itself. Each links out to its DOI / PubMed record.
- 1Eurostat Ageing Europe—Statistics on Population Development Available online: https://ec.europa.eu/eurostat/statistics-explained/index.php?title=Ageing_Europe_-_statistics_on_population_developments(accessed on 21 June 2025)
- 2United Nations World Population Ageing 2020: Highlights United Nations, Department of Economic and Social Afiairs, Population Division New York, NY, USA 2020978-92-1-148347-5
- 3Informacja o Sytuacji Osób Starszych w Polsce za 2023 Rok Available online: https://www.google.com/search?q=populacja+os%C 3%B 3b+starszych+w+polsce+w+2023(accessed on 12 August 2024)
- 4Afshar S. Roderick P.J. Kowal P. Dimitrov B.D. Hill A.G. Multimorbidity and the inequalities of global ageing: A crosssectional study of 28 countries using the World Health Surveys BMC Public Health 20151577610.1186/s 12889-015-2008-726268536 PMC 4534141 · doi ↗ · pubmed ↗
- 5Prince M.J. Wu F. Guo Y. Gutierrez Robledo L.M. O’Donnell M. Sullivan R. Yusuf S. The burden of disease in older people and implications for health policy and practice Lancet 201538554956210.1016/S 0140-6736(14)61347-725468153 · doi ↗ · pubmed ↗
- 6World Health Organization World Health Statistics 2021: Monitoring Health for the SD Gs, Sustainable Development Goals World Health Organization Geneva, Switzerland 2021978-92-4-002705-3
- 7Afshin A. Sur P.J. Fay K.A. Cornaby L. Ferrara G. Salama J.S. Mullany E.C. Abate K.H. Abbafati C. Abebe Z. Health effects of dietary risks in 195 countries, 1990–2017: A systematic analysis for the Global Burden of Disease Study 2017 Lancet 20193931958197210.1016/S 0140-6736(19)30041-830954305 PMC 6899507 · doi ↗ · pubmed ↗
- 8Chen A. Jacobsen K.H. Deshmukh A.A. Cantor S.B. The evolution of the disability-adjusted life year (DALY)Soc.-Econ. Plan. Sci.201549101510.1016/j.seps.2014.12.002 · doi ↗