GeneHarmony: A Knowledge-Based Tool for Biomarker Discovery in Disease: Sjögren’s Disease vs. Rheumatoid Arthritis and Systemic Lupus Erythematosus
Micaela F. Beckman, Adam Alexander, Jean-Luc C. Mougeot, Farah Bahrani Mougeot

TL;DR
This paper introduces GeneHarmony, a tool that helps find shared genes and pathways in autoimmune diseases like Sjögren’s Disease, Rheumatoid Arthritis, and Systemic Lupus Erythematosus.
Contribution
The novel contribution is the development of GeneHarmony, a knowledge-based tool for analyzing gene-disease associations and identifying biomarkers across diseases.
Findings
Seven genes (CD4, CD8A, IL6, IL17A, TNFS13B, TNF, TRIM21) were found common to Sjögren’s Disease, Rheumatoid Arthritis, and Systemic Lupus Erythematosus.
STRINGv12 analysis identified significant KEGG pathways related to interleukin and cytokine signaling, and immune system processes.
The tool simplifies data mining for gene associations and expression across diseases using databases like Diseasesv2.0 and GTExv8.
Abstract
Sjögren’s Disease (SjD), Rheumatoid Arthritis (RA), and Systemic Lupus Erythematosus (SLE) are autoimmune diseases with overlapping genetic features, yet the etiologies of these diseases are poorly understood. Using these rheumatic diseases as an example of proof of concept, our aim was to develop a tool that simplifies analysis of gene–disease associations applicable to any disease and to perform comparisons. This tool is meant to provide insights into associated gene symbols and gene expression data to identify candidate biomarkers in common among these diseases. The Diseasesv2.0 and GTExv8 databases were utilized for data collection, providing searchable disease names, affiliated gene symbols, confidence scores (ranging from 0 to 5, with 5 being the most confident), and gene expression across the panel of 54 tissue types present in GTExv8. Data infrastructure was established on a…
Genes, proteins, chemicals, diseases, species, mutations and cell lines named across the full text — each resolved to its canonical identifier and authoritative record.
Click any figure to enlarge with its caption.
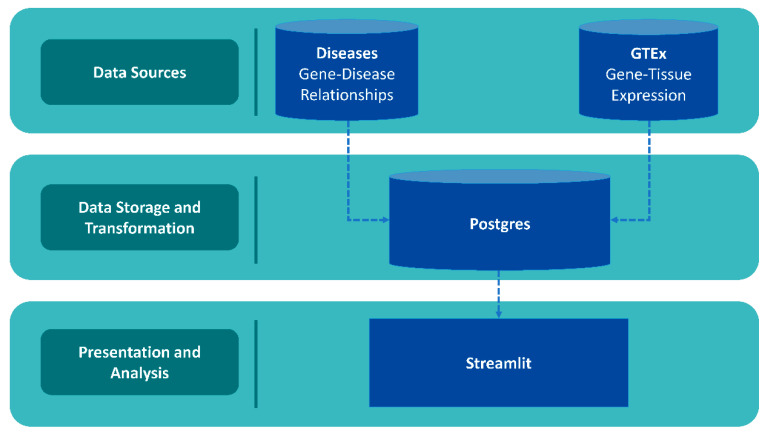 Figure 1
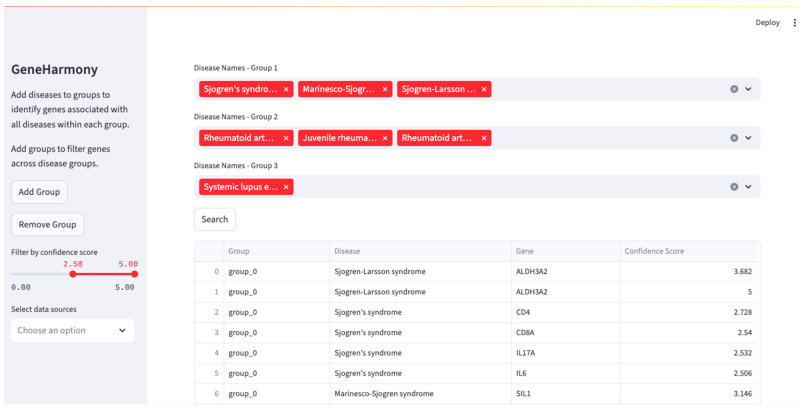 Figure 2
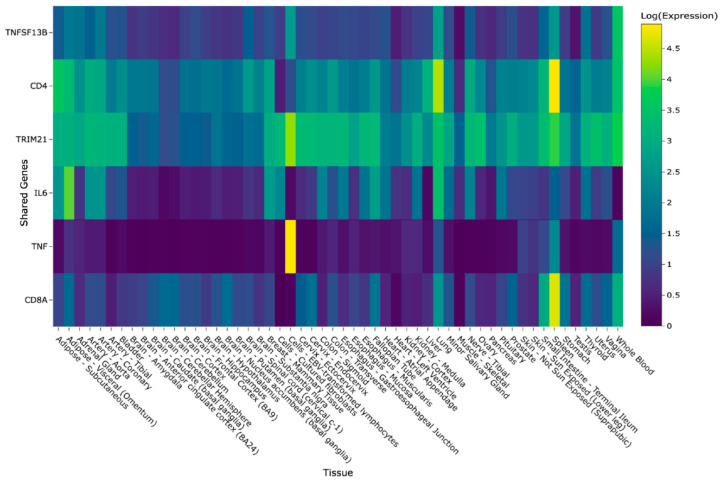 Figure 3
- —the Atrium Health Foundation Research fund
Peer Reviews
No public reviews on file for this paper yet. If you reviewed it on a platform where reviews are public (OpenReview, ICLR, NeurIPS, ICML), you can paste yours below so the community can read it here.
Videos
No videos yet. Explain this paper in a talk, walkthrough, or lecture? Add one.
Taxonomy
TopicsSalivary Gland Disorders and Functions · Systemic Lupus Erythematosus Research · Monoclonal and Polyclonal Antibodies Research
1. Introduction
Autoimmune diseases are complex disorders where the immune system mistakenly attacks the body’s own tissues [1]. Sjögren’s Syndrome (SS), recently renamed Sjögren’s Disease (SjD), Rheumatoid Arthritis (RA), and Systemic Lupus Erythematosus (SLE) share overlapping clinical features and complicated diagnoses [2]. Furthermore, our understanding of the underlying mechanisms of these diseases is lacking. Genetic and/or microbial biomarkers could provide insights into disease pathogenesis, aid in early diagnosis, and guide the development of targeted therapies. Recent advances in bioinformatics and genomics offer new ways to explore the genetic basis of diseases. Integrating gene–disease association data with gene expression profiles could reveal novel biomarkers and therapeutic targets. However, the vast amount of data and the specialized knowledge required for analysis still face significant challenges.
To address this, we developed GeneHarmony, a knowledge-based tool to simplify gene–disease associations and gene expression in various tissue types. GeneHarmony leverages a database infrastructure incorporating data from sources like the Diseasesv2.0 database and the Genotype-Tissue Expression (GTExv8) database [3,4,5]. This tool aims to identify candidate biomarkers and serve as a versatile platform for the study of multiple diseases with overlapping or similar pathogenesis. By streamlining data mining and making complex datasets accessible, further insights into the mechanisms of diseases and similar conditions may be discovered, thereby promoting diagnostic and therapeutic development. GeneHarmony provides information obtained from publicly available resources and is available for download at https://www.github.com/mbeckm01/GeneHarmony.
2. Results
Data Usage and Application Results
Data and accompanying scripts can be downloaded from the GeneHarmonyv1.0 GitHub page (http://www.github.com/mbeckm01/GeneHarmony). There are 40,288 unique diseases included in GeneHarmony for analysis from Diseasesv2.0. GTExv8 data contains gene expression values of 56,200 Ensembl gene ID’s for 54 tissue types (excluding normal immune cells). Figure 1 shows the entity-relationship diagram of GeneHarmony.
A screenshot of the GeneHarmony-selected disease groups is presented in Figure 2. Initial query results revealed a significant number of genes associated with each disease group: 2000 genes for the first group, 6837 for the second, and 5453 for the third. Among these, 1421 genes were identified as common across all selected disease groups. Seeking to refine these results, we adjusted the gene–disease confidence score filter to a range from 2.50 to 5.00. This adjustment yielded a smaller set of genes: 12 for the first disease group, 231 for the second, and 137 for the third. The associated genes, pre- and post-filtering, are available in Supplemental File S1. Further, sensitivity testing of multiple confidence score ranges with the number of genes in common are presented in Supplemental Table S1. Seven genes were found to be common across all three disease groups after applying the refined filter. A Venn diagram showing the overlapping output can be found in Supplemental Figure S1. The resulting genes in common were CD4 molecule (CD4), CD8 subunit alpha (CD8A), interleukin 17A (IL17A), interleukin 6 (IL6), tumor necrosis factor (TNF), TNF superfamily member 13b (TNFSF13B), and tripartite motif containing 21 (TRIM21).
Further interaction with the gene expression heatmap provided insights into the expression levels of the above-mentioned genes in various tissues. Notably, high expression levels were observed in log-adjusted TPM for the following tissues and genes: EBV-transformed lymphocyte tissues for TNF, spleen tissues for CD8A and CD4, and lung tissues for CD4. The heatmap presented within GeneHarmony is presented in Figure 3. IL17A, known to be expressed by Th17 cells and at a lower level by CD4^+^ regulatory rTh17 cells, was not expressed in any of the 54 tissue types presented in the heatmap [6].
The Search Tool for Retrieval of Interacting Genes (STRINGv12) analysis at a medium confidence resulted in all genes in common having protein–protein interactions. Additionally, 41 Kyoto Encyclopedia of Genes and Genomes (KEGG) pathways were determined as significant. Significant pathways included Antifolate resistance (hsa01523; FDR = 0.0017), Graft-versus-Host Disease (hsa05332; FDR= 0.0021), Rheumatoid Arthritis (hsa05323; FDR = 4.13 × 10^−6^), Hematopoietic cell lineage (hsa04640; FDR = 4.13 × 10^−6^), Yersinia infection (hsa05135; FDR = 4.92 × 10^−6^), and Systemic Lupus Erythematosus (hsa05322; FDR = 0.0082). The pathways for Rheumatoid Arthritis, Hematopoietic cell lineage, and Yersinia infection resulted in 4 of the 12 genes being included in the gene set. The gene TNF was present in 17 of 20 (85%) of the top KEGG pathways, while IL6 was present in 16 of the 20 (80%). The top 20 pathways are presented in Table 1.
3. Discussion
This case study demonstrates the power of GeneHarmony to facilitate complex analyses of gene–disease associations, allowing for a deeper understanding of the genetic overlaps in chronic diseases. Here, we were able to identify important genes in common between Sjögren’s Disease, Rheumatoid Arthritis, and Systemic Lupus Erythematosus, as well as their gene expression values in multiple tissue types. Furthermore, we showed how GeneHarmony can be used in downstream analysis to identify significant pathways related to genes in common. Through the application of specific filters and the analysis of gene expression data, we were able to highlight genes and pathways of interest that may play crucial roles in the pathology of these autoimmune diseases.
We were able to determine seven genes in common between the three disease groups, leading to downstream analysis confirming that the genes involved are related to the KEGG pathways of ‘Rheumatoid Arthritis’ and ‘Systemic Lupus Erythematosus’. Using GeneHarmony, we were able to identify TNF (alias TNF-α) and IL6 as important genes associated with all three disease groups, which might provide further insight into SjD development of autoimmunity systemically. The genes TNF and IL6 were the most important among all significant pathways being present in 85% and 80% of the top 20 significant KEGG pathways, respectively.
TNF may have conflicting roles in the immune system, having the ability to induce inflammatory processes as well as fight infections and provide immunity against pathogens [7]. TNF has been shown to play a role in the pathogenesis of SjD using mice models but its role in the immune system is complex and not fully understood [8]. In SjD, targeting TNF-α has been shown to be ineffective, resulting in continued dysregulated cytokine levels and even increased TNF-α levels after treatment [9]. In RA, TNF activates synovial fibroblasts causing cathepsin and MMP overproduction, resulting in the breakdown of collagen, cartilage, and bones [7]. There are several available TNF inhibitors that have proved to be effective in the reduction in disease progression in patients with RA [10]. A study investigating the role of TNF-α in SLE suggested that anti-autoimmune effects could lead to autoantibodies production and the stimulation of pro-inflammatory mechanisms in SLE development [11]. It has also been suggested that TNF-a inhibitors block access to regulatory TNFR2 and the pro-apoptotic TNFR1 receptors, resulting in deregulated signaling function of TNFR2 [12]. Due to this and the possibility of increased risk of infection, drug-induced Lupus Erythematosus, and possible increased risk of cancer, many healthcare professionals avoid using anti-TNF-α therapies as treatment for SLE [13,14,15].
A study by Grisius et al. found elevated concentrations of IL6 in serum of patients with SjD compared to healthy controls [16]. IL6 functions in the production of Th17 cells (expressing IL17A) and can activate local B cells. In SjD, this mechanism can lead to the release of more IL6 [17]. Like TNF-α, IL6 has diverse functions in the immune system and has recently become a prospective target for treatment of the disease. Targeting IL6 may disrupt its protective effects while failing to address the multi-inflammatory pathways involved in the development of SjD and SLE [18]. Additionally, IL6 is not seen as the primary driver of inflammation in patients with SjD or SLE. Instead, SjD and SLE are characterized by infiltration of T cells into tissues, creating a positive feedback loop through the production of pro-inflammatory cytokines through the induction of B cell activation [19,20]. Moreover, the ability of Th17 cells to change their characteristics and functions based on their microenvironment proves their status as challenging drug targets to alleviate symptoms and slow down the progression of autoimmune diseases, warranting a broader treatment strategy [21]. Drugs such as rituximab, tocilizumab, and bortezomib have conflicting results in the treatment of SjD, demonstrating inconsistencies, clinical improvements, or lack of systemic involvement improvement in IL6 and Th17/ IL17 [17,22,23,24,25].
This tool allowed us to see genes in common and determine possible future diagnostic and/or drug targets that have not previously been investigated for their effectiveness in the treatment of these three diseases. For example, TRIM21 was implicated in all three diseases but we were unable to identify any studies using drugs targeting TRIM21, such as vilazodone, in the treatment of SjD, RA, or SLE despite research suggesting it may lead to reduced pro-inflammatory gene expression and immune modulation [26]. Additionally, CD4 and CD8A are crucial components of the immune system, playing a vital role in T cell activation and function. The drug ibalizumab works to target CD4, binding to the CD4 receptor that prevents HIV from binding to CXCR4 or CCR5. CXCR4 has been shown to have increased expression in SjD patients, causing increased migration of immune cells into lacrimal glands [27]. Moreover, CXCR4 has been shown to be highly expressed in the serum and joint synovial fluid of patients with RA and upregulated in circulating B cells in patients with active SLE, promoting infiltration into renal tissues [28,29]. However, no studies have investigated ibalizumab for its efficacy in these diseases.
Currently, this tool does not consider sex-specific gene expression patterns and their contributions to diseases. In rheumatic diseases such as SjD, RA, and SLE, there is a known disparity in female-to-male incidence. Recently, global studies have placed the female-to-male ratio at a 14:1 ratio for SjD, a 3:1 ratio for RA, and a 4–14:1 ratio for SLE, depending on ethnicity [30,31,32]. More recent studies have highlighted the relationship between X chromosome presence and risk of developing autoimmune diseases [32,33]. These studies revealed women with Klinefelter (XXY) or Triple X (XXX) syndromes and men with Klinefelter syndrome (XXY) have similar risks of autoimmune diseases. However, it has been determined that women with Turner’s syndrome (XO) experience a decreased risk [32,34,35,36]. A gene found on the X chromosome, CXorf21, was found to be upregulated at the mRNA and protein level in women’s vs. men’s monocytes and overexpressed when under the effects of lipopolysaccharide (LPS) immunological challenge [37,38]. Further, the X-linked gene CXCR3, belonging to the same gene family as the previously mentioned CXCR4, has been implicated for its role in autoimmunity through its ability to direct the migration of T cells to sites of inflammation or injury [32,39]. Additionally, as women age, these genes have been shown evade X-chromosome inactivation, causing a dosage-dependent increase in gene expression and possibly contributing to the development of autoimmune diseases [40].
Imminent updates to GeneHarmony include incorporation of sex-specific gene expression data via the sex-associated gene database (SAGD) [41] to account for sex-based genetic factors and their contributions to diseases such as SjD, RA, and SLE. We also hope to incorporate GTExv8 filtering based on tissue type and expression quantitative trait loci (eQTL) data to identify common genetic variations across diseases of interest and to give insight into mutual tissue specificity and possible regulatory mechanisms. Furthermore, we hope to incorporate microbe set enrichment analysis (MSEA) data to explore the potential impact of LPS-producing bacteria on human gene expression in complex diseases, as well as data from the Human Microbiome Project to examine bacteria–tissue interactions, among other pertinent datasets [42,43]. This analysis has also highlighted the future need for experimental studies to confirm findings and standardized scoring methods to determine the relationships between genes and diseases/phenotypes from experimental, knowledge-based, and/or text mining databases.
In conclusion, while necessitating further development in integrating omics data to investigate rheumatic autoimmune diseases, GeneHarmony provides a valuable and user-friendly initial proof of concept data mining tool.
4. Methods
4.1. Database Architecture and Data Collection
Our selection criteria for integrating data sources emphasize databases with a consistent history of updates, ensuring that our tool remains relevant and adapts to evolving data sources. Diseasesv2.0 was chosen for its gene–disease association data, weekly update schedule, comprehensive analysis from multiple sources, and its methodology for ranking the strength of gene–disease relationships [3]. Full-text ranking was taken into consideration using the scoring method calculated as confidence scores from 0 to 5 [3,5]. There is a reward mechanism built in for genes and diseases mentioned together, and there are penalties for genes and diseases being mentioned in conjunction with other diseases or genes [3,5]. Namely, confidence scores are used to determine how strongly a gene is linked to a disease using text mining. First, the number of times a gene and disease are mentioned together in an abstract or a sentence is determined. Next, a score is calculated in which the score increases if a gene and disease are mentioned frequently together but decreases if the gene is mentioned with many diseases or other genes. Scores are then normalized by being converted to a z-score to reduce background noise and refined into a confidence score from 0.0 to 5.0 to account for automatic text mining never being as reliable as a human manually determining annotations and associations [3,5].
The GTExv8, offering gene–tissue expression data from RNA-seq experiments, is similarly updated regularly, contributing to the continued improvement in our tool [4]. For visualization, gene–tissue expression data is normalized by placing it in a matrix and applying an adjustment [N = log(n + 1)] to the transcripts per million (TPM) values, creating a heatmap.
The data storage infrastructure, database, and schema were established using PostgreSQLv16 [44]. PostgreSQL is a free and open-source database, also known for its capability to integrate full-text indexing, essential for potential future machine learning applications [44].
For front-end development and user interaction, we used Streamlitv1.27.2 [45]. Despite the availability of many robust web application frameworks, we chose Streamlitv1.27.2 for its ability to quickly integrate data visualizations from various libraries commonly used in bioinformatics. This tool is easy to use by bioinformaticians without the need for extensive web application development experience. We implemented Streamlitv1.27.2 data frames for displaying query results, while matplotlibv3.10 and Plotlyv5.17.0 visualizations were used for the graphical representation of common gene counts and gene expression data, respectively [45,46,47].
4.2. Download and Usage
GeneHarmony requires the installation of miniconda, pip, psycopg2v2.9.10, and Streamlitv1.27.2, as well as matplotlibv3.10.3, pandasv2.3.0, numpyv2.3.1, kaleidov1.0.0, and plotlyv5.17.0 pythonv4.3.0 packages [45,46,47,48,49,50,51,52]. Furthermore, PostgreSQL is a pre-requisite for GeneHarmony. All database files can be downloaded from OneDrive. The ‘create_disease_names.sql’ script within the ‘Streamlit ETL directory’ is used to create a streamlined table for the Streamlitv1.27.2 application while ‘modify_gtex_tpm.py’ will set up all gene expression data for use. Streamlitv1.27.2 can be started using the following command: ‘Streamlit run streamlit.py’. From here, a browser should appear, and the local IP address should appear in the terminal after running the command. The initial setup does not require any user data.
User queries are initiated by selecting a disease name from a textbox. Multiple disease names can be selected for related diseases, allowing the identification of genes in common between similarly named diseases. Additional disease groups can be added to the query to identify genes intersecting between the disease groups. When the query is executed, genes associated with each disease group are returned, along with their intersection, which is then visualized via a Venn diagram and a heatmap. Users can further refine the results using filters such as the strength of the gene–disease relationship and the source of the gene–disease association.
4.3. Application: Utilizing GeneHarmony for Cross-Disease Gene Association Analysis
In this case study, we employed GeneHarmony to investigate the genetic associations among Sjögren’s Syndrome, Rheumatoid Arthritis, and Systemic Lupus Erythematosus. The exploration began by entering the term “Sjogren” into the search field, which auto-populated with three related diseases: Sjögren’s Syndrome, Sjögren–Larsson Syndrome, and Marinesco–Sjögren Syndrome, all of which were selected for the first disease group. The second group focused on Rheumatoid Arthritis, including ‘Rheumatoid Arthritis’, ‘Juvenile Rheumatoid Arthritis’, and ‘Rheumatoid Arthritis Interstitial Lung Disease’. The query for the third group included only ‘Systemic Lupus Erythematosus’.
The analysis proceeded without the application of any filters. All available gene–disease data sources were selected, encompassing AmyCo, MedlinePlus, Target Illumination GWAS analytics (TIGA), Jensen lab texting mining sources, and UniProtKB-KW [53,54,55,56]. The gene–disease confidence score was set to span the full range from 0.00 to 5.00. Results were then refined to only include genes scoring within the top 50% of possible confidence scores between 2.50 and 5.00 to limit false positives. Genes in common were then used for STRINGv12 analysis to determine any possible protein–protein interactions using the STRINGv12 database (www.string-db.org) at a medium confidence (0.400) [57]. A Venn diagram was used to visualize the counts of overlapping genes within each disease group. A heatmap was created within GeneHarmony to visualize gene expression of the overlapping genes in 54 tissue types.
The reference list from the paper itself. Each links out to its DOI / PubMed record.
- 1Wang L. Wang F.S. Gershwin M.E. Human autoimmune diseases: A comprehensive update J. Intern. Med.201527836939510.1111/joim.1239526212387 · doi ↗ · pubmed ↗
- 2Ortíz-Fernández L. Martín J. Alarcón-Riquelme M.E. A Summary on the Genetics of Systemic Lupus Erythematosus, Rheumatoid Arthritis, Systemic Sclerosis, and Sjögren’s Syndrome Clin. Rev. Allergy Immunol.20236439241110.1007/s 12016-022-08951-z 35749015 · doi ↗ · pubmed ↗
- 3Grissa D. Junge A. Oprea T.I. Jensen L.J. Diseases 2.0: A weekly updated database of disease-gene associations from text mining and data integration Database J. Biol. Databases Curation 20222022 baac 01910.1093/database/baac 01935348648 PMC 9216524 · doi ↗ · pubmed ↗
- 4Lonsdale J. Thomas J. Salvatore M. Phillips R. Lo E. Shad S. Hasz R. Walters G. Garcia F. Young N. GT Ex Consortium the Genotype-Tissue Expression (GT Ex) project Nat. Genet.20134558058510.1038/ng.265323715323 PMC 4010069 · doi ↗ · pubmed ↗
- 5Pletscher-Frankild S. PallejàA. Tsafou K. Binder J.X. Jensen L.J. DISEASES: Text mining and data integration of disease-gene associations Methods 201574838910.1016/j.ymeth.2014.11.02025484339 · doi ↗ · pubmed ↗
- 6Mills K.H.G. IL-17 and IL-17-producing cells in protection versus pathology Nat. Rev. Immunol.202323385410.1038/s 41577-022-00746-935790881 PMC 9255545 · doi ↗ · pubmed ↗
- 7Jang D.I. Lee A.H. Shin H.Y. Song H.R. Park J.H. Kang T.B. Lee S.R. Yang S.H. The Role of Tumor Necrosis Factor Alpha (TNF-α) in Autoimmune Disease and Current TNF-α Inhibitors in Therapeutics Int. J. Mol. Sci.202122271910.3390/ijms 2205271933800290 PMC 7962638 · doi ↗ · pubmed ↗
- 8Zhou J. Kawai T. Yu Q. Pathogenic role of endogenous TNF-α in the development of Sjögren’s-like sialadenitis and secretory dysfunction in non-obese diabetic mice Lab. Investig. A J. Tech. Methods Pathol.20179745846710.1038/labinvest.2016.141PMC 537622628067896 · doi ↗ · pubmed ↗