Bimodal Genomic Approach Predicting Semaphorin 7A (SEMA7A) as Prognostic Biomarker in Adrenocortical Carcinoma
Anjali Dhall, Daiki Taniyama, Fathi Elloumi, Augustin Luna, Sudhir Varma, Suresh Kumar, Lauren Escobedo, Yilun Sun, Mirit I. Aladjem, Christophe E. Redon, Nitin Roper, William C. Reinhold, Jaydira Del Rivero, Yves Pommier

TL;DR
This study identifies SEMA7A as a poor prognostic biomarker in adrenocortical carcinoma and suggests it as a potential target for immunotherapy.
Contribution
The study introduces a bimodal genomic approach to identify SEMA7A as a novel prognostic biomarker and therapeutic target in ACC.
Findings
High SEMA7A expression is associated with poor prognosis in ACC patients (hazard ratio = 4.27; p-value < 0.001).
SEMA7A is co-expressed with integrin-β1, FAK, and MAPK/ERK signaling pathways in ACC tumors.
IHC analysis confirms a significant correlation between SEMA7A RNA and protein expression in ACC tissues.
Abstract
Adrenocortical cancer (ACC) remains a challenging disease primarily due to the scarcity of reliable biomarkers for predicting patient outcomes and informing innovative therapeutic strategies, as well as its rarity, which restricts the scope of clinical trials. In our study, we developed a bimodal approach using RNA-seq data for stratifying cancer patients and predicting prognostic biomarkers. Our findings indicate that a substantial proportion of ACC tumors exhibit expression of SEMA7A, a glycoprotein involved in Semaphorin cell surface signaling. Notably, elevated levels of SEMA7A were identified as a poor prognostic biomarker and were associated with activation of the integrin–ERK-MAPK signaling pathways. These findings were further confirmed by an IHC analysis of ACC samples obtained from tissue microarray slides and National Cancer Institute (NCI) cancer patients. These results…
Genes, proteins, chemicals, diseases, species, mutations and cell lines named across the full text — each resolved to its canonical identifier and authoritative record.
Click any figure to enlarge with its caption.
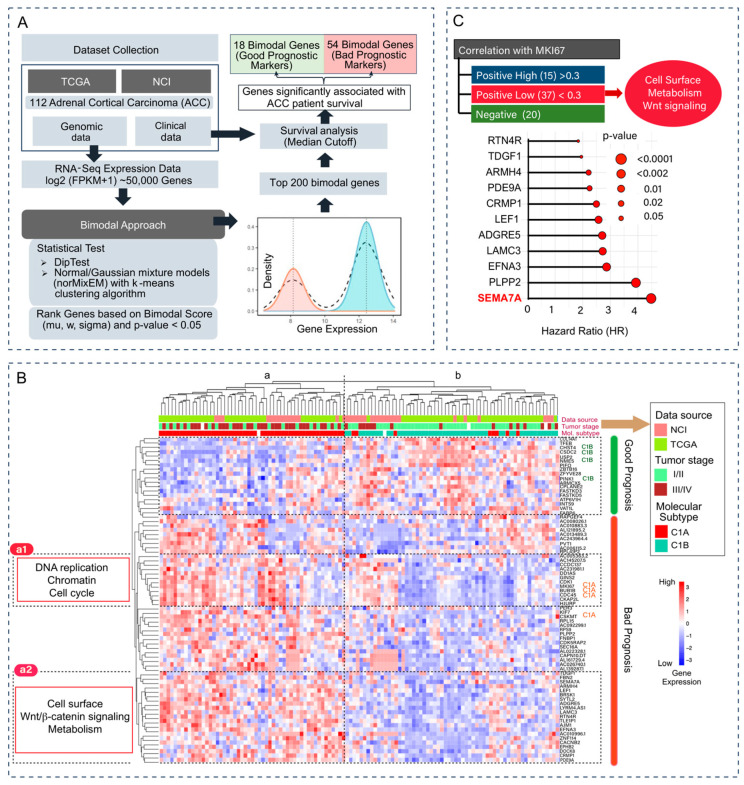 Figure 1
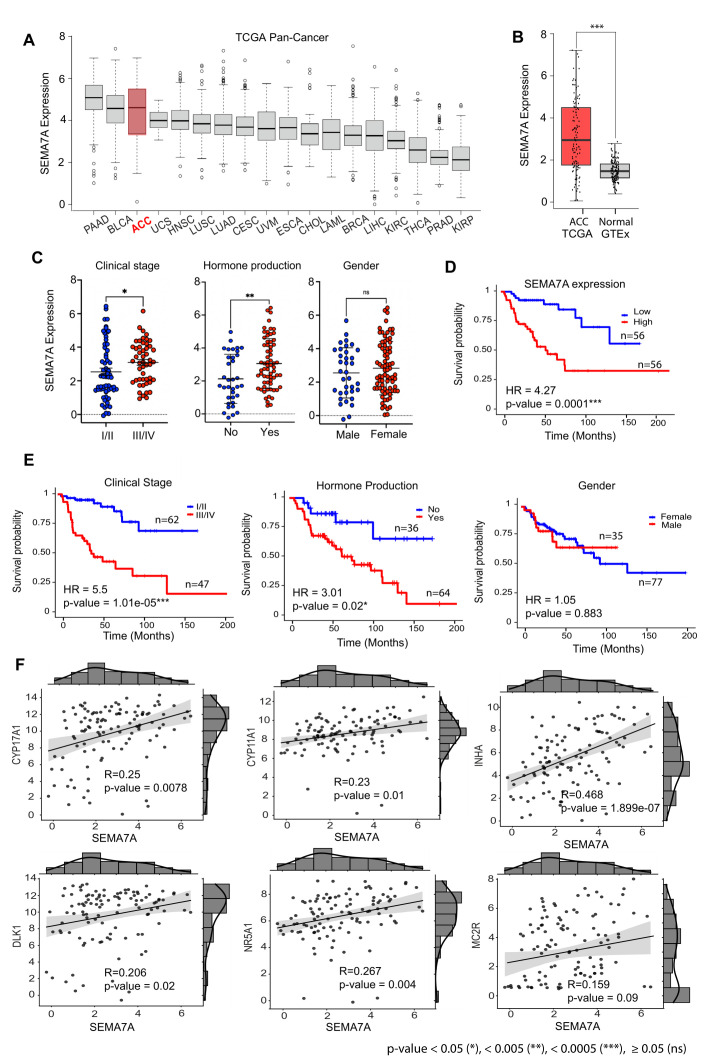 Figure 2
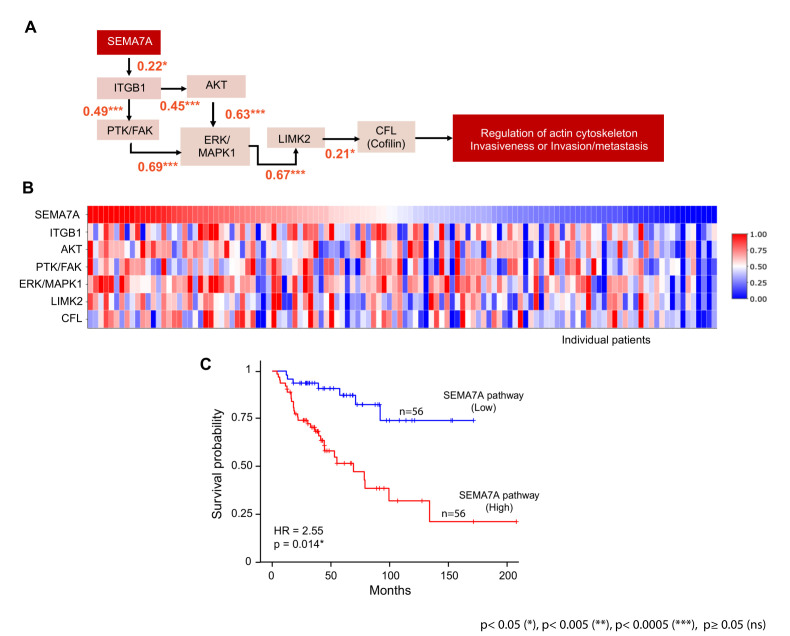 Figure 3
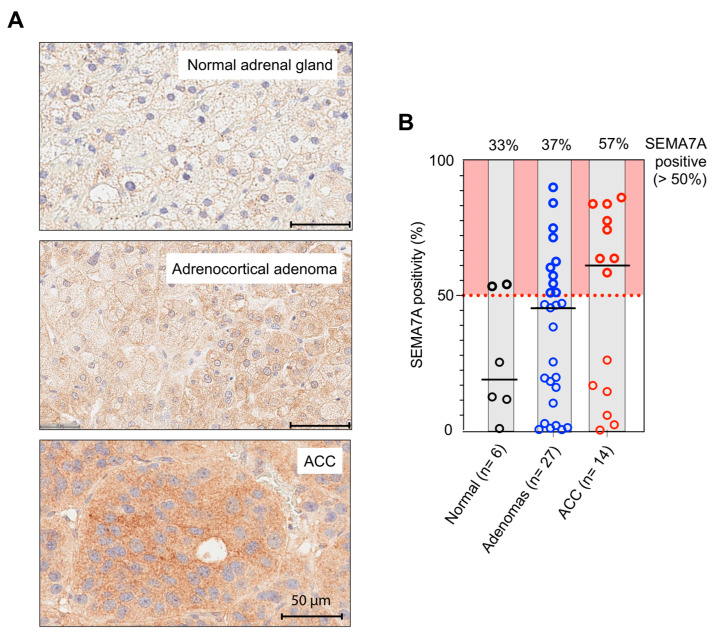 Figure 4
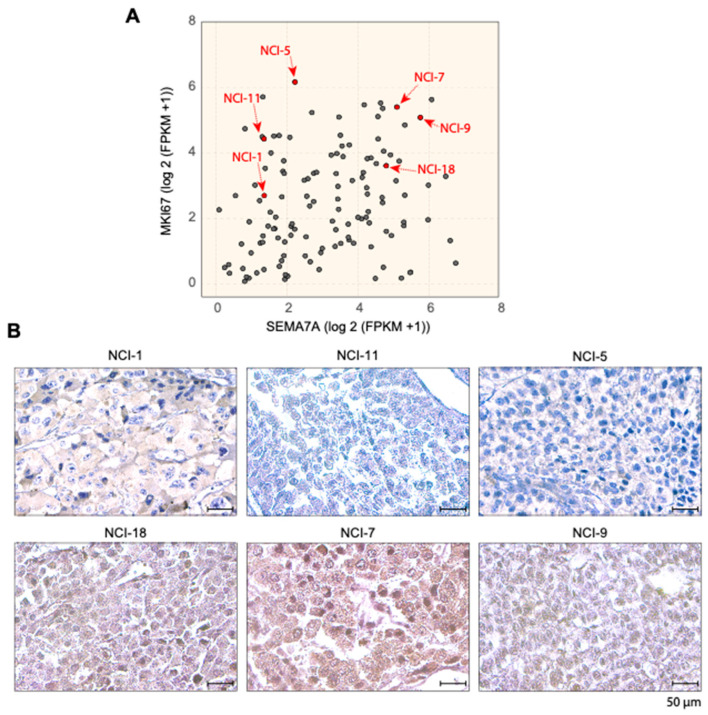 Figure 5
- —Center for Cancer Research
- —Intramural Program of the National Cancer Institute, NIH
Peer Reviews
No public reviews on file for this paper yet. If you reviewed it on a platform where reviews are public (OpenReview, ICLR, NeurIPS, ICML), you can paste yours below so the community can read it here.
Videos
No videos yet. Explain this paper in a talk, walkthrough, or lecture? Add one.
Taxonomy
TopicsAdrenal and Paraganglionic Tumors · Cancer, Hypoxia, and Metabolism · Hormonal Regulation and Hypertension
1. Introduction
Adrenocortical cancer (ACC) is a rare and aggressive malignancy arising from the adrenal cortex with high morbidity and mortality rates. The estimated annual incidence of ACC is ~0.5 to 2 cases per million individuals worldwide. Notably, the incidence of ACC demonstrates a substantial age-related variation, with a peak occurring around the age of 50. In 40–60% of patients, ACCs typically exhibit an aggressive biological behavior with symptoms of hormone hyperproduction [1]. The prognosis for patients with ACC is generally poor, with a 5-year survival rate <15% among patients with distant metastases [2]. Prognosis is closely linked to the stage at which the disease is diagnosed, with earlier-stage presentations associated with more favorable outcomes [3,4]. The heterogeneous nature of ACC complicates its diagnosis and treatment, given the variability in clinical manifestations and prognostic outcomes [5]. The precise molecular mechanisms underpinning ACC are not fully elucidated despite significant advancements in genomic and transcriptomic profiling. Scientific breakthroughs are needed to identify diagnostic, prognostic, and therapeutic biomarkers, creating new opportunities for effective management strategies [6,7,8,9].
At present the clinical prognostic factors for ACC include tumor stage, cortisol secretion and patient age. Tumor staging serves as the principal determinant of prognosis, as well as the status of surgical resection margins. Histological features such as mitotic activity exceeding 20%, a Ki-67 index greater than 12% and a Weiss score greater than 6 have also been correlated with poor prognosis [10]. Given the disease’s heterogeneity and rarity, investigations have focused on assessing various immunohistochemistry markers to identify reliable prognostic factors. Efforts have also been made to develop genomic techniques for evaluating gene expression and alterations as potential molecular prognostic markers. Significant attention has been directed towards the Wnt/CTNNB1 and TP53 signaling pathways, which are frequently mutated in ACC, particularly with respect to CTNNB1 (beta-catenin) and P53 staining [11,12,13]. The presence of somatic CTNNB1 mutations has been associated with recurrence in ACC patients [14].
Systemic therapies are typically employed in the adjuvant setting or for patients exhibiting metastatic or unresectable disease. Mitotane, an adrenolytic agent, has remained the most utilized medication for over fifty years. It is administered as an adjuvant therapy following surgery or for inoperable or metastatic cases [15,16]. In cases of advanced disease that are not suitable for surgical intervention, the utilization of cytotoxic agents in conjunction with mitotane is indicated. Two commonly employed treatment regimens include the combination of etoposide, doxorubicin and cisplatin with mitotane (EDP-M), and the combination of streptozotocin with mitotane (S-M). These therapeutic approaches were evaluated in an international phase-III clinical trial. The findings indicated that the EDP-M regimen was associated with higher objective response rates (ORRs) and improved progression-free survival (PFS) when compared to the S-M regimen; however, no statistically significant difference in overall survival was observed [17]. Targeted therapies, including inhibitors of the insulin-like growth factor (IGF) pathway and immune checkpoint inhibitors, are currently under investigation in several clinical trials [18]. Preliminary findings indicate that these treatments may provide new options for patients with advanced ACC, though further research is necessary to fully establish their efficacy and safety profiles.
To address the current challenges, research endeavors are directed towards understanding the genetic underpinnings of ACC [19,20,21]. This step is crucial in the development of diagnostic and prognosis algorithms based on genomic data. Based on such approaches, several molecular characteristics have been identified, including prognostic markers such as (BUB1B, PINK1, MKI67) and molecular classification derived from the clustering of genomic profiles, which suggested the presence of two primary transcriptional clusters, designated as C1A/C1B, exhibiting a strong correlation with survival outcomes. However, the C1A/C1B classifier faces challenges in its implementation as a prognostic biomarker owing to its inherent complexity [5,21,22,23,24].
Alternatively, molecular profiling approaches based on bimodal gene expression have been used to identify biomarkers possessing distinct expression distributions, allowing for the classification of samples into two clearly defined expression states [25]. For instance, the estrogen receptor (ESR1) is a well-known bimodally expressed gene in breast cancer patients [26], and Schlafen 11 (SLFN11), a bimodal predictive genomic biomarker, predicts response to DNA-targeted chemotherapy [27]. In this study, we implemented a statistical approach to identify bimodally expressed genes using transcriptome profiles of 112 ACC tumor samples from both the TCGA database and from patients enrolled in NCI clinical trials. We report that a cell surface marker, Semaphorin 7a (SEMA7A), is significantly associated with poor prognosis, differentially up-regulated in ACC in comparison with normal adrenal tissues and reflects activation of the FAK and MAPK/ERK signaling pathways in a subset of ACC patients.
2. Material and Methods
2.1. Dataset Collection
In this study, we utilized transcriptomic and clinical data from the TCGA-ACC and NCI-ACC databases. For the NCI patient samples, a single institution study was conducted in accordance with recognized ethical guidelines as per The Belmont Reports and the Department of Health and Human Services Common Rule and was approved by the NIH Institutional Review Board. Written informed consent was obtained from all participants, and consent was approved by the NIH Institutional Review Board.
RNA-seq sequencing data processed using the NCI CCBR RNA-seq pipeline (https://github.com/skchronicles/RNA-seek.git (accessed on 6th April 2021)) and STAR (2.7.11b) to align reads to the hg38 reference genome. RSEM was used to normalize gene expression values expressed as log2(FPKM + 1) and the “RemoveBatchEffect” function from the “Limma” package was used to remove the impact of the library preparation protocols. In total, 112 ACC patients from TCGA-ACC (n = 79) and NCI-ACC (n = 33) were included in this study (see Table 1 and Table S1). Additionally, normalized RNA-seq expression data from multiple TCGA cancer types (including BLCA, BRCA, CESC, CHOL, ESCA, HNSC, KIRC, KIRP, LAML, LIHC, LUAD, LUSC, PAAD, PRAD, THCA, UCS and UVM) were obtained from cBioPortal and normal tissue expression datasets were obtained from the Genotype-Tissue Expression (GTEx) database.
2.2. Bimodal Approach
To identify RNA-seq expression bimodality we employed a combination of the Hartigan Dip test (using the R Diptest package, R version 4.2.3) and Normal/Gaussian Mixture Models (with the R nor1mix package using an Expectation–Maximization (EM) approach). For each individual gene, the expression distribution was sorted and tested for bimodality using the Dip test. If the distribution was found bimodal using Dip test with p-value < 0.05, we applied the norMixEM function from the R nor1Mix package to fit a mixture of two normal distributions. Once the fitting had converged, the parameters of this model, such as the means (µ1, µ2), weights (w1, w2 with w1 + w2 = 1), and standard deviation (σ1, σ2) for the two distributions, along with the log-likelihood, were computed per gene. We calculated an overall bimodal score, as a rough analog of a t-statistic, as the absolute difference in means divided by the larger of the two standard deviations (See Equation (1)). An additional criterion was that the difference between the weights for the two distributions was less than 0.25 to ensure the selection of genes with similar number of samples in the high and low expression distributions.
2.3. Statistical Analyses
Univariate and multivariate survival analyses were performed using the Cox proportional-hazards (Cox-PHs) regression model. Gene transcripts from ACC samples were stratified into two categories, high and low expression, based on the median expression cut-off. Significant differences in survival distributions between the high-risk (high expression) and low-risk (low expression) groups were assessed using the log-rank test, with the results presented in terms of Hazard Ratios (HRs), p-values, confidence interval and concordance index. An HR > 1 indicates a negative impact on patient survival, while HR < 1 improved survival. An HR of 1 indicates no effect on survival. The stratification of patients into high-risk and low-risk groups was visually represented using Kaplan–Meier (KM) survival curves, providing a distinct depiction of the survival probabilities over time for each group. We used the “survival”, “survminer” and “forestmodel” packages in R (version 4.2.3). Correlation analyses were performed using the Pearson correlation test. Mann–Whitney U test analyses were performed using GraphPad Prism 9.0 software (GraphPad Software Inc. (Boston, MA 02110, USA)).
2.4. TMA-Based SEMA7A IHC and Evaluation
Tissue microarray slide AG991 was used to stain ACC and normal adrenal gland tissue samples. Immunohistochemistry (IHC) staining was performed on LeicaBiosystems’ BondRX autostainer with the following conditions: Epitope Retrieval 2 (EDTA) 20′, SEMA7A (Santa Cruz #sc-374432, 1:100 incubated 30′), and the Bond Polymer Refine Detection Kit (LeicaBiosystems #DS9800 (Buffalo Grove, IL, USA)). Isotype control reagent (mouse IgG2a, BD Biosciences #553454) was used in place of primary antibody for the negative control. Slides were removed from the Bond autostainer, dehydrated through ethanol, cleared with xylene and coverslipped. Slides were scanned using a Leica Aperio AT2 scanner (Leica Biosystems, Buffalo Grove, IL, USA) at 20× magnification. The stained IHC slides were quantified using the HALO image analysis software 3.6 (Indica Labs, Albuquerque, NM, USA). Automated quantification of percent positive cells for each core was performed using cytonuclear algorithm version 2.0.5.
2.5. NCI-ACC Patient Specimens
For the NCI-ACC patient specimens, formalin-fixed paraffin-embedded tissue sections were used for IHC. SEMA7A IHC was performed using a previously validated method [28]. Optimized staining protocol included antigen retrieval performed by microwave heating in Antigen Retrieval Buffer (pH 6.0) (#ab93678, Abcam (Abcam Inc. 152 Grove Street, Waltham, MA, USA)) for 20 min. The sections were incubated with mouse monoclonal anti-SEMA7A antibody (Santa Cruz #sc-374432, 1:100 dilution in TBST (1 × TBS + 0.5% Tween 20)) overnight at 4 °C. The sections were then incubated for 30 min in N-histofine Simple Stain MAX PO(MULTI) (Nichirei Biosciences Inc., # NIC-414151F (Nichirei Higashi-Ginza Building, 6-19-20, Tsukiji, Chuo-ku, Tokyo 104-8402, Japan)) followed by 5 min incubation with chromogen DAB-3S (original dilution by manufacturer, Nichirei Biosciences Inc.; #415192F (Nichirei Higashi-Ginza Building, 6-19-20, Tsukiji, Chuo-ku, Tokyo 104-8402, Japan)) at room temperature.
3. Results
3.1. Overall Workflow and Implementation of the Bimodal Approach
The overall workflow for the selection of bimodal genes is provided in Figure 1A. At first, we applied the bimodal algorithm to the gene expression data collected from both TCGA and NCI. Ranking the genes based on their bimodal scores led to the selection of 200 genes with the highest bimodal distribution. Univariate survival analysis on those top 200 genes retrieved 72 genes significantly associated with the survival of ACC patients. Among them 54 are significantly associated with poor prognosis, and 18 with better overall survival (Figure 1A). The list of the 72 bimodal-survival genes is provided in (Table S2). To evaluate the robustness of these associations, we performed multivariate survival analysis while adjusting for potential confounding clinical variables, including age, tumor stage, and gender. This analysis confirmed that 56 out of the 72 bimodal genes retained a statistically significant association with overall survival in ACC patients (Table S3 and Figure S2). We also assigned the NCI-ACC patients to C1A/C1B molecular subtypes using the ConsensusClusterPlus approach previously used for the TCGA-ACC samples [19,29] (Figure 1B, upper section labeled as molecular subtypes in red for C1A and blue for C1B).
Next, we computed a double clustering heatmap displaying both patient samples (columns in Figure 1B) and expression of the 72 bimodal genes (rows). Patient distribution formed two main clusters (labeled “a” and “b” in Figure 1B). Cluster “a” is enriched for patient with advanced tumors (stage III and IV) and C1A subtype while it is the reverse for patients in cluster “b” (high fraction of localized tumors with C1B staging). Analysis of the gene distribution (rows in Figure 1B) shows an upper cluster encompassing genes that tend to be highly expressed in the cluster “b” patients and can be considered good prognosis genes. Consistently, among them, four are known C1B genes: CHST4 (encoding CarboHydrate sulfotransferase 4), CSDC2 (encoding Cold Shock Domain Containing C2), NME5 (encoding Non-Metastasis cell 5 protein) and PINK1 (encoding PTEN-Induced Kinase 1, whose high expression are well-established good prognosis biomarkers in ACC [21,29]. The bimodal survival genes associated with poor prognosis (cluster “a” in Figure 1B), are distributed in four clusters. Two of them are annotated as “a1” and “a2” in Figure 1B. Cluster “a1” include genes associated with DNA replication, chromatin and the cell cycle: HJURP, CDK1, CDCA5, GINS2, DDIAS. Cluster “a2” includes cell surface markers, metabolism and Wnt-signaling-related genes including PDE9A, BRSK1, SYTL2, RTN4R, EFNA3, PLPP2, CRMP1, LAMC3, LEF1 and SEMA7A.
Further analyses were performed to divide the bimodal genes based on their relationship with MKI67 and identify novel predictive biomarkers that would complement MKI67. Thirty-four genes showed a low correlation with MKI67 (Figure 1C). Among them SEMA7A, which encodes the cell surface marker Semaphorin 7A showed the highest Hazard Ratio (HR = 4.27 and significant p-value < 0.001) (Figure 1C). These results reveal SEMA7A expression as a novel prognosis biomarker with a broad bimodal expression in ACC.
3.2. High Expression of SEMA7A in ACC
In the TCGA-pan cancer datasets, ACC is with pancreatic adenocarcinoma (PAAD) and bladder cancer (BLCA) among the cancers expressing the highest levels of SEMA7A (Figure 2A). This high expression is specific to ACC patients as the expression of SEMA7A is low in normal adrenal gland (Figure 2B and Figure S1). The normal tissues expressing the highest levels of SEMA7A are lymphoid, nervous and germinal (Figure S1). We next examined whether SEMA7A expression is associated with clinical stage, hormone production and gender. High expression of SEMA7A was observed in high-grade (III/IV) and hormone-producing ACC (Figure 2C). Female patients tend to have higher SEMA7A expression than males, but the difference is not significant (Figure 2C). The prognosis value of SEMA7A is shown in Figure 2D with significantly reduced survival of patients with high SEMA7A expression (Hazard Ratio (HR) = 4.27 and p-value < 0.001). As expected, stages III/IV and hormone-producing tumors are also at significantly higher risk (Figure 2E). No significant difference was observed between males and female patients (Figure 2E). Correlation analyses showed a significant association of SEMA7A expression with the expression of adrenocorticotropic hormone receptor, steroidogenic enzymes, cholesterol transporters and their transcriptional regulator genes (CYP11A1, CYP17A1, MC2R, NR5A1/SF1, DLK1 and INHA) [30,31,32,33,34,35] (Figure 2F).
3.3. Activation of the SEMA7A-Integrin-β1 Downstream Signaling Pathways in ACC
SEMA7A is known to belong to a SEMA7A-integrin-β1 axis that activates Mitogen-Activated Protein Kinase (MAPK) cascades, especially the ERK/MAPK signaling pathway, which plays crucial role in regulating oncogenic functions, including metastasis and tumor progression [36,37,38,39]. As shown in Figure 3A, expression of the downstream pathway genes ITGB1, AKT, PTK/FAK, ERK/MAPK1, LIMK1, CFL1 shows significant positive correlation with SEMA7A expression and with each other. These observations are consistent with the functional activation of the downstream pathways of SEMA7A in the ACC tumors expressing high SEMA7A transcripts.
An expression heatmap of SEMA7A-integrin-β1 downstream pathway genes stratifies the ACC patient samples into two subgroups, one having high expression and the other having low expression of those genes (Figure 3B). To explore the association between the downstream genes of the SEMA7A-integrin-β1 pathway and overall survival in ACC patients, we calculated the average expression of genes involved in the SEMA7A pathway and stratified the patients into two groups based on the median expression value (cut-off). The survival analysis shows the poor prognosis of patients having high average expression of SEMA7A pathway genes (Figure 3C).
Together these results demonstrate the functionality of the SEMA7A pathway in a significant fraction of ACC tumors and the significantly poor prognosis of patients with high SEMA7A expression and SEMA7A pathway activation.
3.4. Exploration of SEMA7A Protein Expression in ACC
To compare SEMA7A transcripts and protein expression, we first used tissue microarray slides to determine whether SEMA7A protein expression could be measured in normal adrenal gland (n = 6), adrenocortical adenoma (n = 27) and ACC (n = 14) tumor tissues. Figure 4A shows representative immunohistochemistry (IHC) staining images demonstrating the fraction of cells expressing SEMA7A in ACC tissues compared to normal adrenal gland tissue and adrenocortical adenoma (benign tumor). Quantification (Figure 4B) is consistent with the bimodal distribution of SEMA7A expression observed at the transcript level. Indeed, some samples show a very high percentage of positive cells expressing SEMA7A while other samples display low fractions. This suggests that SEMA7A protein levels determined by IHC can potentially be used as a biomarker to identify specific subgroups of ACC patients and score tumor aggressiveness instead of or in conjunction with RNA-Seq analyses.
To validate the IHC approach in ACC tumor samples, we compared the protein and RNA expression levels of SEMA7A in the NCI-ACC samples. We selected three samples with low and three with high SEMA7A RNA-Seq expression levels. As shown in Figure 5, the samples with low RNA-Seq levels do not show high expression at the protein. By contrast, patients with high RNA-seq expression of SEMA7A (log2(FPKM + 1) (≥5) show protein expression. These results indicate a positive correlation between RNA-Seq expression and protein levels in the selected ACC samples and suggest the value of measuring SEMA7A using both RNA-Seq and IHC to classify ACC patients.
4. Discussion
In this study, we have implemented a combination of the Hartigan Dip test and Gaussian Mixture Modeling (GMM) using the nor1mix package, with the EM algorithm. This hybrid bimodal approach utilizes non-parametric testing for the screening of unimodality, and parametric testing to quantify RNA-seq expression bimodality. In the literature several other methods have been proposed to detect the bimodal gene expression [26,40,41], for instance, the Bimodal Index (BI) approach for selecting and ranking bimodal genes; based on a two-component gaussian mixture model with equal variances, BI captures both the standardized distance between the means of the two distributions and the proportion of samples in each cluster [42]. Tibshirani et al. proposed an outlier-oriented method named Cancer Outlier Profile Analysis (COPA) which detects outlier-sum statistic flag genes in which a subset of samples show unusually high expression, capturing both isolated and recurrent outliers [43]. In addition, clustering based approaches use unsupervised learning to divide data into two or more groups based on k-means, hierarchical clustering (non-parametric methods) making no assumptions about the data, whereas model-based clustering (parametric method) assumes the data comprise a distribution that is a mixture of components. The number of components can be explained by any distribution via density function. Further, the one-component-based model is compared with a mixture of two-component models to obtain the bimodal gene expression in microarray or next-generation sequencing data. Justino et al. introduced an integrated method to identify bimodal genes across multiple TCGA datasets [44]. However, their analysis did not include ACC samples [26,44,45]. Our aim was to explore a novel approach to classify ACC patients and capture heterogeneity across ACC tumors.
ACC presents considerable challenges due to its rarity, the complexity of its biology and its poor prognosis. Furthermore, due to the restricted number of cell lines and preclinical models, ACC patients have limited treatment options. Surgical resection continues to be the foremost approach for the treatment of localized cases, while a metastasectomy has been proposed for the management of recurrent or metastatic ACC. This strategy carries significant therapeutic and palliative implications and is only associated with prolonged survival in carefully selected patients. Due to the prevalence of surgical interventions, high quality samples for biological and genomic analyses are routinely available at the Center for Cancer Research (CCR) of the National Cancer Institute at the National Institutes of Health (see Figure 1 and Figure 5).
To identify novel biomarkers for ACC, we have developed a method to identify bimodally expressed genes in ACC patient tumors to stratify patients based on their overall survival and discover predictive biomarkers. At first, we used RNA-seq expression profiles of ACC patient tumors samples and computed the bimodal score for each gene. We found 72 genes that had a significant association with overall survival. Among them, SEMA7A came up as the gene with the significant association with prognosis independently of MKI67 (see Figure 5A). In our analysis, we have observed that SEMA7A is significantly up-regulated in ACC as compared to normal adrenal gland tissues (see Figure 2). SEMA7A belongs to the Semaphorin gene family. It encodes SEMA7A (CDw108), a signaling glycoprotein (as its name indicates) anchored to the cell surface via glycosylphosphatidylinositol (GPI) linkage [46]. Upon cleavage of the GPI membrane anchor, SEMA7A exists as both shed and membrane bound. SEMA7A influences cellular dynamics in both cell-autonomous and non-autonomous manners. It enhances the mobility of melanocytes, neuronal cells and immune cells through the activation of β-1 integrin signaling pathways [37,38,47]. In its normal physiological role, SEMA7A binds β1-integrin to activate downstream signaling cascades, including the pro-invasive MAPK/ERK and pro-survival PI3K/AKT pathways [48].
Recent findings have identified SEMA7A as a tumor promoter, accelerating tumor growth, increasing invasiveness, and promoting adhesion to tumor-associated extracellular matrices. SEMA7A induces epithelial to mesenchymal transition, and promoting metastasis in melanoma, glioblastoma, oral, kidney and breast cancers [36,49,50,51,52,53]. Moreover, high expression of SEMA7A has been associated with significantly decreased patient survival in ER + breast cancer patients [54]. Prior to this work, no associations between SEMA7A and ACC have been observed. Relevant to our study, in neuronal cells of the hypothalamus, SEMA7A expression is regulated by steroid hormones [55], an association we found also in ACC (see Figure 2). SEMA7A is also upregulated in high-grade (Stage III/IV) and hormone-producing ACC patients (see Figure 2). Our correlation analyses show that the SEMA7A-integrin-β1 axis activates the ERK/MAPK signaling pathway in a subset of ACC patients with poor prognosis (see Figure 3).
Immunohistochemistry (IHC) staining of ACC tissues shows a bimodal distribution of SEMA7A in ACC patients with lower levels in normal adrenal tissues and benign adrenal tumors (see Figure 4 and Figure 5) and high protein levels in ACC. The positive correlation between RNA-seq and immunohistochemistry (IHC) in NCI-ACC patient samples suggests that SEMA7A could be a promising prognostic biomarker for clinical applications.
5. Conclusions
Our study reports a bimodal gene detection approach to identify clinically relevant biomarkers in adrenocortical carcinoma patients. Univariate and multivariate analyses show that the bimodally expressed gene SEMA7A acts as a poor prognostic biomarker in ACC. Correlation analyses also reveal that SEMA7A-integrin-β1 activates the MAPK signaling pathway in ACC patients. Over-expression of SEMA7A at both the transcriptomic and protein levels highlight it as a potential biomarker for further investigations and for application in clinical diagnostics, particularly for forecasting outcomes in ACC patients. Finally, SEMA7A emerges as a potential therapeutic target for the development of immunotherapies, including antibody drug conjugates (ADCs) and T-cell engagers, for the treatment of ACC.
The reference list from the paper itself. Each links out to its DOI / PubMed record.
- 1Else T. Kim A.C. Sabolch A. Raymond V.M. Kandathil A. Caoili E.M. Jolly S. Miller B.S. Giordano T.J. Hammer G.D. Adrenocortical carcinoma Endocr. Rev.20143528232610.1210/er.2013-102924423978 PMC 3963263 · doi ↗ · pubmed ↗
- 2Libe R. Huillard O. Adrenocortical carcinoma: Diagnosis, prognostic classification and treatment of localized and advanced disease Cancer Treat. Res. Commun.20233710075910.1016/j.ctarc.2023.10075937690343 · doi ↗ · pubmed ↗
- 3Sidhu S. Sywak M. Robinson B. Delbridge L. Adrenocortical cancer: Recent clinical and molecular advances Curr. Opin. Oncol.200416131810.1097/00001622-200401000-0000414685087 · doi ↗ · pubmed ↗
- 4Fassnacht M. Allolio B. Clinical management of adrenocortical carcinoma Best. Pract. Res. Clin. Endocrinol. Metab.20092327328910.1016/j.beem.2008.10.00819500769 · doi ↗ · pubmed ↗
- 5Lam A.K. Adrenocortical Carcinoma: Updates of Clinical and Pathological Features after Renewed World Health Organisation Classification and Pathology Staging Biomedicines 2021917510.3390/biomedicines 902017533578929 PMC 7916702 · doi ↗ · pubmed ↗
- 6Cheng Y. Kou W. Zhu D. Yu X. Zhu Y. Future Directions in Diagnosis, Prognosis and Disease Monitoring of Adrenocortical Carcinoma: Novel Non-Invasive Biomarkers Front. Endocrinol.20211281129310.3389/fendo.2021.811293 PMC 884418535178030 · doi ↗ · pubmed ↗
- 7Mizdrak M. Ticinovic Kurir T. Bozic J. The Role of Biomarkers in Adrenocortical Carcinoma: A Review of Current Evidence and Future Perspectives Biomedicines 2021917410.3390/biomedicines 902017433578890 PMC 7916711 · doi ↗ · pubmed ↗
- 8Marquardt A. Landwehr L.S. Ronchi C.L. di Dalmazi G. Riester A. Kollmannsberger P. Altieri B. Fassnacht M. Sbiera S. Identifying New Potential Biomarkers in Adrenocortical Tumors Based on m RNA Expression Data Using Machine Learning Cancers 202113467110.3390/cancers 1318467134572898 PMC 8469239 · doi ↗ · pubmed ↗