Signals of complexity and fragmentation in accelerometer data
Els Weinans, Jerrald L. Rector, Sarah Charman, Renae J. Stefanetti, Cecilia Jimenez-Moreno, Gráinne S. Gorman, Ingrid van de Leemput, Daniël van As, René Melis, Baziel van Engelen, Yunhe Wang, Sandip George, Sandip George, Sandip George

TL;DR
This paper shows that analyzing accelerometer data through complexity measures can reveal health differences not captured by traditional methods.
Contribution
The study introduces complexity-based measures to detect health differences in accelerometer data beyond traditional metrics.
Findings
Healthy individuals show higher regularity in activity patterns compared to DM1 patients.
The correlation dimension differentiates health status independent of average activity metrics.
Activity patterns of DM1 patients are more fragmented and less regular.
Abstract
There is a growing interest to analyze physiological data from a complex systems perspective. Accelerometer data is one type of data that is easy to obtain but often difficult to analyze for insights beyond basic levels of description. Previous work hypothesizes that an individual’s activity pattern can be seen as a complex dynamical system. Here, we explore this hypothesis further by investigating whether complexity-based measures quantifying repetitiveness and fragmentation of activity captured via accelerometer can detect health differences beyond traditional measures. Our results demonstrate that healthy individuals have a higher regularity (indicated by a lower correlation dimension), a higher probability of activity after a period of rest, and a lower probability of a period of rest after a period of activity compared with patients living with Myotonic Dystrophy type I (DM1), a…
Genes, proteins, chemicals, diseases, species, mutations and cell lines named across the full text — each resolved to its canonical identifier and authoritative record.
Click any figure to enlarge with its caption.
 Figure 1
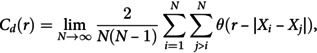 Figure 2
 Figure 3
 Figure 4
 Figure 5
 Figure 6
 Figure 7
 Figure 8
 Figure 9
 Figure 10
 Figure 11
 Figure 12
 Figure 13
 Figure 14
 Figure 15
 Figure 16
 Figure 17
 Figure 18
 Figure 19
 Figure 20
 Figure 21
 Figure 22
 Figure 23
 Figure 24
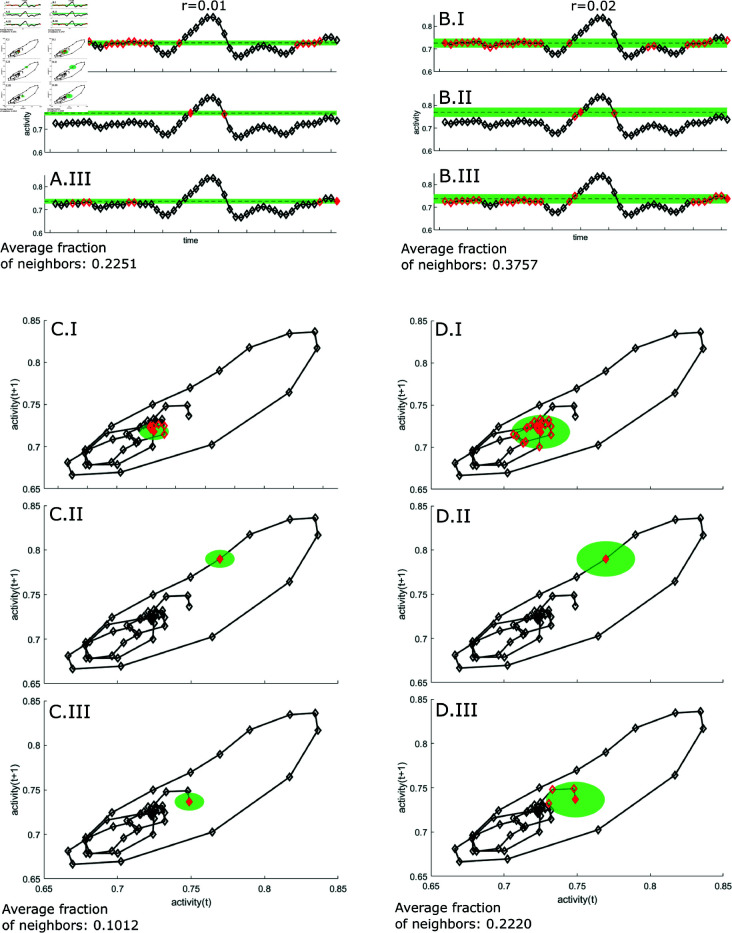 Figure 25
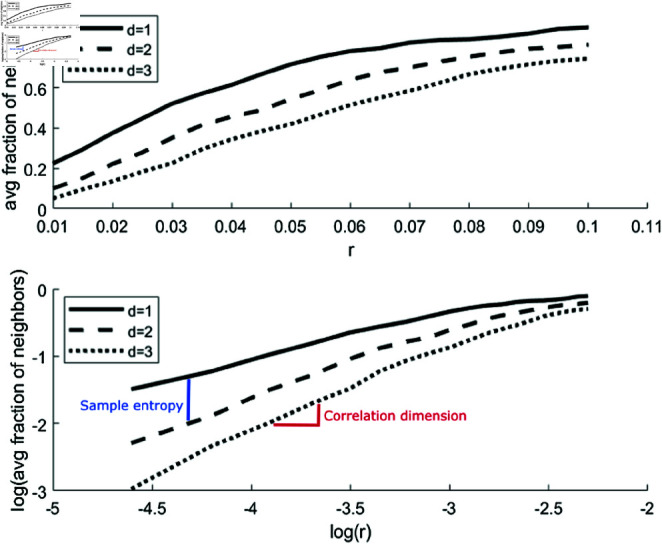 Figure 26
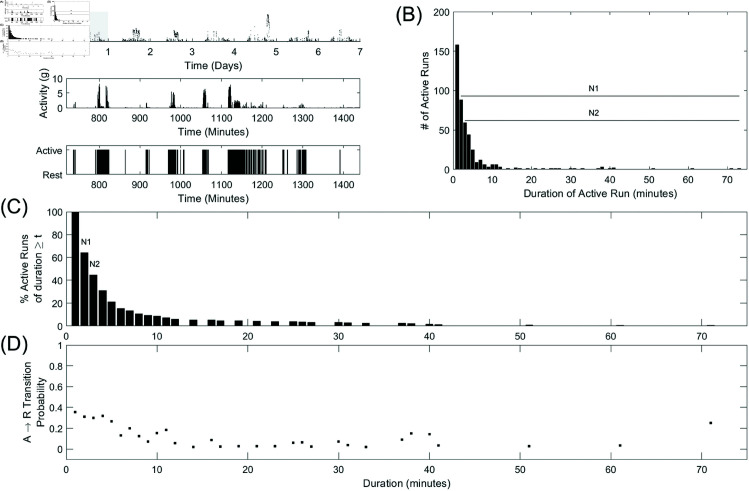 Figure 27
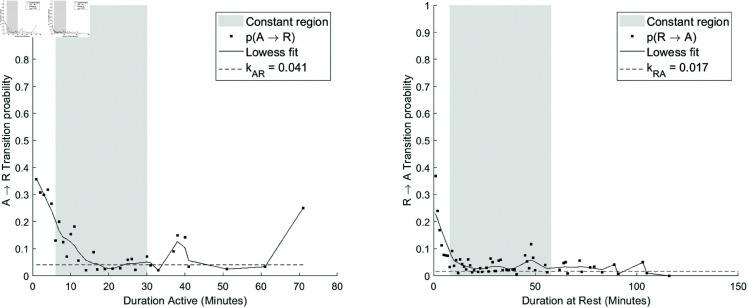 Figure 28
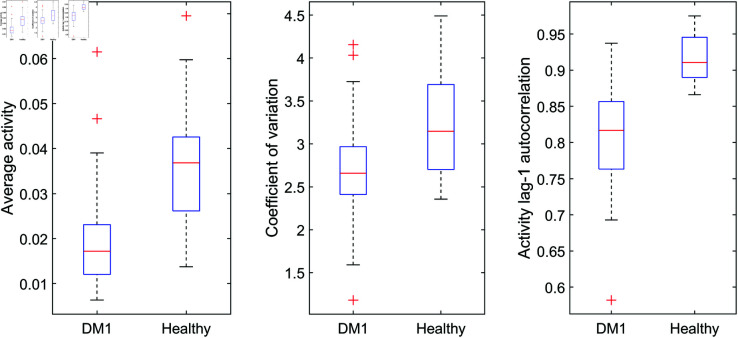 Figure 29
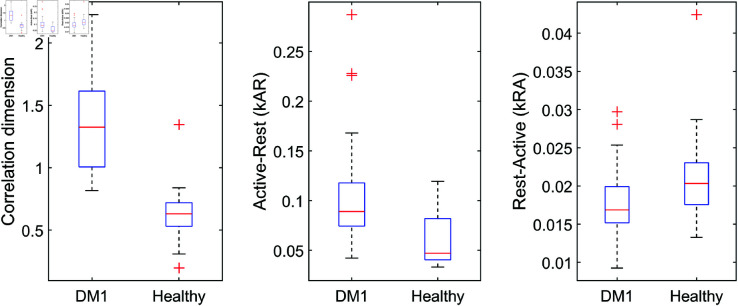 Figure 30
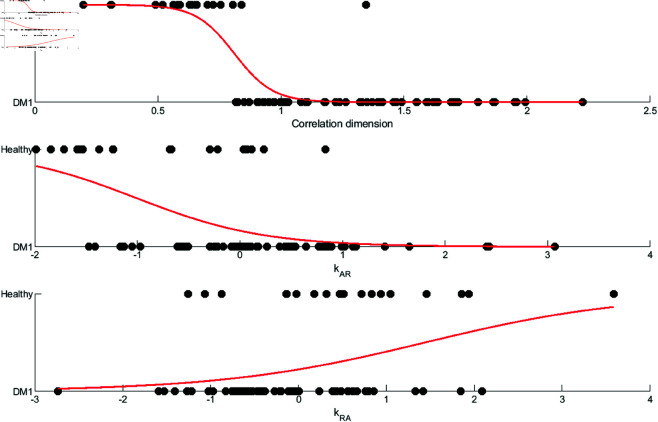 Figure 31
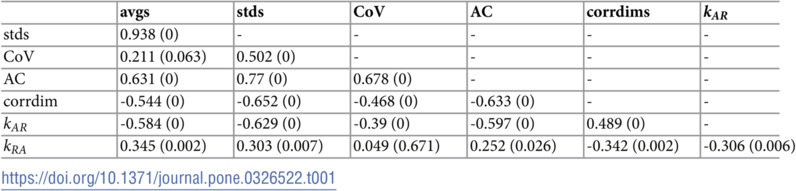 Figure 32
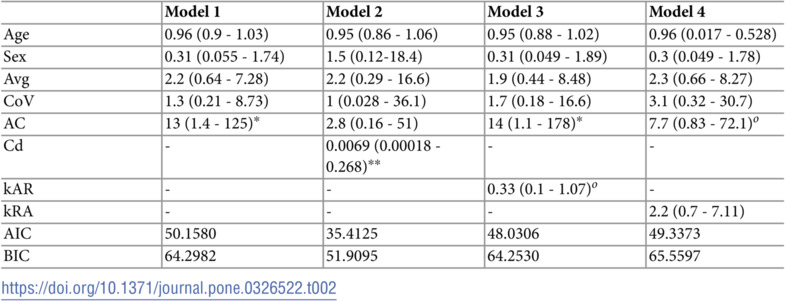 Figure 33
Peer Reviews
No public reviews on file for this paper yet. If you reviewed it on a platform where reviews are public (OpenReview, ICLR, NeurIPS, ICML), you can paste yours below so the community can read it here.
Videos
No videos yet. Explain this paper in a talk, walkthrough, or lecture? Add one.
Taxonomy
TopicsTime Series Analysis and Forecasting · Complex Systems and Time Series Analysis · Chaos control and synchronization