Clinical features and outcomes of myelodysplastic syndrome patients with iron overload: a single-center retrospective study
Lei Huang, Yinxing Wang, Xinrui Zhang, Xintong Xu, Ziqi Zhang, XinRu Wu, Chunyan Liu, Rong Fu

TL;DR
This study examines how iron overload affects the health and survival of patients with myelodysplastic syndrome, finding that it worsens their condition and prognosis.
Contribution
The study provides clinical evidence linking iron overload to immune dysfunction and poorer outcomes in MDS patients.
Findings
Iron overload in MDS patients is associated with higher ferritin, elevated IL-6, and immune abnormalities.
IOL MDS patients have shorter survival and more chromosomal abnormalities like 7q-.
Age, ferritin levels, and gene mutations in TP53 and RUNX1 are adverse prognostic factors.
Abstract
Most of the myelodysplastic syndromes (MDS) patients suffer from iron overload (IOL) due to ineffective hematopoiesis and repeated blood transfusions. IOL may affect the survival of MDS patients, but the related mechanism has not been fully clarified. We aimed to provide clinical evidence for the impact of IOL on the immunity and prognosis of MDS patients. The clinical features and outcomes of 144 patients with MDS between March 2019 and December 2023 were analyzed. Patients were classified into the IOL group (ferritin > 1000 ng/mL) and the non-iron overload (NIOL) group (ferritin ≤ 1000 ng/mL). The median age of the patients was 64 (22–89) years, and IOL MDS patients had a poorer performance status. IOL MDS patients had significantly higher alanine aminotransferase and blood glucose levels. White blood cell counts and hemoglobin levels were significantly lower in IOL MDS patients.…
Genes, proteins, chemicals, diseases, species, mutations and cell lines named across the full text — each resolved to its canonical identifier and authoritative record.
Click any figure to enlarge with its caption.
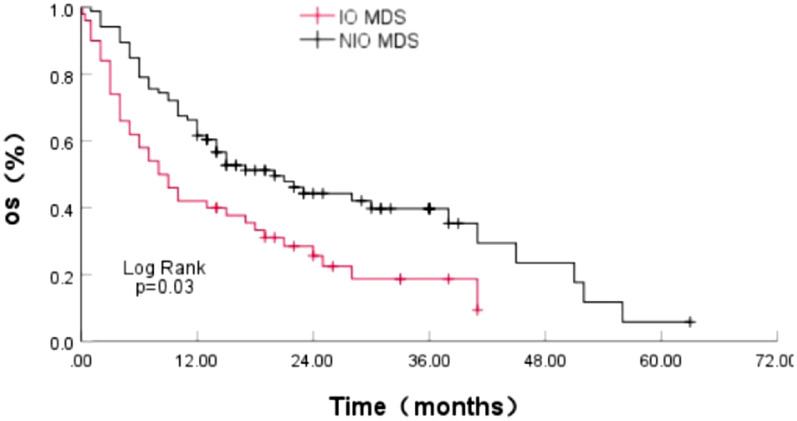 Figure 1
- —National Natural Science Foundation of China
- —Key Projects of Tianjin Diversified Investment Fund
- —Tianjin Municipal Natural Science Foundation
- —Tianjin Science and Technology Planning Project
- —Tianjin Municipal Health Commission Project
- —Tianjin Municipal Education Commission Research Project
- —Tianjin Medical University Climbing Program Talent Project
Peer Reviews
No public reviews on file for this paper yet. If you reviewed it on a platform where reviews are public (OpenReview, ICLR, NeurIPS, ICML), you can paste yours below so the community can read it here.
Videos
No videos yet. Explain this paper in a talk, walkthrough, or lecture? Add one.
Taxonomy
TopicsAcute Myeloid Leukemia Research · Myeloproliferative Neoplasms: Diagnosis and Treatment · Hemoglobinopathies and Related Disorders
Introduction
Approximately 80–90% of myelodysplastic syndrome (MDS) patients have anemia at the beginning of the disease, they often suffer from iron overload (IOL) due to ineffective erythropoiesis and repeated blood transfusions [1]. The most common causes of non-leukemia-related death in IOL MDS patients are cardiac complications, liver damage and endocrine dysfunction [2–4]. IOL can induce manifestations of MDS and ineffective erythropoiesis in mice with Nrf2 deficiencies [5]. However, iron chelation therapy (ICT) improved ineffective erythropoiesis in these mice [6]. MDS patients are typically older, and limited treatments are available to prolong their life. Approximately half of the MDS patients eventually develop IOL. A recent meta-analysis suggested that ICT treatment was associated with a survival advantage in MDS patients, reducing the risk of transformation to acute myeloid leukemia (AML), and improving mortality rates in lower risk IOL MDS patients [7]. The damage of organ and bone marrow hematopoiesis caused by IOL increases the mortality rate of patients with IOL MDS, and ICT is associated with the survival benefit of IOL MDS patients. However, the possible mechanisms affecting the survival of patients with IOL MDS has not been fully clarified.
Immune abnormalities, gene mutations and chromosomal abnormalities are involved in the pathogenesis of MDS. The impaired function of T lymphocytes leads to immune failure, loss of immune surveillance and clonal proliferation of tumor cells [8]. Dendritic cells (DC_S_) are antigen-presenting cells on T cells and thus activate them. Studies have shown that the antigens of apoptotic hematopoietic stem cells in lower risk MDS patients are presented by DCs, triggering the damage of T cells to normal hematopoietic stem cells and facilitating the malignant clonal expansion and the progression of MDS. The pro-inflammatory microenvironment in MDS promotes the failure of normal hematopoiesis and the proliferation of malignant clones, which is secondary to the excessive production of inflammatory cytokines, affecting bone marrow hematopoiesis and leading to the occurrence of MDS phenotypes [9]. Gene mutations involving RNA splicing, DNA methylation and DNA repair play important roles in the progression of MDS [10]. However, the effects of IOL on the immune function, gene mutations and chromosomes of MDS patients need to be further studied. Therefore, this study aimed to evaluate the clinical characteristics, bone marrow hematopoiesis, immune function, gene mutations, survival, and prognostic factors of newly diagnosed patients with IOL MDS, to provide clinical evidence for the impact of IOL on the immunity and prognosis of MDS patients.
Patients and methods
Patients
This study conducted a retrospective analysis of 144 MDS patients diagnosed in the Hematology Department of Tianjin Medical University General Hospital from March 2019 to December 2023. The median age of the patients was 64 (22–89) years, including 98 males and 46 females. The diagnosis of MDS patients was based on 2016 WHO diagnostic criteria and the IPSS-R (Revised international prognostic scoring system) scores [11]. Patients were categorized into the IOL group (ferritin > 1000 ng/mL) and the NIOL group (ferritin ≤ 1000 ng/mL). Blood transfusion dependence with a heavy transfusion burden (HTB) is defined as 8 RBC units in a 16-week period according the latest IWG 2018 criteria [12].
Immunological function detection by flow cytometry
For T cell subpopulation detection: a six-color TBNK reagent kit was used to analyze peripheral blood T cell subpopulations: CD3-FITC, CD4-PE-Cy7, CD8-APC-Cy7, CD16 + 56 PE, CD19-APC, and CD45-PerCP-Cy5.5 mixed together with 5 µL of antibodies. After mixing with 50 µl of peripheral blood, the solution was incubated in the dark for 15 min. Then, 400 µL of hemolysin was added for another 10 min incubation in the dark. The samples were then mixed and analyzed by flow cytometry carried by BD FACS Canto II.
For DC cell subpopulation detection: 5 µL CD16-FITC, CD1c-PerCP-Cy5.5, lineage-PE, CD11c-PE-Cy7, Clec9A-APC, CD123-APC-Cy7, HLA-DR-BV421 and CD45-AmCyan antibodies were added to 200 µL of peripheral blood and incubated in the dark for 15 min. Then, 2 mL hemolysin was added and incubated for another 15 min. The mixture was centrifuged at 1500 r/min and the supernatant was discarded. In addition, 1 mL PBS (Phosphate Buffer Saline) was added and mixed, followed by another centrifugation step to remove the supernatant. Finally, 200 µL of PBS was added, then analyzed by flow cytometry carried by BD FACS Canto II.
Cytokine detection: Cytokine combined detection Kit (item No. P110100203) was used to detect the cytokine levels in MDS patients, which is based on the immunofluorescence technology. Through seven capture microspheres with different fluorescence intensifications in the capture microsphere mixture, the surfaces of the capture microspheres are, respectively, coated with specific antibodies of Interleukin (IL)−2, IL-4, IL-6, IL-10, TNF-α, IFN-γ, and IL-17A. The capture microspheres specifically bind to these seven cytokines in the sample to be tested, respectively, and then combine with the fluorescent detection reagent labeled with PE to form a double antibody sandwich complex formed by the capture microspheres, the sample to be tested and the detection antibody. By analyzing the fluorescence intensity of the double antibody sandwich complex, the content of cytokines in the sample to be tested can be obtained. We did the experiment referring to the instructions of the reagent kit. 25 µL peripheral blood was mixed with 25 µL fluorescent reagent C and 25 µL microspheres and incubated at room temperature in the dark for 2.5 h. After mixing with 1 mL PBS and centrifuging to remove the supernatant, the sample was resuspended in 1 mL PBS, mixed and analyzed by flow cytometry carried by BD FACS Canto II.
Reading bone marrow smears
The bone marrow smears were stained with Wright-Giemsa. The number of megakaryocytes in the entire bone marrow smear were counted with a light microscope at × 100 magnification, and 200 nucleated cells were counted with a light microscope at × 1000 magnification. The numbers of granulocytes, immature red blood cells, lymphocytes, monocytes, plasma cells and other cells were counted, respectively. The proportion of the cells in the bone marrow smear was calculated, and the cell morphology was described. Two bone marrow smear reading experts counted the same bone marrow smear and calculated the average value.
Gene mutation analysis
Heparin anticoagulant aseptic bone marrow 5 ml was extracted from MDS patients and centrifuged at 1500 r/min for 10 min. The bone marrow mononuclear cells (BMMNCs) from MDS patients were isolated by centrifugation in a Ficoll gradient. Intracellular DNA was extracted from the cells for sequencing. Next-generation sequencing was employed to screen for gene mutations in BMMNCs from MDS patients, using an Ion Torrent PGM sequencer/Illumina sequencer. Based on the NCBI database, different intron splicing on a gene segment can generate different transcript IDs. The gene mutations list is provided in the Supplementary Material (Table S1).
Treatment
For the lower risk MDS (IPSS-R ≤ 3.5) patients, 25 cases with severe anemia received blood transfusions (10 cases) or combined with erythropoietin (EPO) (14 cases)/Luspatercept (1 case), 3 cases with 5q- received lenalidomide, 10 cases with symptomatic thrombocytopenia or granulocytopenia or blast cell proliferation received hypomethylating agents (4 cases azacitidine (AZA), 6 cases decitabine).
For the higher risk MDS (IPSS-R > 3.5), 24 cases with severe anemia received blood transfusions (9 cases) or combined with EPO (13 cases)/Luspatercept (2 cases), 46 cases received hypomethylating agents (22 cases AZA, 24 cases decitabine), 34 cases received AZA combined with monoclonal antibody/chemotherapy (23 cases Venetoclax, 5 cases CD47 monoclonal antibody, 4 cases programmed death-1 (PD-1) monoclonal antibody, 1 case TIM3 monoclonal antibody, 1 case CAG [clarithromycin, cytarabine, G-CSF)], and 2 cases received allogeneic hematopoietic stem cell transplantation.
Follow-up
Patients were followed up through hospitalization records, outpatient records, and phone calls until June 2024. The median survival time was calculated from the time of diagnosis to time of death or last follow-up visit. Eight patients were lost during the follow-up (5.56%) and the median follow-up duration was 13.5 (0.1–63) months.
Statistical analysis
Results were expressed as mean ± standard deviation or median (minimum, maximum). For normally distributed data, independent sample t tests were used. Non-normally distributed data were compared using non-parametric Wilcoxon tests. For categorical data, comparisons were made using Pearson's chi-squared test, continuity correction, or Fisher's exact test. Univariate and multivariate survival analyses were performed using Cox regression models. SPSS version 27 was performed for statistical analysis, and p values < 0.05 were considered statistically different.
Results
Clinical features of MDS patients
144 patients with primary MDS were included, of which 54 were in IOL group. The median age of the IOL group was 61.0 (23–85) years, with 40 males and 14 females, and the median ferritin level was 1870.09 (1055.12–5730.97) ng/ml. The NIOL group comprised 90 patients, with a median age of 64.5 (22–89) years, consisting of 58 males and 32 females. The median ferritin level was 448.81 (36.55–997.96) ng/ml. The proportion of blood transfusion dependence with HTB before diagnosis in the IOL group (57.41%) was significantly higher than that in the NIOL group (8.89%) (p < 0.05). IOL MDS patients had higher ECOG scores compared with NIOL group (p < 0.05), indicating a poorer performance status in IOL MDS patients. No significant differences were found between the groups in terms of gender, age, WHO 2016 classification, or IPSS-R score (p > 0.05) (Table 1).Table 1. Characteristics of patients with MDSIOL MDS (n = 54)NIOL MDS (n = 90)T/Z/χ^2^p valueAge61.0(23–85)64.5(22–89)Z = − 1.7510.08Age ≥ 60 years27(50.00%)61(67.78%)χ^2^ = 4.4880.052Gender (male/female)40/1458/32χ^2^ = 1.4400.23Ferritin (ng/mL)1870.09 (1055.12–5730.97)448.81 (36.55–997.96)Z = − 10.048 < 0.001HTB31(57.41%)8(8.89%)χ^2^ = 40.231 < 0.001WHO 2016 MDS–SLD2(3.70%)2(2.22%)χ^2^ = 0.0140.908 MDS–MLD6(11.11%)7(7.78%) MDS–RS10(18.52%)16(17.78%) MDS–5q-1(1.85%)3(3.33%) MDS–EB-110(18.52%)23(25.56%) MDS–EB-223(42.59%)37(41.11%) MDS-u2(3.70%)2(2.22%)IPSS-R ≤ 1.50(0.00%)2(2.22%)χ^2^ = 1.5790.209 > 1.5– ≤ 37(12.96%)15(16.67%) > 3– ≤ 4.511(20.37%)16(17.78%) > 4.5– ≤ 610(18.52%)25(27.77%) > 626(48.15%)32(35.56%)ECOG 0–110(18.52%)41(45.56%)χ^2^ = 10.7860.001 ≥ 244(81.48%)49(54.44%)
Correlation between IOL and blood cell levels and organ function in patients with MDS
By comparing blood cell levels of MDS patients, we found that the IOL MDS patients had lower white blood cell count, hemoglobin and platelet count, especially in white blood cell count and hemoglobin in IOL MDS compared with NIOL MDS (p < 0.05). In addition, we found that the proportion of EPO > 500 mU/mL in the IOL group was increased (p > 0.05). We analyzed the correlation between IOL and organ function in MDS patients. We found both alanine aminotransferase and glucose levels in IOL MDS group were significantly higher than those in the NIOL MDS group (p < 0.05). However, no clear differences were observed in lipid levels, renal function, and thyroid function between the groups (p > 0.05), indicating that IOL may damage liver and pancreatic function in patients with MDS (Table 2).Table 2. Correlation between IOL and blood cell levels and organ function in patients with MDSIOL MDSNIOL MDST/Z/χ^2^p valueWBC(×10^9^/L)2.19(0.20–25.99)2.66(0.38–21.51)Z = − 2.2370.025ANC(×10^9^/L)0.99(0.05–78.80)1.32(0.01–26.90)Z = − 1.6570.097Hb(g/L)61.00 (39.00–95.00)69.50 (31.0–129.0)Z = − 2.4400.016EPO > 500(mU/mL)20(68.97%)23(45.10%)χ^2^ = 4.2360.061PLT(×10^9^/L)42.00 (1.00–499.00)60.00 (3.00–534.00)Z = − 1.5770.115ALT(U/L)24.00 (8.00–590.00)15.00 (4.00–99.00)Z = − 3.1100.002Cr(umol/L)62.50 (28.00–147.00)62.00 (27.00–566.00)Z = − 0.3050.760GLU(mmol/L)5.80(3.40–13.80)5.20(2.80–17.40)Z = − 2.0740.038TC(mmol/L)3.50 ± 0.883.34 ± 0.88t = 0.6120.544TG(mmol/L)1.23 ± 0.471.26 ± 0.38t = − 0.2510.803HDL-C(mmol/L)0.75 ± 0.280.86 ± 0.36t = − 1.0780.287LDL-C(mmol/L)2.13(1.08–4.52)1.94(0.84–7.90)Z = − 0.5870.557FT3(pmol/L)3.25 ± 0.853.36 ± 0.82t = − 0.5440.588FT4(pmol/L)11.80 ± 1.8512.07 ± 1.79t = − 0.6100.544TSH(uIU/mL)1.36(0.09–6.42)1.34(0.32–15.18)Z = − 0.3430.731β_2_-MG(mg/L)2.27(1.07–9.78)2.18(0.81–6.79)Z = − 0.7620.446LDH(U/L)244.50 (111.10–1699.00)211.00 (103.00–1473.00)Z = − 1.4240.154CRP(mg/dL)4.15 (0.26–150.25)2.49 (0.10–64.25)Z = − 1.480.139
The effect of IOL on hematopoiesis in patients with MDS
The study above indicated that blood cell levels in IOL MDS patients were lower. Therefore, we analyzed the effects of IOL on bone marrow hematopoiesis. We found the proportion of blast cells in the bone marrow of IOL MDS patients was slightly higher than that in NIOL MDS group, whereas the proportion of erythroid cells was significantly lower. Concurrently, the number of megakaryocytes in the IOL MDS group was notably lower than that in NIOL MDS group (p < 0.05). However, no significant difference was found in the proportion of hematopoietic dysplasia (p > 0.05) (Table 3).Table 3. Effect of IOL on bone marrow hematopoiesis in patients with MDSIOL MDS (n = 54)NIOL MDS (n = 90)T/Z/χ^2^p valueBlast cells (%)6.00 (0.00–19.50)5.50 (0.00–19.50)Z = − 0.2570.797The proportion of bone marrow myeloid cells (%)40.31 ± 19.0140.96 ± 18.10t = − 0.2010.841The proportion of bone marrow erythroid cells (%)21.00 (0.00–68.00)28.00 (2.00–91.50)Z = − 2.2090.027The counts of Megakaryocyte7.00 (0.00–200.00)41.00 (0.00–1100.00)Z = − 3.399 < 0.001Myeloid dysplasia11(20.37%)23(25.84%)χ^2^ = 0.5550.545Erythroid dysplasia11(20.37%) 22(24.72%)χ^2^ = 0.3580.683Megakaryocyte dysplasia2(3.70%)6(6.74%)Fisher0.710
The correlation between IOL and immune function in patients with MDS
Immune abnormalities play a vital role in the hematopoiesis in MDS. We analyzed the effects of IOL on T cells, DCs and cytokines in MDS patients. We found that IL-6 levels were significantly higher in IOL MDS patients compared to NIOL MDS patients (p < 0.05). The plasmacytoid DC (pDC)/DC and conventional type 2 DC (cDC2)/conventional DC (cDC) ratios in the IOL MDS group were significantly lower than those in NIOL MDS group, whereas the CD16^+^DC/cDC ratio in IOL MDS patients was significantly higher (p < 0.05). However, no statistically significant differences were found between them in the T-cell subsets (Table 4).Table 4. Correlation between IOL and immune function in patients with MDSIOL MDSNIOL MDST/Z/χ^2^p valueCD3^+^ T cells (%)76.41 (39.84–96.39)75.73 (15.83–94.41)Z = − 0.2270.820CD3^+^ CD8^+^ T cells(%)26.54 (11.24–47.24)25.71 (4.71–68.64)Z = − 0.4050.687CD3^+^ CD4^+^ T cells (%)43.30 ± 13.0042.32 ± 10.78t = 0.4820. 631CD16^+^ CD56^+^ NK cells(%)12.88 (0.41–53.67)14.10 (2.66–81.08)Z = − 0.3570. 720CD19^+^ B cells(%)7.54 (0.76–43.72)8.23 (1.41–52.62)Z = − 0.1290.898CD4^+^/CD8^+^ T cells1.64 (0.15–4.92)1.67 (0.33–7.71)Z = − 0.6330.527IL-2(pg/mL)1.74 (0.00–5.96)1.54 (0.00–24.34)Z = − 0.1940.846IL-4(pg/mL)2.75 (0.01–142.35)1.58 (0.00–125.43)Z = − 1.1640.244IL-6(pg/mL)8.66 (1.26–131.4)5.06 (0.64–101.9)Z = − 3.400 < 0.001IL-10(pg/mL)3.48 (0.32–36.55)3.11 (0.06–113.00)Z = − 0.5620.574TNF-α(pg/mL)2.04 (0.00–8.71)1.97 (0.00–29.72)Z = − 0.3630. 716IFN-γ(pg/mL)1.74 (0.05–10.97)1.74 (0.01–37.87)Z = − 0.8140. 415IL-17A(pg/mL)1.34 (0.00–30.83)2.47 (0.01–34.62)Z = − 0.3560.722DC (%)0.50 (0.10–3.20)0.50 (0.03–11.50)Z = − 0.1470.886pDC/DC (%)1.90 (0.00–63.00)4.60 (0.00–73.60)Z = − 2.0000.045cDC/DC (%)42.83 ± 27.1447.98 ± 28.84t = − 0.8570.394CD16^+^ DC/cDC (%)50.80 (0.00–97.30)28.50 (0.00–97.90)Z = − 2.2530.024cDC2/cDC (%)26.15 (0.00–95.50)40.70 (0.00–97.40)Z = − 2.0720.038cDC1/cDC (%)1.10 (0.00–75.00)0.70 (0.00–33.30)Z = − 0.4900.624
The correlation between IOL and chromosomes in patients with MDS
Patients with MDS may exhibit various chromosomal abnormalities, among which -Y, 5q-, 20q-, 7q-, + 8, and − 7 are the most common. We found the number of patients with a normal chromosomal karyotype was significantly lower among MDS patients with IOL. Furthermore, the incidence of 7q- was higher in IOL MDS patients (p < 0.05) (Table 5).Table 5. Correlation between IOL and chromosomes in patients with MDSIOL MDS (n = 54)NIOL MDS (n = 90)T/Z/χ^2^p value-Y2 (3.70%)0 (0.00%)Fisher0.139del(5q)7 (12.96%)5 (5.56%)χ^2^ = 1.5520.213del20(q)4 (7.41%)3 (3.33%)Fisher0.425del7(q)7 (12.96%)3 (3.33%)Fisher0.041 + 810 (18.51%)13 (14.44%)χ^2^ = 0.4170.158 + 190 (0.00%)1 (1.11%)Fisher1.000i(17q)1 (1.85%)0 (0.00%)Fisher0.375− 72 (3.70%)5 (5.56%)Fisher0.711inv3/t(3q)/del3(q)1 (1.85%)1 (1.11%)Fisher1.000− 221 (1.85%)2 (2.22%)Fisher1.000 + 112 (3.70%)0 (0.00%)Fisher0.139− 131 (1.85%)2 (2.22%)Fisher1.000 + 91 (1.85%)2 (2.22%)Fisher1.000Normal22 (40.74%)57 (63.33%)χ^2^ = 6.9560.008 ≥ 3 abnormalities13 (24.07%)18 (20.00%)χ^2^ = 0.3320.565
The correlation between IOL and gene mutations in patients with MDS
Patients with MDS experience various genetic mutations. The median number of gene mutations in the IOL group was 3 (0–7), while the median number of mutations in the NIOL group was 2 (0–7). The most common gene mutations among IOL MDS patients were ASXL1, RUNX1, and TP53, while ASXL1, TET2, and DNMT3A gene mutations in NIOL MDS patients. The mutation rate of the ZRSR2 gene in the IOL MDS group was markedly lower than that in NIOL MDS group (p < 0.05) (Table 6).Table 6. Effect of IOL on the level of genetic mutations in patients with MDSIOL MDS (n = 47)NIOL MDS (n = 84)T/Z/χ^2^p valueNormal2 (4.26%)5 (5.95%)Fisher1.000 ≥ 2 mutated Gene38 (80.85%)65 (77.38%)χ^2^ = 0.2160.642ASXL117 (36.17%)24 (28.57%)χ^2^ = 0.8090.368DNMT3A6 (12.77%)17 (20.24%)χ^2^ = 1.1620.281TET27 (14.89%)19 (22.62%)χ^2^ = 1.1310.288EZH22 (4.26%)7 (8.33%)χ^2^ = 0.2760.600SF3B19 (19.15%)11 (13.10%)χ^2^ = 0.8540.355SRSF22 (4.26%)9 (10.71%)χ^2^ = 0.9030.342U2AF19 (19.15%)13 (15.48%)χ^2^ = 0.2910.590ZRSR20 (0.00%)9 (10.71%)χ^2^ = 5.4070.026RUNX110 (21.28%)9 (10.71%)χ^2^ = 2.7110.100TP5310 (21.28%)14 (16.67%)χ^2^ = 0.4280.513STAG25 (10.64%)5 (5.95%)χ^2^ = 0.3920.531NRAS6 (12.77%)4 (4.76%)χ^2^ = 3.5010.190CBL2 (4.26%)5 (5.95%)Fisher1.000NF11 (2.13%)4 (4.76%)Fisher0.654ETV61 (2.13%)2 (2.38%)Fisher1.000GATA22 (4.26%)2 (2.38%)Fisher0.618DDX413 (6.38%)1 (1.19%)Fisher0.131IDH2 (4.26%)7 (8.33%)χ^2^ = 0.2760.600SETBP14 (8.51%)4 (4.76%)χ^2^ = 0.2300.632BCOR8 (17.02%)8 (9.52%)χ^2^ = 1.5800.209
The effect of IOL on survival and disease progression in MDS patients
Our studies above indicate that IOL can affect various aspects of MDS patients. Therefore, we analyzed the effect of IOL on disease progression and survival time in patients with MDS. The median overall survival (OS) time in IOL MDS patients was 8.00 months (95% CI 4.535–11.465), which was 20.00 months in patients with NIOL MDS (95% CI 12.035–27.965). The median OS time in IOL MDS group was notably shorter than that in NIOL MDS patients, having a statistically significant variance (Log Rank p = 0.003) (Fig. 1). The proportion of disease progression or transformation to AML in IOL MDS group was 11/54 (20.37%), which was higher than that in the NIOL MDS group 17/90 (18.89%) (p < 0.05). The median progression time was 5(1–38) months, which was shorter than that in patients with NIOL MDS 8 (1–50) months (p > 0.05).Fig. 1. Effect of IOL on the survival of MDS patients
Prognostic factors affecting patients with MDS
Cox univariate analysis was performed for factors, including gender, age, ANC, Hb, PLT, ferritin, chromosomal karyotype, and potential gene mutations affecting survival. Subsequently, factors with p value < 0.15 were added to the Cox multivariate analysis. The outcomes indicated that age ≥ 60y (HR = 1.502, 95% CI 1.044–2.161, p = 0.028), ferritin > 1000 ng/ml (HR = 1.452, 95% CI 1.006–2.098, p = 0.047), poor chromosomal karyotype (HR = 1.865, 95% CI 1.019–3.413, p = 0.043), TP53 mutation (HR = 2.070, 95% CI 1.278–3.353, p = 0.003), and RUNX1 mutation (HR = 1.707, 95% CI 1.014–2.872, p = 0.044) are independent adverse prognostic factors for MDS patients. Conversely, a good/normal chromosomal karyotype (HR = 0.627, 95% CI 0.406–0.969, p = 0.036) was an independent favorable prognostic factor for MDS patients (Table 7).Table 7 Univariate and multivariate analyses of factors affecting OS in patients with MDSVariantUnivariate AnalysisMultivariate AnalysisHR (95% CI)p valueHR (95% CI)p valueFemale1.147 (0.801–1.644)0.453Age ≥ 60y1.355 (0.953–1.928)0.0911.502 (1.044–2.161)0.028ANC < 0.8 × 10^9^/L1.250 (0.872–1.794)0.225Hb < 100 g/L1.719 (0.977–3.021)0.0601.328 (0.742–2.435)0.360PLT < 100 × 10^9^/L1.342 (0.904–1.993)0.1441.164 (0.765–1.771)0.477Ferritin > 1000 ng/mL1.502 (1.054–2.139)0.0241.452 (1.006–2.098)0.047IPSS-R CytogeneticsVery good/good0.565 (0.394–0.811)0.0020.627 (0.406–0.969)0.036Intermediate1.184 (0.751–1.864)0.465Poor0.802 (0.391–1.644)0.547Very poor2.826 (1.689–4.729) < 0.0011.865 (1.019–3.413)0.043Mutated GenesTP531.899 (1.185–3.042)0.0082.070 (1.278–3.353)0.003SRSF21.050 (0.562–1.962)0.878RUNX11.499 (0.901–2.493)0.1191.707 (1.014–2.872)0.044NRAS1.014 (0.529–1.944)0.967ASXL10.927 (0.628–1.367)0.701SF3B11.175 (0.708–1.949)0.532U2AF11.025 (0.638–1.646)0.920BCOR1.334 (0.806–2.207)0.262ZRSR20.862 (0.401–1.852)0.703
Discussion
Iron overload occurs in various hematological disorders, and excessive iron deposition can lead to the dysfunction of multiple organs. In MDS patients, IOL is often caused by ineffective hematopoiesis and repeated blood transfusions. IOL may affect the survival of MDS patients and ICT can improve the prognosis of IOL patients [7]. Therefore, we evaluated the conditions of MDS patients from multiple perspectives, including clinical features, immune function, bone marrow hematopoiesis, gene mutations, and prognosis, to provide clinical strategies for improving the prognosis of IOL MDS patients.
MDS occurs more frequently in older patients. The median age of the MDS patients included in this study was younger than those abroad. By reviewing the data of multi-center clinical studies in China, our MDS patients were also younger compared with foreigner MDS patients. Previous studies have shown that there are genetic epigenetics racial differences in hematological tumors, including MDS [13–15]. We found that IOL MDS patients had a poorer performance according to ECOG scores, indicating a poorer performance status in IOL MDS patients. The most common causes of death in MDS patients are complications related to MDS itself and its treatment [16]. Therefore, we further analyzed the blood cell levels and organ functions of patients with MDS.
Chronic blood transfusion is the most common cause of IOL in MDS patients. However, some MDS patients have already experienced iron overload at the early stage of the disease or even before blood transfusion. Hepcidin is down-regulated in hematological diseases characterized by erythroid ineffective hematopoiesis and is considered to be associated with IOL in MDS patients [17]. We found that 57.41% of IOL MDS patients had blood transfusion dependence with a heavy transfusion burden before diagnosis. However, nearly half of the IOL MDS patients had iron overload without blood transfusion before diagnosis, which might be related to the abnormal expression of hepcidin. Iron overload can lead to hepatic and cardiac iron deposition and multiple organ dysfunction. The ALT levels in the IOL MDS patients were found to be significantly higher, which indicated that IOL can damage the liver function in MDS patients, which might lead to decreased drug tolerance in IOL MDS patients. Meanwhile, the level of blood glucose level in IOL MDS patients was significantly higher, but not on blood lipid levels and thyroid function, which was similar to the research conducted by Yassin [18]. Abnormal cellular metabolic pathways play a pivotal role in leukemia cell proliferation and survival and mediate the sustained activation of oncogenes [19]. These results suggest IOL MDS patients are more susceptible to liver function damage and elevated blood glucose levels. Severe liver failure may affect the survival of patients with MDS, whereas abnormally elevated blood glucose could promote MDS progression through tumor cell metabolism.
IOL may affect bone marrow hematopoietic function. We found that IOL MDS patients had lower levels of peripheral blood cells, especially in white blood cells and hemoglobin. Given the reduction of peripheral blood cells in IOL MDS patients, we conducted further analysis of the correlation between IOL and hematopoietic function in MDS patients. Our findings indicated the proportion of erythrocyte and megakaryocyte counts in the IOL MDS patients were significantly decreased, suggesting that the hematopoietic functions of erythrocyte and megakaryocyte were inhibited in these patients. IOL can increase the generation of reactive oxygen species (ROS), which can damage normal bone marrow stem cells in mouse models of MDS and shorten their survival [20]. Our previous research indicated that IOL increases the production of ROS in CD34^+^ and NK cells in MDS patients, and suggested that IOL may contribute to the progression of MDS [21]. These results indicate that IOL can impair bone marrow hematopoiesis in MDS patients, and the decreased hemoglobin may necessitate repeated blood transfusions, thereby exacerbating IOL. However, HTB may further inhibit erythroid hematopoiesis in the bone marrow of MDS patients. Due to the limited cases of this study, the impact of IOL on erythroid hematopoiesis in bone marrow in NTD MDS patients should be further studied in future. For diseases such as MDS, which present with bone marrow failure, IOL is undoubtedly a worsening factor.
MDS patients have various genetic and chromosomal abnormalities. Recurrent mutations involving RNA splicing, DNA methylation and DNA repair have been recognized as significant foundations for the development of MDS [10]. We found that more than 75% of MDS patients harboring two or more mutations. The ZRSR2 gene mutation occurred exclusively in the NIOL MDS group and was significantly higher compared with the IOL MDS group. The ZRSR2 gene is associated with RNA splicing, which involved in various signaling pathways, including myeloid differentiation and the tumor suppressor gene PTEN [22, 23]. Notably, in this study, mutations in ZRSR2 gene were exclusively found in male patients. Recently, male patients with ZRSR2 mutations were associated with an indolent clinical phenotype and improved OS through a study involving genomic analyses of 3233 patients with MDS or related disease [24]. We also found that the proportion of normal chromosome karyotypes in IOL MDS patients was markedly decreased, with the 7q chromosome abnormality being particularly prominent. The 7q anomaly is found in approximately 8% of newly diagnosed MDS patients and associated with poor OS [10]. These results suggest IOL may affect the prognosis of MDS patients by influencing genetic mutations and chromosome karyotypes.
Abnormal immune function plays a crucial role in MDS progression. Inflammation is associated with the conversion of MDS to AML and can affect the immune microenvironment in the bone marrow of leukemia patients [25]. MDS patients exhibit various gene mutations; therefore, we analyzed the immune function of MDS patients. We found that the IL-6 level in IOL MDS patients was notably higher. Previous studies have shown that the serum IL-6 level in MDS patients was significantly higher than that in the healthy control. However, there is no significant difference between the lower-risk group and the higher-risk group [26]. Recent studies have shown that the serum IL-6 level in patients with MDS–MLD was significantly higher than that in patients with MDS–SLD and MDS–RS, but there is no significant difference between different IPSS-R group. Further analysis indicates that the IL-6 level is positively correlated with the time of the first red blood cell transfusion in MDS patients [27]. Compared with healthy controls, in patients with transfusion-dependent thalassemia, the IL-6 level was significantly increased and showed a significant positive correlation with ferritin [28]. The above research results indicate that MDS patients suffered from immune abnormalities, and the high level of IL-6 is closely related to IOL MDS patients.
The predominant DCs are divided into pDC (CD11c^−^CD123^+^), conventional type I DC (cDC1) (CD11c^+^Clec9A^+^), cDC2 (CD11c^+^CD1c^+^) and monocyte-derived DC (MoDC). pDCs are the main type I interferon producing cells in humans and are able to modulate innate and adaptive immune responses [29]. In this study, we found that the pDC/DC in IOL MDS group were significantly lower. Previous studies have shown that pDC levels in lower-risk MDS patients are higher than those in normal controls, whereas higher-risk MDS patients exhibit a significant decrease in pDC levels compared to lower-risk MDS patients [30]. We further analyzed the subtype of cDC. We found that the ratio of cDC2/cDC in the IOL group was significantly lower than that in the NIOL group, whereas the CD16^+^DC/cDC ratio in the IOL MDS was significantly higher. Previous studies have shown that the ability of CD34^+^ progenitor cells differentiate to DCs in vitro in MDS patients is relatively decreased, and the defect in the number of DC precursor cells may lead to malignant clones evades immune recognition and promoting the progression of MDS to AML [31]. Previous studies have shown that CD16^+^DC is highly expressed in the peripheral blood of patients with multiple myeloma and is related to the prognosis of patients with multiple myeloma [32]. In this study, the pDC/DC ratio and cDC2/cDC ratio was significantly decreased in IOL MDS patients, indicating that IOL may participate in disease progression by affecting subpopulations of DCs in MDS patients.
IOL could affect the survival of MDS patients. We found that the OS of IOL MDS patients was significantly shorter with significantly higher progression rate. Although the progression time of MDS in IOL group was slightly shorter, and a further extended follow-up is required for confirmation. Kikuchi demonstrated that SF (serum ferritin) levels were significantly higher in patients with higher-risk MDS, and the patients in the lower SF group showed a marked increase in OS and leukemia-free survival [33]. In MDS patients, a transferrin saturation > 80% and ferritin levels > 800 µg/L were associated with a poor 5-year OS, progression-free survival, and leukemia-free survival [34]. These results confirm the effect of IOL on the survival and disease progression of MDS.
We conducted univariate and multivariate analyses of the prognosis in MDS patients, revealing that age ≥ 60 years, ferritin > 1000 ng/ml, extremely poor chromosomal karyotype, gene mutations of TP53 and RUNX1 were independent adverse prognostic factors for MDS patients. IOL indicates a relatively poor prognosis. ICT is associated with prolonged survival in transfusion-dependent MDS patients, and IOL is also a poor prognostic factor in MDS patients who undergo allogeneic hematopoietic stem cell transplantation [35, 36]. TP53 and RUNX1 gene mutations in MDS patients were associated with unfavorable clinical features and prognosis [37, 38], which were consistent with this study. Moreover, a good chromosomal karyotype is an independent favorable prognostic factor in MDS patients.
Conclusion
Based on the findings above, MDS patients with IOL exhibit poorer performance status and partial impairment of the liver and pancreatic functions. The peripheral blood cells of IOL MDS patients were decreased, especially in white blood cells and hemoglobin, while the erythrocyte and megakaryocyte in bone marrow were significantly suppressed, indicating a more severe degree of bone marrow failure. Iron overload can lead to genomic and chromosomal instability, with a significant reduction in the ZRSR2 gene mutation and increased incidence of 7q- chromosomal abnormalities in IOL MDS patients. Aberrations in the levels of inflammatory factors and DC subpopulations in IOL MDS patients may promote disease progression. All of mentioned above contribute to the multifaceted effects of IOL on the prognosis of MDS. Our analysis provides a direction for further in-depth research on the mechanisms related to IOL and the development of corresponding targeted therapies.
Supplementary Information
Additional file 1. Table S1. List of gene mutations