Maternal metabolic health conditions and risk of stillbirth in India: evidence from a nationwide survey
Mohammad Hammad, Shivalingappa Halli, Mohammad Hifz Ur Rahman

TL;DR
This study shows that diabetes and hypertension in mothers increase the risk of stillbirth in India, emphasizing the need for better prenatal care and targeted interventions.
Contribution
The study provides new evidence on the impact of maternal diabetes and hypertension on stillbirth risk in India using nationwide survey data.
Findings
Diabetes increases the risk of stillbirth by 74% in Indian mothers.
Hypertension increases the risk of stillbirth by 50% in Indian mothers.
Scheduled caste mothers show a 30% higher stillbirth risk compared to others.
Abstract
Stillbirth, defined by foetal death at or beyond 28 weeks of gestation, represents a significant challenge in India, contributing to approximately 500,000 foetal deaths each year. The country’s stillbirth rate of 12.2 per 1000 births underscores the imperative to address this preventable occurrence. While maternal metabolic conditions diabetes, and hypertension, are widely recognized as established risk factors for stillbirth worldwide, the extent of their impact on India’s stillbirth burden remains inadequately elucidated due to limited evidence. This cross-sectional study utilized NFHS-5 data to examine stillbirths in the most recent pregnancy outcomes of 204,723 women aged 15–49 years, sampled from all states and union territories of India. The primary exposures assessed were diabetes, and hypertension. Descriptive analyses were conducted to determine the prevalence of diabetes,…
Genes, proteins, chemicals, diseases, species, mutations and cell lines named across the full text — each resolved to its canonical identifier and authoritative record.
Click any figure to enlarge with its caption.
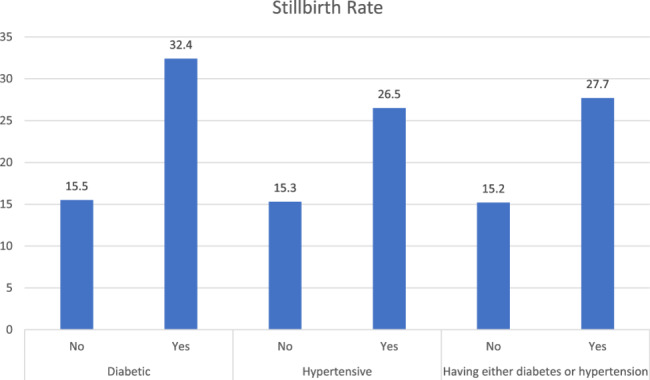 Figure 1
- —Manipal Academy of Higher Education, Manipal
Peer Reviews
No public reviews on file for this paper yet. If you reviewed it on a platform where reviews are public (OpenReview, ICLR, NeurIPS, ICML), you can paste yours below so the community can read it here.
Videos
No videos yet. Explain this paper in a talk, walkthrough, or lecture? Add one.
Taxonomy
TopicsGlobal Maternal and Child Health · Pregnancy and preeclampsia studies · Birth, Development, and Health
Introduction
At 1.9 million stillbirths globally per year- one every 16 s, the burden of stillbirths continues to be a significant public health concern [1]. More than 40% of the stillbirths occur during labour which can be prevented with better quality of healthcare during childbirth [2]. The global stillbirth rate in 2021 was 13.9 per 1000 live births. Sub-Saharan Africa and South Asia accounted for three-quarters of all stillbirths, with a notable concentration of stillbirths in these regions with detrimental effects on communities as well as the emotional toll on impacted families. Healthcare providers and the economy highlight the need to address the issue urgently [3].
Even though stillbirths have a significant impact, they have not received the same amount of concern from the community as maternal and child mortality on the global health agenda [3–5]. However, there were no targets in the 2030 Agenda for Sustainable Development Goals explicitly concerning stillbirth.
In India, the prevalence of hypertension and diabetes among pregnant women is a growing concern. The National Family Health Survey-4 data revealed that 4.4% women had hypertension, and 2.4% women diagnosed with diabetes [6]. The increase in gestational diabetes mellitus (GDM) from 0.53% in 2015-16 to 0.80% in 2019-21 at the national level is alarming and can lead to adverse pregnancy outcomes such as preterm birth, stillbirth, and maternal mortality [7]. These conditions not only pose risks to the health of the mother but also have potential long-term effects on the child.
In India, the impact of the issue is particularly alarming, with an estimated 286,482 stillbirths in 2021, consistently placing the country first in the absolute number of stillbirths for over two decades [1, 2, 5]. This is despite the remarkable progress made by the county in reducing stillbirth rates over the past twenty years, with rates decreasing from 29.6 per 1000 births in 2000 to 12.2 per 1000 births in 2021 [5]. Recognizing stillbirths as a persistent public health challenge, India launched the India Newborn Action Plan (INAP) in 2014 with an ambition to reduce the stillbirth rate to less than 10 per 1000 births by the year 2030 [8].
Previous research has mainly focused on the factors like pre-term birth [9, 10], post neonatal mortality [11], infant mortality [12] and other maternal factors but studies on association of stillbirth with maternal metabolic conditions during pregnancy have not been done at a nationally representative level. In the present study we will focus on the two metabolic conditions of women during pregnancy diabetes and hypertension respectively and will understand the risk poised to the foetus and the mothers suffering from these metabolic diseases with confounder bias by including risk factors like age of women, source of water, type of delivery, facility at birth as well as adjusting of socio-demographic factors. Although there are various risk factors in stillbirth the study exclusively focuses om diabetes and hypertension due to their increasing prevalence in India and there established biological plausibility in affecting foetal outcomes.
Methods
Data
Our analysis is based on individual-level data sourced from the National Family Health Survey 5 (NFHS-5) conducted in India from 2019 to 2021. The National Family Health Surveys (NFHS) constitute a series of cross-sectional, nationally representative surveys designed to capture information on various demographic, socioeconomic, maternal, and child health indicators, as well as reproductive health and family planning aspects. Employing a two-stage stratified sampling approach, the fifth round of NFHS involved interviewing approximately 724,115 women aged 15 to 49 from 636,699 households, achieving a commendable 92% response rate. Additional details regarding the sampling strategy and tools employed can be utilized elsewhere. Individual Recode file (IAIR7EFL) was utilized for the analysis. The study sample was 204,723 which consisted of women aged 15–49 years who had their pregnancy in the past 5 years preceding the survey [13].
Preliminary definitions
Outcome variable
The primary outcome variable for the study is stillbirth of the child i.e. a foetus which dies after 28 weeks of pregnancy, before or at the time of birth, is considered as a stillbirth. Stillbirth was calculated using the calendar data. Calendar data provides more robust estimation of the stillbirth [14]. Miscarriages and abortions were excluded from the analysis.
Independent variables
The primary exposure variable under examination were the maternal metabolic conditions having diabetes categorized in two groups: diabetic and non-diabetic, having hypertension classified into two categories: hypertensive and non-hypertensive. Socio-demographic attributes encompassed the age, educational level, wealth index and place of residence and social category of the respondent. The household characteristics were also included in the study and were composed of type of sanitation facility (unimproved or improved), type of water source (piped improved, other improved and unimproved source). Maternal factors such as facility at birth (public, private or other), type of delivery (caesarean or non-caesarean), number of antenatal visits (no visits, 1 to 4 Visits, more than 4 visits) were also considered for the study.
The wealth index is a composite indicator of a household’s standard of living, derived using principal component analysis (PCA) based on data on asset ownership, housing quality, and access to basic services. In NFHS, households are typically classified into five quintiles; however, for this study, they were re-categorized into three groups: Poor (poorest and poorer), Middle, and Rich (richer and richest). This index serves as a widely accepted proxy for economic status and forms a key component of socioeconomic status (SES) in population-based surveys like NFHS.
Statistical analysis
Univariate analysis was utilized to understand the sample characteristics of the women who had their births in last 5 years along with background variables. The bivariate analysis along with chi-square test of association was employed to understand the distribution of stillbirth with two metabolic conditions diabetes and hypertension. The strength of bivariate analysis along with chi-square test of association lies in its ability to determine whether is a statistically significant association between the variables. It allows to assess the independence of variables without assuming a normal distribution.
The relationship between stillbirth and maternal metabolic conditions was accessed using the binary logistic regression model.
The binary logistic regression model offers several strengths, including its ability to predict binary outcomes with strong interpretability through odds ratios. It efficiently handles non-linear relationships between the independent variables and the probability of the outcome. Additionally, the model is robust to non-normality in the predictors, making it suitable for a wide range of data types.
An aggregate variable was created for the metabolic conditions with women suffering from the two conditions namely diabetes, hypertension were clubbed into a single variable in order to run the binary logistic regression model and understand the combined effect of the diseases along with all the covariates i.e. maternal and socio-demographic factors.
A thorough assessment of multicollinearity was done using the Variance Inflation Factor (VIF). After performing the VIF Analysis, all variables included in the model displayed the VIF below 5, indicating that multicollinearity is not a concern in the model, as per commonly accepted guidelines. Therefore, the regression results are stable, and the interpretation of the coefficients are reliable. In addition to the VIF analysis, we also examine the correlation matrix of our independent variables. This further confirmed that multicollinearity was not a significant concern in the models. The tables for VIF and correlation matrix are present in Tables 1 and 2 of the supplementary material. The selection of the covariates was informed by existing literature, which identifies both pertinent risk factors and potential confounders that may influence the association between metabolic conditions and stillbirth [7, 11, 12, 15, 17].
Table 1. Sample background characteristics and prevalence of stillbirth with chi-square test of significance among women aged 15–49 years in India during 2019-21 VariablesSamplePercentStillbirths (w%)^a^p-valueHaving diabetes Not having diabetes200,84099.011.550.01 Having diabetes20090.993.24Having hypertension Not having hypertension196,72196.711.530.01 Having hypertension66953.292.65Having diabetes or hypertension Not having diabetes or hypertension196,63296.051.520.01 Having either diabetes or hypertension80913.952.77Type of place of residence Urban45,02521.991.290.01 Rural159,69878.011.66Wealth Category Poor97,66947.711.820.01 Middle40,22919.651.56 Rich66,82532.641.24Highest level of Education No education41,97820.51.950.01 Primary25,35112.381.69 Secondary106,98752.261.52 Higher30,40714.851.13Social category Scheduled caste40,60119.831.370.01 Scheduled tribe40,70219.881.98 Other backward classes77,33537.781.46 General/Upper Caste46,08522.511.48Region Northern28,90710.551.060.01 Central53,74727.381.98 Eastern39,15325.741.99 Northeastern31,7304.181.16 Western17,89512.871.09 Southern33,29119.281.07Type of Water Source Unimproved Source13,3966.991.20.01 Improved/Piped Source86,39545.061.28 Other Improved Source91,96047.961.77Age of Woman 20 years and below25,09813.771.650.01 21–30 years141,75471.851.27 30 years & above33,01414.380.96Facility at birth Public114,95161.860.950.01 Private40,28028.191.28 Other21,6119.941.26Number of antenatal visits No Visits41,70320.124.040.01 1 to 4 visits89,11042.41.14 More than 4 visits73,91037.481.01Whether had birth by caesarean method No139,08378.650.980.01 Yes37,75921.351.36N204,723100.002596 (1.56)^a^% weighted
Table 2. Unadjusted logistic regression model estimates for risk of stillbirth by primary exposure variables in India during 2019-21VariablesUnadjusted ModelOR^a^ (95% CI)Having Diabetes Not having diabetes (ref.)Ref. Having diabetes2.17*(1.65–2.88)Having Hypertension Not having hypertension (ref.)Ref. Having hypertension1.98*(1.68–2.35)Having Diabetes or Hypertension Not having diabetes or hypertension (ref.)Ref. Having either diabetes or hypertension2.05*(1.76–2.39)^a^Odds Ratio, *- *p *< 0.05
We employed a stepwise modelling approach to systematically investigate the independent and combined effects of the metabolic conditions- namely diabetes and hypertension- on stillbirth. By isolating diabetes in the first model and hypertension in the second, we aimed to assess their individual contributions to stillbirth risk. The third model, which considered the presence of either condition, was designed to capture cumulative or interactive effect of the metabolic conditions. This approach allows for a clearer understanding of how each condition independently and jointly influences the adverse pregnancy outcomes.
Results
Table 1 shows the sample characteristics of women aged 15–49 along with background variables. 3.29% percent of women had hypertension, and 1% women had diabetes. 78% of the women lived in rural areas, 20.5% of the women were illiterate and only 14.9% of women had attained higher education and nearly half of the women belonged to poor households (47.7%). Maternal characteristics showed most of the births happened to women in the age group 21–30 years (70.9%).
Table 1 also presents the prevalence of stillbirths across the primary exposure variable and other sociodemographic and environmental factors. Women with diabetes and hypertension have a higher prevalence of stillbirth (3.2% and 2.7%, respectively) compared to those who are not. Stillbirths are higher in rural women (1.7%) compared to those residing in urban areas (1.3%). The prevalence of stillbirth decreases with increased wealth and the level of education women attain. The prevalence of stillbirth is significantly lower among women who get 4 or more antenatal visits (1%) compared to those with no antenatal visits (around 4%).
Figure 1 shows the stillbirth rates (per 1000) for women suffering from diabetes, hypertension, and a combined rate for either of the diseases. Surprisingly, there is a significant difference of stillbirth rate among women who are suffering from these metabolic conditions during their pregnancy as compared to the women who are not. Diabetic women had a stillbirth rate of 31 stillbirths per 1000 whereas non-diabetic women have 14.5 per 1000 total births. Similarly, women having hypertension had stillbirth rate around 28 stillbirths per 1000 total births, which is significantly higher than those who do not have hypertension.
Fig. 1. Stillbirth rate (per 1000) for metabolic conditions under examination i.e. diabetes and hypertension in India during 2019-21
Table 2 presents the unadjusted odds ratios for the primary exposure variables for the study. Women who had diabetes had almost two times more likelihood of suffering a stillbirth (OR 2.17; 1.65–2.88, 95% CI) similarly a synergistic relation was seen with women who had hypertension with nearly double the risk of suffering a stillbirth (OR 1.98; 1.68–2.35, 95% CI). Having any one of the metabolic conditions i.e. diabetes or hypertension during also came with similar odds with almost double the risk of stillbirth (OR 2.05; 1.76–2.39, 95% CI).
Table 3 provides the logistic regression estimates for risk of stillbirth adjusted with background variables.
Table 3. Adjusted logistic regression model estimates for risk of stillbirth by background characteristics among women aged 15–49 years in India during 2019-21VariablesModel-1^a^Model-2^b^Model-3^c^AOR^d^(95% CI)AOR (95% CI)AOR (95% CI)Having diabetes Not having diabetes (ref.)Ref. Having diabetes1.74*(1.14,2.67)Having hypertension Not having hypertension (ref.)Ref. Having hypertension1.50*(1.16,1.95)Having diabetes or hypertension Not having diabetes or hypertension (ref.)Ref. Having either diabetes or hypertension1.58*(1.25,1.99)Type of place of residence Urban (ref.)Ref.Ref.Ref. Rural1.19*(1.02,1.40)1.18*(1.01,1.39)1.18*(1.01,1.39)Highest level of Education No education (ref.)Ref.Ref.Ref. Primary1.01(0.85,1.20)1.02(0.85,1.21)1.01(0.85,1.20) Secondary0.85*(0.74,0.98)0.85*(0.75,0.99)0.85*(0.74,0.98) Higher0.72*(0.59,0.89)0.73*(0.59,0.90)0.72*(0.58,0.89)Wealth Category Poor (ref.)Ref.Ref.Ref. Middle0.79*(0.68,0.92)0.79*(0.68,0.92)0.80*(0.69,0.93) Rich0.64*(0.54,0.76)0.64*(0.54,0.76)0.65*(0.55,0.78)Social category General/Upper Caste (ref.)Ref.Ref.Ref. Scheduled caste1.29*(1.09,1.53)1.30*(1.10,1.53)1.30*(1.10,1.53) Scheduled tribe0.93(0.78,1.12)0.94(0.79,1.14)0.95(0.79,1.14) Other Backward Classes1.09(0.94,1.29)1.10(0.95,1.28)1.10(0.95,1.28)Region Northern (ref.)Ref.Ref.Ref. Central1.86*(1.52,2.27)1.89*(1.54,2.31)1.88*(1.54,2.30) Eastern1.91*(1.55,2.36)1.93*(1.57,2.39)1.92*(1.56,2.37) Northeastern0.90(0.70,1.18)0.94(0.73,1.22)0.93(0.72,1.20) Western1.05(0.80,1.37)1.06(0.81,1.40)1.06(0.81,1.38) Southern1.05(0.83,1.34)1.08(0.85,1.37)1.07(0.84,1.35)Type of Water Source Unimproved Source (ref.)Ref.Ref.Ref. Improved/Piped Source1.05(0.84,1.33)1.03(0.82,1.31)1.02(0.81,1.28) Other Improved Source1.07(0.86,1.35)1.06(0.85,1.37)1.05(0.84,1.31)Age of Woman 21–30 years (ref.)Ref.Ref.Ref. 20 years and below1.04(0.88,1.22)1.03(0.88,1.21)1.04(0.88,1.22) 30 years & above0.83(0.67,1.02)0.83(0.67,1.02)0.82(0.67,1.01)Facility at birth Public (ref.)Ref.Ref.Ref. Private1.62*(1.41,1.87)1.63*(1.41,1.87)1.63*(1.42,1.87) Other1.02(0.87,1.21)1.03(0.87,1.21)1.04(0.88,1.23)Number of antenatal visits No Visits (ref.)Ref.Ref.Ref. 1 to 4 visits1.21(0.98,1.50)1.22(0.99,1.52)1.23(0.99,1.52) More than 4 visits1.24(0.99,1.55)1.25*(1.00,1.57)1.26*(1.00,1.58)Whether had birth by caesarean method No (ref.)Ref.Ref.Ref. Yes1.40*(1.22,1.61)1.39*(1.21,1.60)1.39*(1.21,1.60)^a^Model - 1 considers women who only have diabetes^b^Model - 2 considers women who only have hypertension^c^Model - 3 considers women who have either diabetes or hypertension^d^Adjusted Odds Ratio, *- *p *< 0.05
Model 1 shows the logistic regression model of risk of stillbirth in women who only have diabetes along with background variables. The model results indicate the women who have diabetes had 74% higher likelihood of having a stillbirth (AOR 1.74; 1.14–2.67, 95% CI).
There was a significant urban-rural disparity with women residing in rural places having 19% higher risk (AOR 1.19; 1.02–1.40, 95% CI). Additionally, as the education level increased the risk of stillbirth dropped significantly with women having higher education with the lowest risk (AOR 0.72; 0.59–0.76, 95% CI) followed by women with secondary education (AOR 0.85; 0.74–0.98, 95% CI).
The EAG (Empowered Action Group) states mainly in the central (including Uttarakhand, Uttar Pradesh, Madhya Pradesh, and Chhattisgarh) and eastern (comprising Bihar, Jharkhand, West Bengal, Odisha, and Sikkim) regions of India had a nearly double likelihood of risk of stillbirth with odds rations (AOR 1.86; 1.52–2.27, 95% CI) and (AOR 1.91; 1.55–2.36, 95% CI) respectively.
Women delivering at private health facilities had higher risk of stillbirth (AOR 1.62; 1.41–1.87, 95% CI) as compared to women delivering at public health facilities. Additionally, women delivering through caesarean deliveries had 40% higher risk of stillbirth (AOR 1.40; 1.22–1.61, 95% CI) as compared to women who had normal/vaginal deliveries.
Model 2 presents the logistic regression model analysing the risk of stillbirth in women who only have hypertension along with confounding variables. The results of the model indicated that women who had only hypertension had 50% higher odds of having a stillbirth (AOR 1.50; 1.16–1.95, 95% CI). Results were similar to Model-1 for the background variables.
Model 3 shows the combined model with conditions, diabetes, or hypertension. The logistic regression model results indicated a 58% (AOR 1.58; 1.25–1.99, 95% CI) higher risk of stillbirth in women with metabolic conditions such as diabetes or hypertension compared to those without these conditions.
In terms of socio-demographic factors, women residing in rural areas faced a 18% (AOR (1.18; 1.01–1.39, 95% CI) more significant risk of stillbirth than their urban counterparts. Additionally, women with secondary and higher education levels had significantly lower chances (AOR 0.85; 0.74–0.98, 95% CI), (AOR 0.72;0.58–0.59, 95% CI) of experiencing stillbirth compared to those who were illiterate or had no formal education. Household wealth was significantly associated with the risk of stillbirth. Women from middle-income households had a lower likelihood of experiencing stillbirth compared to those from poor households (AOR: 0.80; 95% CI: 0.69–0.93), and the risk was even lower among women from richer households (AOR: 0.65; 95% CI: 0.55–0.78).
Geographically, the Central region of India (including Uttarakhand, Uttar Pradesh, Madhya Pradesh, and Chhattisgarh) had nearly 2 times higher likelihood of stillbirth (AOR 1.88;1.54–2.30, 95% CI). Similarly, the Eastern region (comprising Bihar, Jharkhand, West Bengal, Odisha, and Sikkim) had 1.92 times higher probability of stillbirth (AOR 1.92;1.56–2.37, 95% CI) compared to the northern region (Jammu & Kashmir, Ladakh, Punjab, Himachal Pradesh, and Rajasthan).
The facility at birth was also significant, with the child born in private facilities having a 63% higher risk of stillbirth (AOR 1.63; 1.42–1.87, 95% CI) than those born in public facilities. The type of delivery was another important factor, with women undergoing caesarean sections having a 39% higher chance of stillbirth (AOR 1.39; 1.21–1.60, 95% CI) compared to those who had vaginal deliveries.
Discussion
Our Study showed that for the women to be inflicted with any of the metabolic condition during their pregnancy i.e. diabetes and hypertension, certainly increases significantly the risk of them suffering a stillbirth compared to who are not suffering from any of these metabolic diseases during their pregnancy. Stillbirth can be a very tragic event in the life of a mother as well it takes an emotional toll on the family of the women [15–17].
The results showed a skewed relationship of stillbirth with women belonging to the more deprived groups with risk of stillbirth being higher in the women who had no formal education, those residing in rural areas or the women who belonged to the scheduled caste group as compared to the more prosperous and advantaged women [18–20].
The region wise burden of stillbirth is consistent with previous research with the higher risk among women residing in the central and the eastern regions of the country [21–24]. These are useful findings for policy makers to develop targeted interventions in the high burden states.
Results also indicated that because of pregnancy complications, women giving birth by the caesarean delivery also face 39% higher risk of stillbirth and similar evidence can also be found in the published research [25].
Based on our findings, we recommend a targeted approach to address the risk of stillbirth associated with maternal diabetes and hypertension in India. Priority should be given to enhancing screening and management of these conditions, particularly in rural areas and among disadvantaged groups where stillbirth risk is higher. Integrated care pathways for pregnant women with diabetes and/or hypertension should be developed, ensuring close monitoring throughout pregnancy. We advocate for strengthening the capacity of healthcare providers, to effectively manage these metabolic conditions. Targeted health education campaigns are crucial to raise awareness about the risks associated with diabetes and hypertension during pregnancy, focusing on populations with lower educational attainment. Efforts should be made to improve access to quality antenatal care and increase the number of antenatal visits, particularly for high-risk women. Addressing the urban-rural disparity in stillbirth risk by improving healthcare infrastructure in rural areas is essential.
There are several limitations to consider when using NFHS data to calculate stillbirth rates. Firstly, NFHS surveys are cross-sectional in nature, meaning that they provide a snapshot of the population at a single point in time and may not capture changes in stillbirth rates over time. Additionally, NFHS surveys rely on self-reported data, which can be subject to recall bias and underreporting, particularly for sensitive topics such as stillbirths. Furthermore, NFHS surveys may not capture stillbirths that occur outside of health facilities, as these events may be less likely to be reported or recorded. There might be residual confounding in our study, given the observational nature of the data. While we have adjusted for key sociodemographic and clinical factors, there may be unmeasured confounders that could influence the associations we observed. Despite these limitations, NFHS data remain a valuable resource for understanding trends in stillbirth rates and informing public health policies and programs aimed at reducing stillbirths in India.
Conclusion
Maternal diabetes and hypertension are significantly associated with heightened stillbirth risk in India, indicating the need to optimize metabolic health before and during pregnancy. A synergistic interaction between diabetes and hypertension underscores the importance of integrated management of coexisting conditions. Tailored interventions for mothers at high-risk including those with inadequate antenatal care and in higher burden regions can help mitigate the risk. Our findings highlight the urgent need to improve screening and management of maternal metabolic conditions as a pivotal public health strategy to curb India’s large stillbirth burden. This has implications for antenatal care policies and programs targeting modifiable metabolic risks. Further research can elucidate biologic pathways underlying these associations. Collaborative efforts across obstetrics, medicine and public health incorporating contextual factors are essential to transform pregnancy outcomes.
Supplementary Information
Supplementary Material 1.
The reference list from the paper itself. Each links out to its DOI / PubMed record.
- 1Never Forgotten. The situation of stillbirth around the globe - UNICEF DATA https://data.unicef.org/resources/never-forgotten-stillbirth-estimates-report/
- 2Stillbirth. Available from: https://www.who.int/health-topics/stillbirth#tab=tab_1
- 3India Newborn Action. Plan (INAP)| My Gov.in. Available from: https://www.mygov.in/group-issue/india-newborn-action-plan-inap/
- 4The DHS Program - Calendar Tutorial. Available from: https://www.dhsprogram.com/data/calendar-tutorial/
- 5Pradhan Mantri Surakshit Matritva Abhiyan:. National Health Mission. Available from: https://nhm.gov.in/index 1.php?lang=1&level=3&sublinkid=1308&lid=689. Cited 2024 Feb 21.
- 6Tandon A, Roder-De Wan S, Chopra M, Chhabra S, Croke K, Cros M et al. Adverse birth outcomes among women with ‘low-risk’ pregnancies in India: findings from the Fifth National Family Health Survey, 2019–21. The Lancet Regional Health - Southeast Asia. 2023. Available from: http://www.thelancet.com/article/S 2772368223001130/fulltext. Cited 2024 May 410.1016/j.lansea.2023.100253 PMC 1038266337521318 · doi ↗ · pubmed ↗