Food and Housing Insecurity, Stress, and Health Care Use After Medicaid Expanded Services Program
Anne N. Thorndike, Jessica L. McCurley, Yuchiao Chang, Jessica Cheng, Cheryl R. Clark, Christine Vogeli, Sydney McGovern, Vicki Fung, Douglas E. Levy

TL;DR
A study in Massachusetts found no significant short-term improvements in food or housing insecurity, diet, stress, or health care use among Medicaid beneficiaries participating in a new program.
Contribution
This study evaluates the impact of a Medicaid program addressing social needs, finding no significant short-term benefits in key outcomes.
Findings
FSP participation was not associated with changes in food or housing insecurity, diet, stress, or health care use after one year.
Interviews revealed mixed participant experiences, including both benefits and ongoing challenges.
No differences were observed in depression or anxiety symptoms between FSP and non-FSP participants.
Abstract
This cohort study assesses the social, behavioral, and clinical outcomes associated with participation in the Massachusetts Medicaid Flexible Services program. What changes in social needs, diet, stress, and acute health care use are associated with implementation of the Massachusetts Medicaid Flexible Services program (FSP) addressing food and housing insecurity? In a cohort study of 153 FSP participant episodes and 1495 non–FSP participant episodes among adult Medicaid beneficiaries, there were no differences in food or housing insecurity, dietary quality, stress, or health care use between these 2 groups at 1 year. In interviews, participants reported experiencing a range of positive, neutral, and negative changes following FSP. The findings suggest that FSP participation was not associated with positive changes in social needs, diet, stress, or health care use within the first…
Genes, proteins, chemicals, diseases, species, mutations and cell lines named across the full text — each resolved to its canonical identifier and authoritative record.
Click any figure to enlarge with its caption.
 Figure
| Characteristic | Participants, No. (%) (n = 153) |
|---|---|
| Timing of FSP enrollment | |
| Between baseline and year 1 assessments | 66 (43.1) |
| Between year 1 and year 2 assessments | 41 (26.8) |
| Between year 2 and year 3 assessments | 46 (30.1) |
| Type of FSP services | |
| Nutrition: produce vouchers | 96 (62.7) |
| Nutrition: medically tailored meals, food boxes, or education | 41 (26.8) |
| Housing: search and stabilization or legal support | 16 (10.5) |
| No. of months enrolled in FSP, mean (SD) | 5.7 (2.9) |
| Nutrition services | 5.8 (2.9) |
| Housing services | 5.1 (3.5) |
| Documented receipt of intended FSP services | 149 (97.4) |
| Diagnoses documented on FSP enrollment form | |
| Anxiety, uncontrolled | 28 (18.3) |
| Depression, uncontrolled | 42 (27.5) |
| Diabetes, uncontrolled | 19 (12.4) |
| Hypertension, uncontrolled | 16 (10.5) |
| Obesity (BMI ≥30) | 88 (57.5) |
| Other behavioral health diagnoses | 22 (14.4) |
| Other physical health diagnoses | 36 (23.5) |
| Substance use disorder | 23 (15.0) |
| Characteristic | FSP group, No. (%) (n = 153) | Non-FSP group (n = 1495 episodes) | ||
|---|---|---|---|---|
| Unweighted, No. (%) | Propensity score weighted, No. (%) | Standardized difference | ||
| Age, mean (SD), y | 43.6 (10.8) | 42.5 (11.2) | 43.5 (3.4) | 0.00 |
| Sex | ||||
| Female | 129 (84.3) | 1152 (77.1) | 127 (83.2) | 0.03 |
| Male | 24 (15.7) | 343 (22.9) | 26 (16.8) | −0.03 |
| Race and ethnicity | ||||
| Hispanic | 100 (65.4) | 754 (50.4) | 101 (65.7) | 0.00 |
| Non-Hispanic Black | 11 (7.2) | 142 (9.5) | 12 (7.8) | −0.02 |
| Non-Hispanic White | 34 (22.2) | 516 (34.5) | 34 (21.9) | 0.00 |
| Other categories | 8 (5.2) | 83 (5.6) | 7 (4.5) | 0.01 |
| Educational level:≤high school | 90 (58.8) | 678 (45.4) | 96 (62.7) | −0.08 |
| Primary language: Spanish | 50 (32.7) | 289 (19.3) | 54 (35.4) | −0.06 |
| Employment status: full or part-time | 40 (26.1) | 592 (39.6) | 44 (28.9) | −0.06 |
| With income <100% FPL | 118 (77.1) | 962 (64.3) | 115 (74.9) | 0.05 |
| With ≥1 dependent in household | 87 (56.9) | 803 (53.7) | 85 (55.8) | 0.02 |
| With food insecurity | 111 (72.5) | 718 (48.0) | 108 (70.4) | 0.04 |
| With housing insecurity | 68 (44.4) | 458 (30.6) | 65 (42.4) | 0.04 |
| With both food and housing insecurity | 55 (35.9) | 307 (20.5) | 52 (34.3) | 0.04 |
| Used SNAP in past year | 117 (76.5) | 1083 (72.4) | 113 (74.0) | 0.06 |
| EHR-documented diagnoses | ||||
| Obesity (BMI ≥30) | 96 (62.7) | 866 (57.9) | 96 (63.0) | 0.00 |
| Depression | 84 (54.9) | 698 (46.7) | 84 (54.8) | 0.00 |
| Anxiety | 75 (49.0) | 666 (44.5) | 74 (48.5) | 0.01 |
| Hypertension | 56 (36.6) | 490 (32.8) | 55 (35.8) | 0.02 |
| Diabetes | 41 (26.8) | 276 (18.5) | 39 (25.7) | 0.03 |
| Other serious mental illness | 36 (23.5) | 394 (26.4) | 35 (22.9) | 0.01 |
| Cardiovascular disease | 11 (7.2) | 91 (6.1) | 10 (6.3) | 0.03 |
| HEI-2020 score <55 | 75 (49.0) | 789 (52.8) | 75 (49.2) | 0.00 |
| PSS score ≥15 | 123 (80.4) | 1090 (72.9) | 122 (79.8) | 0.01 |
| PHQ-8 score ≥10 | 86 (56.2) | 612 (40.9) | 82 (53.9) | 0.05 |
| GAD-7 score ≥10 | 82 (53.6) | 542 (36.3) | 83 (54.5) | 0.02 |
| No. of acute hospitalizations and ED visits in past year, mean (SD) | 0.12 (0.42) | 0.17 (0.89) | 0.12 (0.19) | 0.02 |
| Health center affiliation | ||||
| Center 1 | 21 (13.7) | 223 (14.9) | 19 (12.7) | 0.03 |
| Center 2 | 32 (20.9) | 298 (19.9) | 30 (19.3) | 0.04 |
| Center 3 | 36 (23.5) | 401 (26.8) | 36 (23.4) | 0.00 |
| Center 4 | 22 (14.4) | 315 (21.1) | 23 (15.1) | −0.02 |
| Center 5 | 42 (27.5) | 258 (17.3) | 45 (29.4) | −0.05 |
| Group and change category | FSP enrollment or comparison | Change | Difference in change | ||
|---|---|---|---|---|---|
| Before (time = 0) | After (time = 1 y) | ||||
|
| |||||
| FSP group (n = 150) | 73.33 (66.17 to 80.49) | 72.00 (64.73 to 79.27) | −1.33 (−9.04 to 6.37) | 4.96 (−3.13 to 13.05) | .37 |
| Non-FSP group (n = 1478) | 70.42 (68.09 to 72.75) | 64.13 (61.68 to 66.58) | −6.29 (−8.79 to −3.80) | ||
|
| |||||
| FSP group (n = 153) | 44.44 (36.48 to 52.41) | 40.52 (32.66 to 48.39) | −3.92 (−11.67 to 3.83) | 2.75 (−5.39 to 10.88) | .52 |
| Non-FSP group (n = 1492) | 42.11 (39.61 to 44.62) | 35.45 (33.02 to 37.88) | −6.67 (−9.16 to −4.17) | ||
|
| |||||
| FSP group (n = 149) | 55.38 (53.14 to 57.62) | 55.88 (53.43 to 58.32) | 0.50 (−1.91 to 2.91) | 0.48 (−2.04 to 3.00) | .72 |
| Non-FSP group (n = 1461) | 54.84 (54.12 to 55.57) | 54.86 (54.12 to 55.60) | 0.02 (−0.73 to 0.76) | ||
|
| |||||
| FSP group (n = 148) | 20.87 (19.64 to 22.09) | 20.63 (19.28 to 21.98) | −0.24 (−1.28 to 0.81) | 0.34 (−0.75 to 1.43) | .63 |
| Non-FSP group (n = 1459) | 20.80 (20.39 to 21.21) | 20.22 (19.82 to 20.62) | −0.58 (−0.91 to −0.24) | ||
|
| |||||
| FSP group (n = 153) | 0.12 (0.06 to 0.19) | 0.25 (0.13 to 0.36) | 0.12 (0.00 to 0.25) | 0.11 (−0.02 to 0.24) | .14 |
| Non-FSP group (n = 1495) | 0.12 (0.09 to 0.15) | 0.13 (0.11 to 0.16) | 0.01 (−0.02 to 0.04) | ||
| Themes | Subthemes | Representative quotes |
|---|---|---|
|
| ||
| Positive change | Relief of food insecurity while receiving services | “Even if for some people, they feel like it’s a little, but for me, it’s, I mean, plenty. Because, sometimes, you have to choose to buy some healthy food or just buy the basics and you cannot get enough fruit or vegetables because everything is going so expensive. So to have this benefit that at least you have a help to provide you with fruit and vegetables, for me, it’s a big, big, big help.” –Produce voucher recipient |
| Cost savings and convenience | “Every time I go to the grocery, I know I have that to help me. So it was really convenient.” –Produce voucher recipient | |
| Appreciation for assistance with filling out housing forms | “They were very good, very efficient. They guided me. They asked me questions like if I needed any help filling out the forms and stuff like that. So they were really good as far as getting the information from me.” –Housing services recipient | |
| Little or no change | High cost of food was a challenge despite services | “It’s not an amount that I say, ‘It’s going to cover me for a whole month and I’m not going to have to look for extra money to eat.’ But I have to put in extra money, because now the basic basket is very, very expensive.” –Produce voucher recipient |
| No improvement in housing situation | “What was positive? I thought I was going to get a house. [laughter] I didn’t get it. Still on the waiting list. And [daughter’s name] put all the application, and [SSO staff] says everything’s all set, and I got the letter saying, ‘Nice working with you.’ [laughter] I’m like, ‘Okay.’” –Housing services recipient | |
|
| ||
| Positive change | Increased fruit and vegetable intake | “Before we consumed more rice and more junk food, food like that, from outside the home. Now, at least, we rush to make homemade food a little more, because always, if we have vegetables in the house, we only need to prepare a meat, and with that we at least complete the meal. Or we eat more fruit, and it is healthier.” –Produce voucher recipient |
| Sustained improvement in diet | “We also kind of got—I got used to the meals. So now, I do [meal delivery program]. So we pay for that, but it was a similar idea where it’s prepackaged. It just helps my life better. That’s what we have all week for dinner. And at work, I make sure to bring my lunch. And I was healthy and lost like over 60 pounds, not just in that time frame alone, but over the course. So it was really helpful.” –Medically tailored meal recipient | |
| Little or no change | No change in diet | “More or less one ate the same, the diet and everything else.” –Food box recipient |
| Return to prior diet pattern after services ended | “Yeah. I’ve just been very depressed. I mean, I don’t think I’ve gotten fruit [laughter] or a salad. I just don’t buy anything anymore.” –Produce voucher recipient | |
|
| ||
| Positive change | Reduced stress due to nutrition services | “It takes the stress off of me worrying about having enough for this and for that. So yeah, absolutely. I mean, having that and knowing I can get fruits and vegetables? Yeah. That definitely takes off the stress for me.” –Produce voucher recipient |
| Reduced stress due to assistance with housing forms | “Yeah. Working with them, yeah. It’s still a stressful situation, but working with them definitely made it feel that there was hope. There’s a light at the end of the dark road, I guess you could say.” –Housing services recipient | |
| Negative change | Increased stress due to housing services | “But it seems like he gave me the brushoff. That’s how I feel. It’s really stressful. I had my hopes up for him putting me in a right direction and doing his job, but he really stressed me out with the job.” –Housing services recipient |
| Frustration from difficulties connecting with housing services | “I mean, when I met with her, I did fill out some stuff and signed some stuff. And after that, she said she would be in touch. She was in touch with me. Called me several occasions and we were supposed to meet up again to fill out some referrals or something like that, but it just never happened because it never—it never happened. And at the time, I was homeless. You know what I mean? Sleeping on my truck.” –Housing services recipient | |
|
| ||
| Positive change | Improved health due to increased fruit and vegetable intake | “In terms of my health, yes, with respect to that, I have had a lot of changes because I use a lot of vegetables and make a lot of green juices. I had high cholesterol and high triglycerides and through those juices, which I am making through this help, they have gone away. I have my health now that I no longer have high cholesterol or high triglycerides, it is normal thanks to God and [produce voucher service].” –Produce voucher recipient |
| Improved health due to establishing healthier diet pattern | “I would have never tried certain squashes, but yet I tried it with them. It gave me a better taste of vegetables, and in the long run that worked for me and my diabetes. It made me eat more vegetables than I had before in my life. Like brussels sprouts, I would have never ate them, if I didn’t get them in the box. And so in the long run, my diabetes was much more healthier and much more manageable.” –Food box recipient | |
| Little or no change | No improvement in mental health | “Mental health, I’m the same really. I’m the same. I mean, food’s not really going to take—I mean, well, money-wise, it helps me not worry about—I always have something to eat, you know what I mean? But other than that, my mental health is the same pretty much.” –Produce voucher recipient |
| More tailored food options needed for specific health conditions | “It was supposed to help me lower my sugar and stuff. But the stuff they were giving me still was unhealthy, like legumes and other stuff, like beans. It wasn’t really towards the diabetic aspect of my life. It never lowered my sugar. It never helped anything. Because a lot of it was lentils and curries and beans and stuff like that. So it was meant to help me with my diabetes and manage my diabetes, but it didn’t.” –Medically tailored meal recipient | |
Peer Reviews
No public reviews on file for this paper yet. If you reviewed it on a platform where reviews are public (OpenReview, ICLR, NeurIPS, ICML), you can paste yours below so the community can read it here.
Videos
No videos yet. Explain this paper in a talk, walkthrough, or lecture? Add one.
Taxonomy
TopicsFood Security and Health in Diverse Populations · Homelessness and Social Issues · Geriatric Care and Nursing Homes
Introduction
Health-related social needs, such as food and housing insecurity, are associated with chronic disease, high health care costs, and health disparities.^1,2,3^ With increasing focus on value-based care and health equity, health systems have invested billions of dollars into social needs programs.^4,5^ As of October 2024, 21 states had received Medicaid Section 1115 waivers to conduct demonstration or pilot projects focused on health-related social needs.^6^ Still, little is known about whether programs are associated with improved key social, behavioral, and clinical outcomes.^7^
Prior studies of health care–based social needs programs have had mixed results. Most were uncontrolled, pre-post studies with limited ability to account for secular trends.^8,9,10^ Data from larger randomized and controlled studies, however, suggest limited impact.^11,12,13,14^ For example, in the Centers for Medicare and Medicaid Services Accountable Health Communities Model, several thousand participants were randomized to navigation services and resource referral or to referral only.^11^ Interim analyses demonstrated the intervention group had fewer emergency department (ED) visits but no differences in hospitalizations, total spending per beneficiary, use of community services, or resolution of social needs.^12,13^ In a California Medicaid housing program study, 845 adults receiving a 1-time rental housing deposit had no change in 6-month health care use compared with matched controls.^14^
Few studies have evaluated the implications of health-related social needs interventions for behavioral outcomes, such as diet and stress, which are mediators of chronic disease.^15,16^ Randomized trials of medically tailored meals and pre-post evaluations of produce prescriptions have demonstrated some dietary improvement.^17,18,19,20,21,22,23^ Although small studies have reported that medical-legal partnerships were associated with decreased stress,^24,25^ a randomized trial of a health care community resource referral intervention demonstrated no improvement in mental health–related quality of life.^26^
As part of a Section 1115 waiver, Massachusetts Medicaid (MassHealth) implemented the Flexible Services program (FSP) in 2020 to address food and housing insecurity among accountable care organization (ACO) beneficiaries.^27^ MassHealth provided $149 million statewide across 17 ACOs to deliver FSP; most of the funding went toward payments from ACOs to social service organizations (SSOs). The program was not a benefit or covered service, and not all FSP-eligible beneficiaries could participate. An interim evaluation of FSP in the Mass General Brigham (MGB) ACO demonstrated several implementation barriers, and only 1.6% of adult beneficiaries were enrolled.^27^ A recent study using administrative data from 20 403 MassHealth FSP nutrition services participants compared with 2108 beneficiaries who were referred but not enrolled found that FSP was associated with decreased hospitalizations and ED visits.^28^
This study, LiveWell/ViveBien, prospectively enrolled adult MGB ACO beneficiaries prior to FSP participation and followed up participants for 3 years. The objective was to compare 1-year changes in food and housing insecurity, diet, stress, and acute health care use between participants who were enrolled in FSP and propensity score–weighted study participants who were eligible but not enrolled in FSP (hereafter non–FSP participants). Qualitative interviews with participants enrolled in FSP provided beneficiaries’ perspectives on FSP outcomes.
Methods
Study Design
LiveWell/ViveBien was a prospective cohort study of adults in the MGB Medicaid ACO. Study participants were enrolled between December 2019 and December 2020, prior to FSP enrollment, and were followed up for 3 years. Study participants who were enrolled in FSP during the study were compared with propensity score–weighted study participants who were not enrolled. The MGB Institutional Review Board approved all study procedures on August 27, 2019. Study participants provided verbal informed consent, and interviewees provided consent for use of their interview content. We followed the Strengthening the Reporting of Observational Studies in Epidemiology (STROBE) reporting guideline.
Participants
Study participants were adults receiving care at 5 community health centers in greater Boston that are affiliated with Massachusetts General Hospital and Brigham and Women’s Hospital. Participants were enrolled in FSP in person and by telephone. To be eligible, an individual had to be a member in the MGB ACO, be 21 to 62 years of age, speak English or Spanish, and have had 2 or more health center visits in the prior 2 years.
FSP
MassHealth ACOs independently contracted with SSOs to provide nutrition and housing–related services to referred patients. To be eligible for FSP enrollment, individuals needed to be ACO members with food or housing insecurity identified by screening or clinical encounter and meet at least 1 health criterion, including complex physical health need (eg, uncontrolled hypertension), complex behavioral health need (eg, uncontrolled depression), high ED use (ie, ≥2 visits in 6 months or 4 visits in 1 year), and high-risk pregnancy. The ACO referred FSP enrollees to SSOs. Initial enrollment duration was typically 6 months; individuals could be re-enrolled in nutrition services by ACO staff if needed. Nutrition SSOs provided supermarket produce vouchers, food boxes, medically tailored meals, and nutrition education. Housing SSOs provided pretenancy and posttenancy support, including assistance with housing applications, searches, and legal support. The MGB ACO began FSP enrollment in March 2020.^27^
Measures and Outcomes
Study participants completed a survey and 2 Automated Self-Administered 24-hour (ASA24) Dietary Assessment Tool recalls^29^ at enrollment (baseline) and 3 annual follow-ups, either online or by telephone. The survey questions asked about demographics (including race and ethnicity), social needs, mental health, and health behaviors. Race and ethnicity were self-identified on study surveys and included the categories Hispanic, non-Hispanic Black, non-Hispanic White, and other (including American Indian or Alaska Native, Asian, Native Hawaiian or Pacific Islander, multiracial, and other race [not defined]). Race and ethnicity data were included in analyses to account for cultural preferences and norms that may have affected study outcomes, including experience of social needs and stress, dietary intake, and acute health care use. Diagnoses and health care use were collected from electronic health record (EHR) and claims data. Enrollment in FSP was determined using data from the EHR, health system and SSO data-sharing platform, and ACO quarterly reports.
Primary outcomes were 1-year changes in food and housing insecurity, stress, dietary quality, and acute health care use. Secondary outcomes were changes in depression and anxiety symptoms. Food insecurity was assessed with the 10-item US Department of Agriculture Food Security Scale Module (score range: 0-10), which was dichotomized so that a score of 3 or higher (low or very low food security) indicated food insecurity. Housing insecurity was ascertained from agreement with at least 1 of 3 questions: currently does not have own housing, moved 2 or more times in the past year, and worried about losing housing in the next 2 months. Stress was assessed with the 10-item Perceived Stress Scale (PSS; score range: 0-40, with ≥14 indicating moderate to severe stress).^30^ Depression and anxiety symptoms were assessed using the 8-item Patient Health Questionnaire Depression Scale (PHQ-8; score range: 0-24, with ≥10 indicating moderate to severe depressive symptoms) and the 7-item Generalized Anxiety Disorder (GAD-7; score range: 0-21, with ≥10 indicating moderate to severe anxiety symptoms).^31,32^ Dietary quality measured with the Healthy Eating Index-2020 (HEI-2020; score range: 0-100, with higher scores indicating healthier diet quality)^33^ was calculated for each time point using ASA24 dietary recalls. Higher HEI-2020 total score indicates a healthier diet, and the total score is made up of 9 adequacy (eg, total vegetables) and 4 moderation component (eg, sodium) scores for food groups and nutrients. The mean number of acute health care visits in the prior 12 months, including ED visits and unplanned hospitalizations (excluding normal pregnancy, planned surgeries, and rehabilitation stays), was assessed at each time point.
Analytic Sample
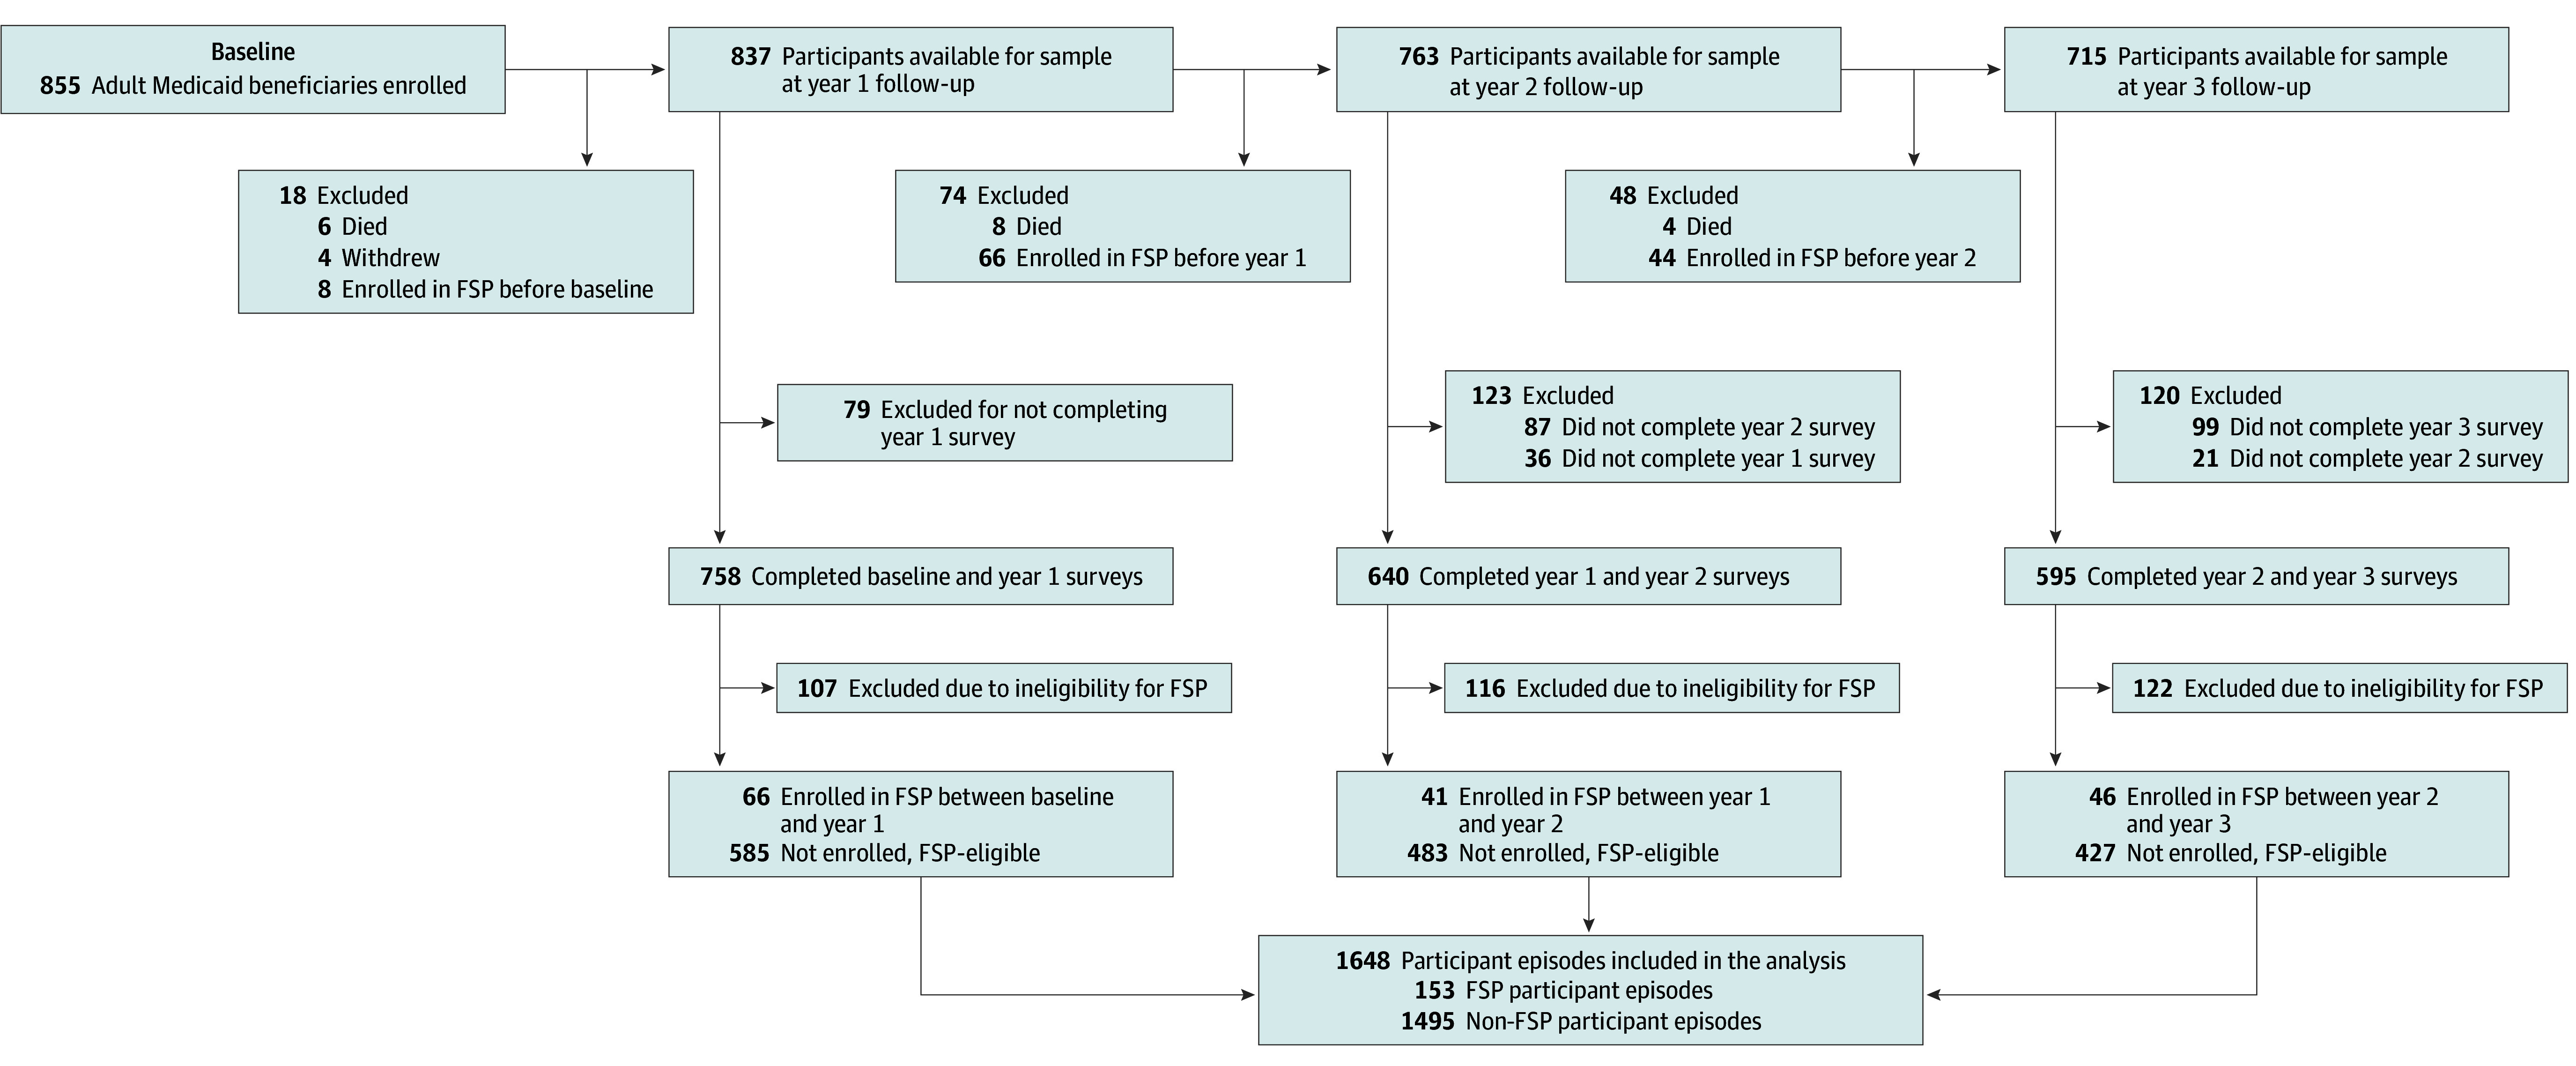
The analytic sample included LiveWell/ViveBien study participants enrolled in FSP and FSP-eligible ACO members with eligible diagnosis not enrolled in FSP (Figure). To be included in the sample, FSP participants had to have completed a survey in the year prior to their enrollment (time 0), completed a survey at the subsequent 12-month follow-up (time 1), and been enrolled in FSP between time 0 and time 1. For example, a participant who was enrolled in FSP after completing their baseline survey but before completing their 1-year follow-up survey would be included in the sample if they had completed both the baseline and 1-year surveys; if this participant did not complete a 1-year survey, they would be excluded. Only the first FSP enrollment per participant was included.
Study Flow Diagram of Participants Included in the Flexible Services Program (FSP) and Non-FSP Groups in the Analytic SampleFSP-eligible indicates a participant in the Medicaid accountable care organization, with food or housing insecurity, and with a diagnosis that would fulfill criteria for program enrollment.
To be included in the sample as a non–FSP participant, an individual had to have never been enrolled in FSP, have been FSP-eligible in the 12 months prior to time 1 (confirmed Medicaid ACO insurance, prior 12-month food or housing insecurity based on time 1 survey questions, and FSP-eligible diagnosis documented in the EHR during the prior 12 months), and have completed surveys at both time 0 and time 1. Non–FSP participants included at one time 1 could be included in future follow-up time points, either as a new FSP participant or again as a non–FSP participant.
Qualitative Interviews and Thematic Analysis
Study participants who provided qualitative interviews were current or prior FSP participants, purposively sampled so that their range of characteristics (sex, race and ethnicity, primary language, health center affiliation, and service type [nutrition, housing]) reflected the overall study cohort. Interviews were conducted in English or Spanish using a semistructured interview guide that included questions about perceived effectiveness of FSP in addressing food or housing needs, diet, stress, and health. Interviews were conducted by telephone, audiorecorded, transcribed, coded deductively using Dedoose software, version 9.0 (SocioCultural Research Consultants LLC), and analyzed (using the Framework Method for structured thematic analysis).^34^ Three trained research assistants (2 of whom were bilingual) coded all transcripts, and a PhD-level researcher (J.L.M.) resolved discrepancies. Saturation was determined when novel themes no longer emerged. Themes and results were reviewed with the research team to ensure face validity.
Statistical Analysis
Propensity score weighting was used to balance the non-FSP group against the FSP group based on calendar year and sociodemographic and clinical characteristics at time 0, collected from surveys, dietary recalls, EHR, and claims.^35^ Standardized mean differences were used to measure the balance of individual covariates after weighting. The FSP and weighted non-FSP groups were compared on 1-year changes (time 0 to time 1) by testing the time-by-group interactions in logistic regression models for the proportion of participants with food insecurity and the proportion of participants with housing insecurity; in linear regression models for HEI-2020, PSS, PHQ-8, and GAD-7 scores; and in Poisson models for ED visits and hospitalizations. Generalized estimating equations were used to account for repeated measures from the same participants at multiple time points.
Three sensitivity analyses were conducted. The sample for the first sensitivity analysis was limited to FSP participants receiving nutrition services, enabling an assessment of whether changes in outcomes were greater after excluding those who received only housing services. The second sensitivity analysis sample was limited to current FSP participants in nutrition services at time 1, allowing an assessment of whether changes in outcomes were greater when individuals were actively receiving services in contrast to the first sensitivity analysis that included both participants actively receiving and recently completing services. The third sensitivity analysis sample was limited to FSP participants who had participated in the program for 6 months or longer at time 1. Radar plots were used for visual analysis of HEI-2020 component scores at time 0 and time 1 for FSP participants in nutrition services and non–FSP participants.
The original power calculation assumed 280 participants would receive FSP and 120 would be FSP-eligible but not receive FSP, resulting in 97% power for detecting a mean difference of 5 in HEI-2020 scores, 81% power for detecting a mean difference of 0.25 in acute health care use, and 85% power to detect a standardized effect size of 0.25 for other continuous outcomes. In post hoc power calculations with a sample size of 153 in each group, power was greater than 80% to detect a 16% difference in dichotomized outcomes, 83% for detecting a mean difference of 5 in HEI-2020 scores, 80% for detecting a mean difference of 0.26 in acute health care use, and 80% to detect a standardized effect size of 0.32 for other continuous outcomes.
Two-sided P < .05 were considered statistically significant. All data analyses were conducted from August 2024 to April 2025 using SAS, version 9.4 (SAS Institute).
Results
A total of 153 FSP participant episodes (representing 153 study participants) and 1495 non–FSP participant episodes (610 unique study participants) were included in the sample (Figure). Among 153 FSP participants, 137 (89.5%) enrolled in nutrition and 16 (10.5%) enrolled in housing services (Table 1). The mean (SD) number of months of FSP enrollment was 5.7 (2.9). The most common diagnoses documented on FSP enrollment forms were obesity (88 [57.5%]), depression (42 [27.5%]), and anxiety (28 [18.3%]).
These FSP participants had a mean (SD) age of 43.6 (10.8) years and included 129 females (84.3%) and 24 males (15.7%), of whom 100 (65.4%) self-identified as Hispanic, 11 (7.2%) as non-Hispanic Black, 34 (22.2%) as non-Hispanic White, and 8 (5.2%) as other individuals (Table 2). Prior to FSP participation (time 0), 111 (72.5%) had food insecurity, 68 (44.4%) had housing insecurity, and 55 (35.9%) had both. Of the 610 participants from whom data were obtained for the 1495 non–FSP participant episodes included in the study, 464 (76.1%) were female, 145 (23.8%) were male, and 1 (0.01%) was unknown. Three hundred and eight patients (50.5%) self identified as Hispanic; 57 (9.3%) as non-Hispanic Black; 211 (34.6%) as non-Hispanic White; and 34 (23.4%) as other individuals. The mean (SD) age was 43.2 (11.2) years. After propensity score weighting, the FSP and non-FSP groups had standardized mean differences for all characteristics of 0.08 or lower.
Main Outcomes
There was no significant change in the proportion of FSP participants with food insecurity (−1.33%; 95% CI, −9.04% to 6.37%), but there was a decrease in the proportion of non–FSP participants with food insecurity (−6.29%; 95% CI, −8.79% to −3.80%); the difference in changes between groups was 4.96% (95% CI, −3.13% to 13.05%) (Table 3). Results were similar for housing insecurity, with a difference in change of 2.75% (95% CI, −5.39% to 10.88%). Similarly, there were no differences in changes between groups for HEI-2020 scores, PSS scores, and acute hospitalizations and ED visits (Table 3). There were no differences in changes between groups for PHQ-8 and GAD-7 scores (eTable 1 in Supplement 1).
Sensitivity Analyses
In sensitivity analyses restricted to participants enrolled in nutrition services between time 0 and time 1 (n = 137), participants currently receiving nutrition services at time 1 (n = 117, excluding those who had completed nutrition services), and participants who had participated in FSP for 6 months or longer at time 1 (n = 72), the results were similar to those in main analyses (eTables 2, 3, and 4 in Supplement 1). Radar plots of HEI-2020 component scores showed similar patterns for FSP and non-FSP nutrition participants (eFigures 1 and 2 in Supplement 1).
Qualitative Findings
Interviews were conducted with 27 FSP participants. The themes that emerged from these interviews reflected participants’ mixed experiences; representative quotes are included in Table 4. While some participants expressed relief in food insecurity while receiving nutrition services, others emphasized that the high cost of food was challenging even while receiving services. Participants expressed appreciation for help filling out housing forms but also disappointment with long wait times and limited housing availability. Many nutrition services participants described increased fruit and vegetable intake, but others experienced no dietary changes or returned to less healthy dietary patterns after services ended. Stress often decreased while receiving services, but some participants described increased stress related to difficulties communicating with the SSO’s housing staff. Some participants attributed improvements in their health, such as diabetes and cholesterol control, to FSP, but others suggested that food options should be more tailored to specific health conditions, such as diabetes.
Discussion
In this prospective cohort of adults from 1 Medicaid ACO, FSP participation was not associated with 1-year changes in quantitative measures of social needs, dietary quality, stress, and acute health care use. Qualitative interviews provided more nuanced perspectives of program effectiveness, with many FSP participants endorsing favorable changes in food insecurity, diet, stress, and health and other participants expressing frustration with, barriers to, and lack of effectiveness of services. The wide range of individual FSP experiences helps to contextualize the null quantitative findings of outcomes averaged across participants.
Most LiveWell/ViveBien study participants had incomes at or below the federal poverty level and were experiencing food or housing insecurity. Given the shortage of affordable housing in Massachusetts,^36^ it is not surprising that FSP was not associated with reduced housing insecurity in the short-term. Interviews revealed that many participants were disappointed and stressed regarding their stagnant housing situation and had difficulty communicating with the housing staff of the SSO. It was, however, unexpected that FSP was not associated with reduced food insecurity. Several prior studies of medically tailored meals or groceries and produce prescriptions have demonstrated reductions in food insecurity,^17,18,20,21,22,37,38,39^ although most had a pre-post design with no comparator.^40^ Interviews with FSP participants revealed factors that may have contributed to the lack of association, especially the high cost of food. Temporary FSP nutrition services were likely not sufficient to resolve food insecurity in the context of steep increases in food prices between 2020 and 2023.^41^ The inability to afford enough food, including healthy food, may also explain the lack of dietary benefits associated with FSP.
Despite evidence that health-related social needs are associated with stress and depressive symptoms,^42,43,44,45,46,47^ few intervention studies measure mental health.^40^ In the LiveWell/ViveBien study, participants had moderately high stress, depression, and anxiety symptoms at baseline, which did not change with FSP. Some FSP participants described how services helped relieve stress, but others revealed their stress was the same or worse. It is likely that participants’ mental health symptoms also had multiple other contributing factors, including preexisting mental health conditions and economic and social factors.
The lack of association between FSP and improved social needs, diet, and stress may partially explain the lack of change in acute health care use. This finding is consistent with some prior studies, including assessments of the Accountable Health Communities Model and the California Medicaid housing program.^13,14,48,49^ An evaluation of 16 health-related social needs pilot programs under California’s Medicaid 1115 waiver found that most were associated with reduced ED visits but not hospitalizations.^48^ Results of the current study differ from findings of an analysis of 17 ACOs that FSP was associated with decreased hospitalizations and ED visits^28^; this discrepancy may be partially explained by differences in how hospitalizations and ED visits (ie, types and periods assessed) and non-FSP comparison groups were defined.
Limitations
Despite using propensity score weighting and incorporating a wide range of observable social, demographic, and clinical factors, it is possible there was unmeasured confounding, including the potential selection of higher-need ACO beneficiaries into the program. Surveys were not timed precisely around FSP receipt, and 1-year follow-up may have occurred during or just after FSP participation. However, sensitivity analyses of participants currently receiving nutrition services showed no changes associated with FSP. It is also possible that the approximate 6-month exposure was not sufficient for the program benefits to accrue. The study was conducted during the COVID-19 public health emergency, and implementation of other policy changes, including increased Supplemental Nutrition Assistance Program benefits and a housing eviction moratorium,^50,51,52^ may have played a role in the reduced relative benefit of FSP. However, to address time-varying policies and changing COVID-19 pandemic conditions during the study period, propensity weighting balanced the non-FSP and FSP groups on calendar time. It is possible that these policies and other socioeconomic factors may have had larger implications for nonparticipants than participants. The FSP participants in this study were comparable to all MGB ACO FSP enrollees,^27^ but participant characteristics and outcomes may have been different in other ACOs.
Conclusions
In this cohort study, while a lack of favorable changes in measures of social needs, diet, stress, and health care suggests that FSP might not have met policy objectives, participant interviews demonstrated a range of individual experiences, including improvements in diet, stress, and health as well as challenges in overcoming entrenched social needs. Multisector collaborations, such as FSP, that address only specific needs may have limited effectiveness because they are downstream from the social, political, and economic factors of poor health and health inequities.^53^ Findings of this study underscore the need for ongoing rigorous evaluation of Medicaid and other health system–based social needs interventions to inform future programs.
The reference list from the paper itself. Each links out to its DOI / PubMed record.
- 1Braveman P, Egerter S, Williams DR. The social determinants of health: coming of age. Annu Rev Public Health. 2011;32:381-398. doi:10.1146/annurev-publhealth-031210-10121821091195 · doi ↗ · pubmed ↗
- 2Dzau VJ, Mc Clellan MB, Mc Ginnis JM, . Vital directions for health and health care: priorities from a National Academy of Medicine Initiative. JAMA. 2017;317(14):1461-1470. doi:10.1001/jama.2017.196428324029 · doi ↗ · pubmed ↗
- 3National Academies of Sciences, Engineering, and Medicine. Integrating Social Care into the Delivery of Health Care: Moving Upstream to Improve the Nation’s Health. National Academies Press; 2019.31940159 · pubmed ↗
- 4Horwitz LI, Chang C, Arcilla HN, Knickman JR. Quantifying Health Systems’ investment in social determinants of health, by sector, 2017-19. Health Aff (Millwood). 2020;39(2):192-198. doi:10.1377/hlthaff.2019.0124632011928 · doi ↗ · pubmed ↗
- 5Glied S, D’Aunno T. Health systems and social services-a bridge too far? JAMA Health Forum. 2023;4(8):e 233445. doi:10.1001/jamahealthforum.2023.344537589971 · doi ↗ · pubmed ↗
- 6KFF. Approved and pending section 1115 waivers by state. October 2024. Accessed October 14, 2024. https://www.kff.org/medicaid/issue-brief/medicaid-waiver-tracker-approved-and-pending-section-1115-waivers-by-state/#Table 4
- 7Baicker K, Mc Connell M. Tying innovation to evaluation and accountability in programs to address intersecting health and social needs. JAMA Health Forum. 2022;3(10):e 224323. doi:10.1001/jamahealthforum.2022.432336218904 · doi ↗ · pubmed ↗
- 8Eder M, Henninger M, Durbin S, . Screening and interventions for social risk factors: technical brief to support the US Preventive Services Task Force. JAMA. 2021;326(14):1416-1428. doi:10.1001/jama.2021.1282534468710 · doi ↗ · pubmed ↗