The foraging gene coordinates brain and heart networks to modulate socially cued interval timing in Drosophila
Hongyu Miao, Wengjing Li, Yongwen Huang, Woo Jae Kim, Mariana Federica Wolfner, Monica Colaiácovo, Mariana Federica Wolfner, Monica Colaiácovo, Mariana Federica Wolfner, Monica Colaiácovo

TL;DR
The foraging gene in fruit flies affects mating duration by coordinating brain and heart activity, showing how genes can influence behavior through multiple systems.
Contribution
The study reveals a novel role of the foraging gene in integrating social cues with physiological states via neural and non-neural mechanisms.
Findings
The rover and sitter alleles of the foraging gene disrupt different mating duration behaviors in fruit flies.
Foraging gene expression in Pdfr-positive neurons and fru-positive heart cells is critical for longer mating duration.
Social context influences heart cell calcium dynamics, which are disrupted by foraging gene or Pdfr knockdown.
Abstract
The foraging gene (for) regulates behavioral plasticity and decision-making, influencing adaptive behaviors such as foraging, learning, and memory. In Drosophila melanogaster, we explore its role in interval timing behaviors, particularly mating duration. Two allelic variants, rover (forR) and sitter (forS), exhibit distinct effects: forR disrupts shorter mating duration (SMD) but not longer mating duration (LMD), while forS impairs LMD but not SMD. Transheterozygotes (forR/forS) disrupt both behaviors, revealing complex allelic interactions. Using single-cell RNA sequencing and knockdown experiments, we identify foraging expression in Pdfr-positive neurons and fru-positive heart cells as critical for LMD. While the gene is expressed in memory-related brain regions, its impact on LMD is mediated through peptidergic signaling and calcium dynamics in the heart. Social context-dependent…
Genes, proteins, chemicals, diseases, species, mutations and cell lines named across the full text — each resolved to its canonical identifier and authoritative record.
Click any figure to enlarge with its caption.
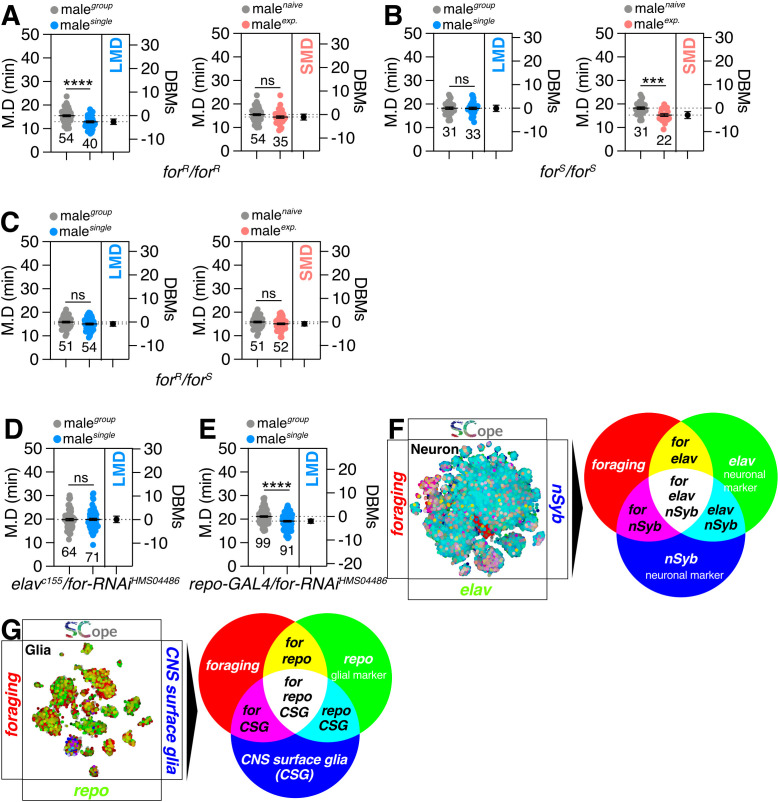 Fig 1
Fig 1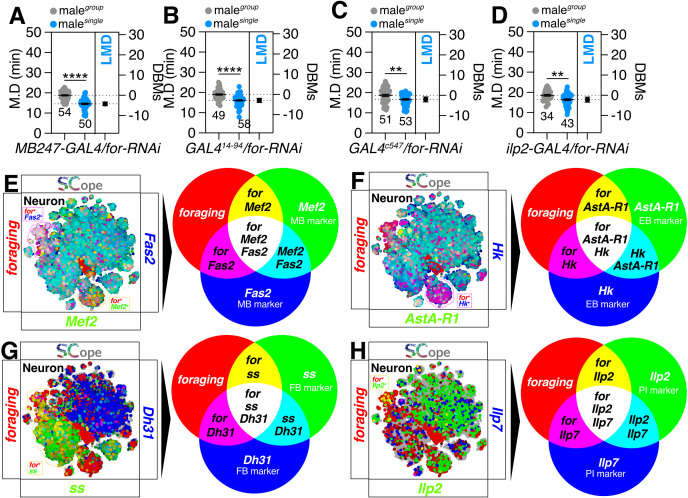 Fig 2
Fig 2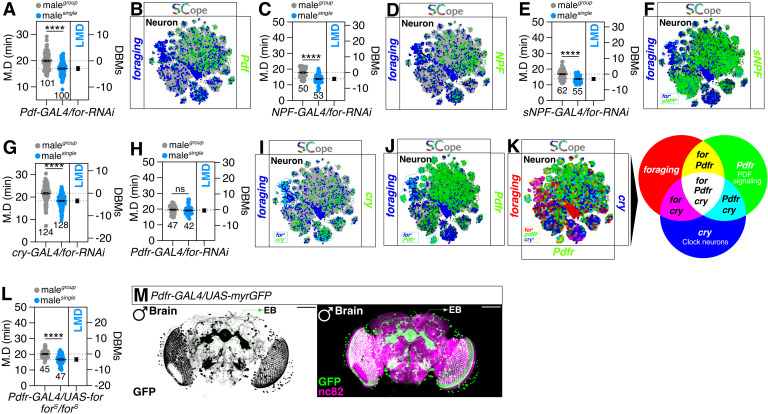 Fig 3
Fig 3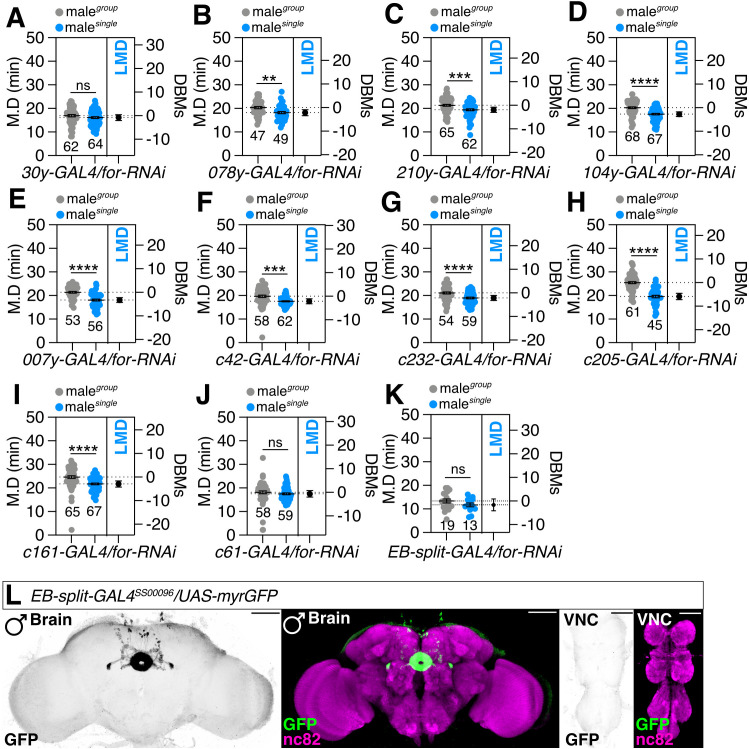 Fig 4
Fig 4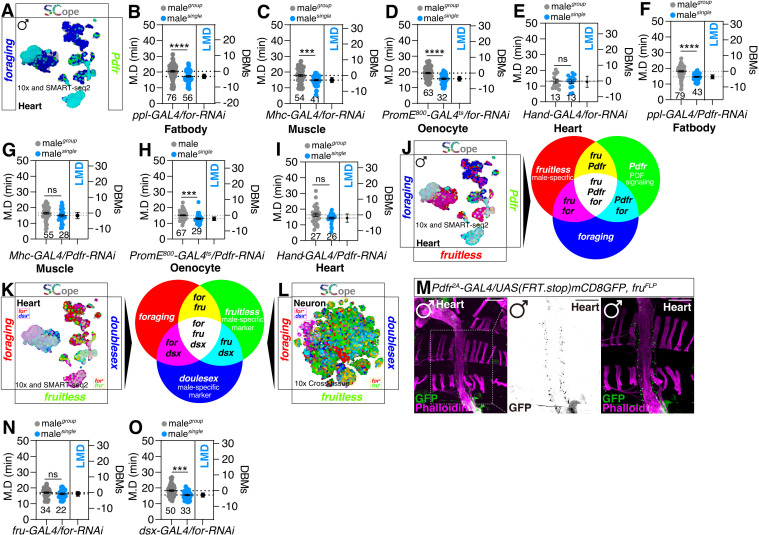 Fig 5
Fig 5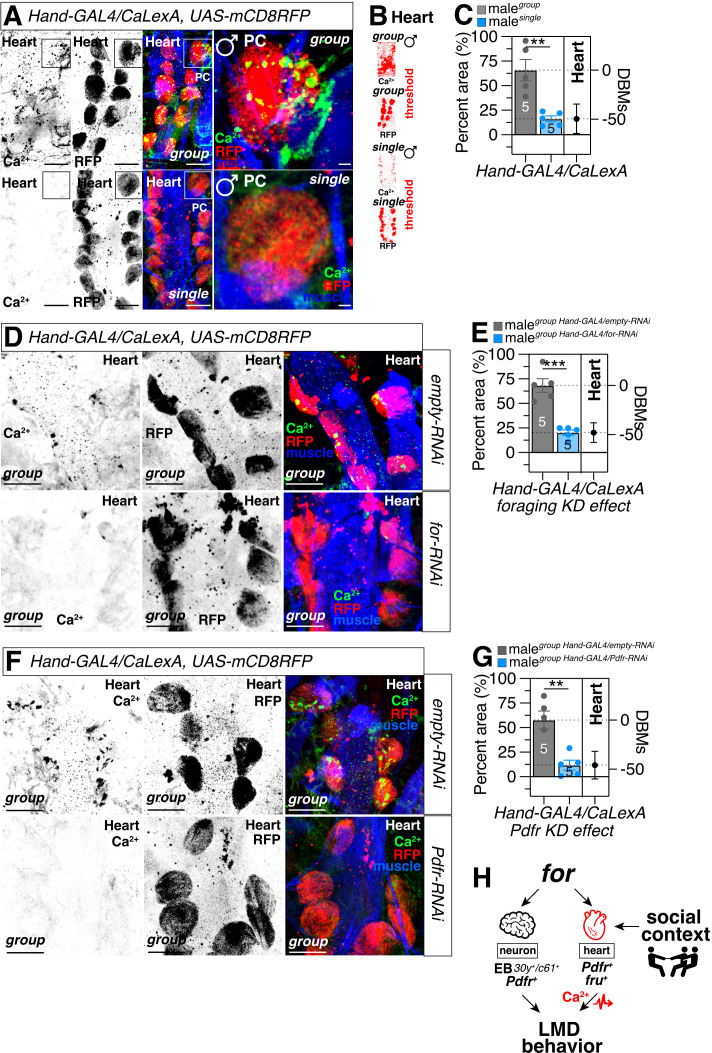 Fig 6
Fig 6- —http://dx.doi.org/10.13039/100008572University of Ottawa
- —http://dx.doi.org/10.13039/501100003472Harbin Institute of Technology
- —http://dx.doi.org/10.13039/100008572University of Ottawa
- —http://dx.doi.org/10.13039/100008572University of Ottawa
- —http://dx.doi.org/10.13039/501100000038Natural Sciences and Engineering Research Council of Canada
- —http://dx.doi.org/10.13039/100008572University of Ottawa
- —http://dx.doi.org/10.13039/501100004489Mitacs
- —Brain Pool Program of the National Research Foundation in Korea
- —http://dx.doi.org/10.13039/100000861Burroughs Wellcome Fund
- —NVIDIA Academic Hardware Grant Program
Peer Reviews
No public reviews on file for this paper yet. If you reviewed it on a platform where reviews are public (OpenReview, ICLR, NeurIPS, ICML), you can paste yours below so the community can read it here.
Videos
No videos yet. Explain this paper in a talk, walkthrough, or lecture? Add one.
Taxonomy
TopicsNeurobiology and Insect Physiology Research · Animal Behavior and Reproduction · Plant Molecular Biology Research
Introduction
The foraging gene (for) has emerged as a pivotal factor in the regulation of behavioral plasticity and decision-making processes across various species, including the fruit fly Drosophila melanogaster [1,2] and honeybee [3]. This gene plays a crucial role in shaping an organism’s foraging strategies by influencing traits such as olfactory learning and memory [4–10]. The study of the foraging gene has provided valuable insights into the complex interplay between genetics and behavior, highlighting its significance in understanding the adaptive behaviors of organisms in response to their environment [3,6].
Interval timing behaviors, the ability to measure and respond to the passage of time, are integral to various aspects of an organism’s life, including foraging, mating, and social interactions [11,12]. These behaviors are thought to be mediated by neural circuits that are conserved across species [13]. In recent years, researchers have discovered a remarkable connection between interval timing behaviors and social behaviors, suggesting a shared neural and genetic basis [14].
The mating duration (MD) of male fruit flies, Drosophila melanogaster, serves as an excellent model for studying interval timing behaviors. In Drosophila, two notable interval timing behaviors related to mating duration have been identified: Longer-Mating-Duration (LMD), which is observed when males are in the presence of competitors and extends their mating duration [15–17] and Shorter-Mating-Duration (SMD), which is characterized by a reduction in mating time and is exhibited by sexually experienced males [18,19]. The MD of male fruit flies serves as an excellent model for studying interval timing, a process that can be modulated by internal states and environmental contexts. Previous studies by our group [15,16,19–22] and others [23–26] have established robust frameworks for investigating MD using advanced genetic tools, enabling the dissection of neural circuits and molecular mechanisms that govern interval timing.
The foraging gene emerged as a strong candidate for regulating LMD due to its well-documented role in behavioral plasticity and decision-making processes [6,27,28]. The foraging gene encodes a cGMP-dependent protein kinase (PKG), which has been implicated in modulating foraging behavior, aggression, and other context-dependent behaviors in Drosophila. Its involvement in these processes suggests a potential role in integrating environmental cues and internal states to regulate interval timing, such as LMD. Furthermore, the molecular mechanisms underlying interval timing have been explored in other contexts, such as the work of the Crickmore et al. [29], which has demonstrated the critical role of CREB (cAMP response element-binding protein) in regulating behavioral timing and plasticity. CREB-dependent signaling pathways, along with other molecular players like PKG, provide a broader framework for understanding how interval timing is orchestrated at the neural and molecular levels [23–26,30,31]. By investigating foraging in the context of LMD, we aim to uncover how specific genetic and neural mechanisms fine-tune interval timing in response to social and environmental cues, contributing to a deeper understanding of the principles governing behavioral adaptation.
MD represents a critical investment of time for male reproductive success, highlighting its significance as a model for investigating interval timing. This parameter offers a valuable opportunity to explore the evolutionary and physiological roles of genes involved in this complex behavior [32]. From an evolutionary perspective, the ability to accurately regulate mating duration allows males to maximize their reproductive output by optimizing their investment of time and energy. This time investment strategy is crucial for competing with other males and ensuring successful fertilization of female eggs [19]. Physiologically, mating duration is influenced by a complex interplay of neural circuits, hormonal signals, and sensory inputs. Understanding the genes and mechanisms underlying this behavior can provide valuable insights into the neural substrates of interval timing and the regulation of reproductive behaviors [15,16,18,19,33–35].
The MD of male fruit flies is highly dependent on gene-environment interactions, making it a promising candidate to be regulated by the foraging gene function [15,16,19]. The foraging gene, known for its role in mediating behavioral plasticity and decision-making processes, is likely to influence mating duration by modulating the fly’s response to environmental cues and social context. For instance, in the presence of competitors, the foraging gene may upregulate MD (LMD) to enhance reproductive success, while in situations of sexual satiation, it may downregulate MD (SMD) to conserve energy and resources. By examining the expression and function of the foraging gene in relation to MD, we can gain valuable insights into the intricate interplay between genetics, behavior, and environmental factors in Drosophila.
In this study, we demonstrate that genes traditionally associated with foraging behavior are also involved in interval timing, a cognitive process crucial for decision-making and behavior [12,36]. This discovery challenges the assumption that these genes are solely dedicated to optimizing foraging strategies and suggests a broader role for these genes in regulating time perception and behavior across various contexts [13,37]. Our findings indicate that the interplay between foraging genes and interval timing circuits may be crucial for animals to adapt their behavior to changing environmental conditions and maximize their overall fitness. This suggests that the evolution of interval timing and foraging behaviors might be more interconnected than previously thought [38,39].
Understanding the mechanisms by which foraging genes influence interval timing can provide valuable insights into the neural and genetic basis of time perception and decision-making. This knowledge has the potential to contribute to our understanding of various behaviors, including foraging, learning, and memory, and their adaptive significance in different ecological contexts.
Results
Two distinct foraging allele, rover and sitter affect distinct interval timing behaviors
The foraging gene in Drosophila gives rise to two distinct phenotypes known as rover (for^R^) and sitter (for^S^), which exhibit natural variations in foraging behavior. Rover larvae cover larger areas within food patches and greater movement between patches than sitters. Rover larvae and adults are more active than their sitter counterparts. This behavioral variation is primarily due to allelic differences in the foraging gene, which is located on the second chromosome and encodes a cGMP-dependent protein kinase (PKG). Natural rover (for^R^/for^R^) and sitter (for^ˢ^/for^ˢ^) strains exhibit allelic differences in foraging gene expression, with rovers showing elevated PKG activity compared to sitters due to the hypomorphic nature of the for^ˢ^ allele [40]. The kinase encoded by foraging is a critical regulator of numerous downstream targets, leading to a range of pleiotropic effects associated with the foraging gene [1,41–43].
Moreover, the cultured giant neural characteristics of these phenotypes are distinctly different [42]. Neurons from sitter-allele homozygotes (for^ˢ^/for^ˢ^) display higher levels of spontaneous activity and exhibit exaggerated responses to stimulation, known as excessive evoked firing, which are not observed in neurons from rover-allele homozygotes (for^R^/for^R^). This heightened excitability in neurons of sitter allele is attributed to a reduction in voltage-dependent potassium (K^+^) currents and the presence of excitable synapses. Additionally, the axon terminal projections of sitter strains are altered, further highlighting the neural basis for the behavioral differences between these two foraging strategies [42]. The foraging gene’s pleiotropic roles in synaptic structure, vesicle dynamics, and neuronal-glial interactions underscore its importance in balancing energy allocation and synaptic plasticity. These findings provide a framework for understanding how genetic variation in for (PKG) shapes adaptive behaviors through NMJ remodeling [44,45].
The for^R^ homozygote allele displayed deficiencies exclusively in SMD behavior (sup 1A), while the for^S^ homozygote allele exhibited deficits only in LMD behavior (Fig 1B). Strikingly, the for^R^/for^S^ transheterozygote exhibited deficits in both LMD and SMD behaviors (Fig 1C), indicating that each allele specifically affects distinct interval timing behaviors. All adult flies that are heterozygous for the control demonstrate typical LMD behavior (S1A and S1B Fig). Therefore, each for^R^ or for^S^ allele displays a dominant phenotype when paired with another for^R^ or for^S^ allele (Fig 1C), but this dominance is lost when they are paired with a wild-type for allele (S1A and S1B Fig). In molecular terms, these findings indicate that the PKG activity and regulatory mechanisms associated with each foraging homozygous allele is essential for disrupting LMD or SMD behaviors. Therefore, we hypothesize that an extremely high level of PKG activity specifically disrupts SMD, while an extremely low level of PKG activity specifically disrupts LMD behavior.
Interval behavior is regulated by two distinct foraging alleles.(A-C) LMD and SMD assays for forR homozygous variants, forS homozygous variants and transheterozygote forR/forS. Light grey dots represent group males and blue dots represent single reared ones. Dot plots represent the MD (Mating Duration) of each male fly. DBMs represent difference between means. The mean value and standard error are labeled within the dot plot (black lines). Asterisks represent significant differences, as revealed by the Student’s t test ( p < 0.05, ** p < 0.01, *** p < 0.001). The same notations for statistical significance are used in other figures. (D) LMD assay of flies expressing elavc155 (neuron) driver together with for-RNAi. (E) LMD assay of flies expressing repo-GAL4 (glia) driver together with for-RNAi. (F) Single-cell RNA sequencing (SCOPE scRNA-seq) datasets reveal cell clusters colored by expression of foraging (red), nSyb/elav (blue/green) in neurons. (G) SCOPE scRNA-seq datasets reveal cell clusters colored by expression of foraging (red), CNS surface glia/repo (blue/green) in glia cells.*
Given the more pronounced defects associated with the sitter allele which shows lower PKG activity [41,42,46], we have chosen to concentrate our efforts on elucidating the genes and neural circuits that underlie the influence of the foraging gene on LMD behavior, with the aim of mapping the precise mechanisms governing this aspect of interval timing.
Memory circuitry for LMD behavior is not linked to the function of foraging
To recreate the effects of the for^S^ allele, we employed RNA interference (RNAi)-mediated gene knockdown. This technique lowers the expression of the PKG gene, consequently reducing PKG activity in cells expressing GAL4. The neuronal knockdown of for using two distinctive RNAi strains disrupted LMD behavior (Figs 1D and S1C), however glial knockdown had no effect (Fig 1E). Utilizing the cutting-edge fly SCope single-cell RNA-sequencing data platform [47], we detected a significant overlap in the expression of the foraging gene with two key markers: elav, indicative of neuroblast activity, and nSyb, a synaptic marker, within the neuronal population (Fig 1F). This co-expression pattern implies that the foraging gene likely plays a role in neuronal function. The foraging gene also exhibits a strong expression correlation with repo, a marker for glial cells, and is prominently expressed in specific regions of the central nervous system (CNS) surface glia (Fig 1G). Given that RNAi and GAL4 control cross flies exhibit normal LMD behavior (S1D and S1E Fig), we infer that the neuronal function of the foraging gene is indispensable for the generation of LMD behavior, whereas the glial function is not. Knockdown of foraging using the nSyb-GAL4 driver, located on the third chromosome, also disrupted LMD behavior, confirming that the chromosomal location of the GAL4 transgene does not influence the observed effects of foraging knockdown (S1G Fig).
Given the foraging gene’s established role in learning and memory in Drosophila [48,49], we investigated its function in key brain regions associated with memory. We have previously demonstrated that the neural circuits responsible for the formation and retention of longer mating duration (LMD) memories are located within the R2-R4m ring neurons of the ellipsoid body (EB) [15]. Knockdown of for in the mushroom body (MB) (Fig 2A), fan-shaped body (FB) (Fig 2B), EB (Fig 2C), and pars intercerebrails (PI) (Fig 2D) did not affect LMD behavior, indicating that for expression in these memory-related brain regions is dispensable for LMD generation. This aligns with previous findings that MB ablation via hydroxyurea feeding did not alter the locomotor activity of rover and sitter larval morphs [50]. Our findings reveal those molecular markers for the MB (Fas2- and Mef2-positive) [51,52], EB (Hk- and AstA-R1-positive) [53,54], FB (Dh31- and ss-positive) [55,56], and PI (Ilp2-positive but Ilp7-negative) [57] specifically overlap with foraging gene expression in certain neuronal populations (Fig 2E–H). This suggests that foraging gene expression within these memory-related brain regions is not essential for the formation of memories underlying LMD behavior, contrary to the previous assumption that such memories were primarily localized to the EB rather than the MB or FB [15]. Therefore, the foraging gene may not be directly involved in the generation of LMD-related memories, or there may be other, as yet unidentified, brain regions critical for this function.
The memory circuitry responsible for LMD behavior does not correlate with foraging activities.(A) LMD assay of flies expressing MB247-GAL4 (MB) driver together with for-RNAi. (B) LMD assay of flies expressing GAL414-94(FB) driver together with for-RNAi. (C) LMD assay of flies expressing c547-GAL4 (EB) driver together with for-RNAi. (D) LMD assay of flies expressing Ilp2-GAL4 (PI) driver together with for-RNAi. (E) SCOPE scRNA-seq datasets reveal cell clusters colored by expression of foraging (red), Fas2/Mef2 (blue/green) in glia cells. (F) SCOPE scRNA-seq datasets reveal cell clusters colored by expression of foraging (red), Hk/AstA-R1 (blue/green) in neurons. (G) SCOPE scRNA-seq datasets reveal cell clusters colored by expression of foraging (red), Dh31/ss (blue/green) in glia cells. (H) SCOPE scRNA-seq datasets reveal cell clusters colored by expression of foraging (red), Ilp7/Ilp2 (blue/green) in glia cells.
A distinct population of peptidergic neurons that express the for gene are responsible for regulating LMD
LMD behavior is known to depend on the peptidergic circuitry of PDF/NPF, but not sNPF [16]. However, our data show that foraging gene expression in these peptidergic neurons does not affect LMD behavior, nor is foraging gene expression detected in these circuits (Fig 3A–F). This indicates that foraging gene expression in the peptidergic neurons is also not required for LMD behavior associated with foraging gene function. Despite the absence of a clear co-expression pattern between foraging gene and Pdf or NPF in neuronal populations, we observed a significant overlap between the expression of sNPF and foraging gene (Fig 3F).
Pdfr neurons that express the for gene are responsible for regulating LMD.(A) LMD assay of flies expressing Pdf-GAL4 driver together with for-RNAi. (B) SCOPE scRNA-seq datasets reveal cell clusters colored by expression of foraging (blue), Pdf (green) in neurons. (C) LMD assay of flies expressing NPF-GAL4 driver together with for-RNAi. (D) SCOPE scRNA-seq datasets reveal cell clusters colored by expression of foraging (blue), NPF (green) in neurons. (E) LMD assay of flies expressing sNPF-GAL4 driver together with for-RNAi. (F) SCOPE scRNA-seq datasets reveal cell clusters colored by expression of foraging (blue), sNPF (green) in neurons. (G) LMD assay of flies expressing cry-GAL4 driver together with for-RNAi. (H) LMD assay of flies expressing Pdfr2A-GAL4 driver together with for-RNAi. (I) SCOPE scRNA-seq datasets reveal cell clusters colored by expression of foraging (blue), cry (green) in neurons. (J) SCOPE scRNA-seq datasets reveal cell clusters colored by expression of foraging (blue), Pdfr (green) in neurons. (K) SCOPE scRNA-seq datasets reveal cell clusters colored by expression of foraging (red), cry/Pdfr (blue/green) in neurons. (L) LMD assay for Pdfr2A-GAL4 drives for overexpression under fors homozygote. (M) Male flies brain expressing the Pdfr2A-GAL4 together with UAS-myrGFP were immunostained with anti-GFP (green) and nc82 (magenta) antibodies. Scale bars represent 100 μm.
Given that Pdf signaling is known to operate through cry- and Pdfr-positive clock neuronal circuits [16], we investigated the role of foraging gene within these circuits. We discovered that knocking down foraging gene expression in Pdfr-expressing cells, but not cry-expressing cells impairs LMD behavior (Fig 3G–H), and that foraging gene is expressed in a specific neuronal population where cry and Pdfr are expressed (Fig 3I–K). Furthermore, genetically restoring wild-type foraging gene expression in Pdfr-positive cells of the for^S^ variant background rescues LMD behavior (Figs 3L and S1F), indicating that Pdfr-positive cells are a crucial population for the generation of LMD behavior in the context of foraging gene function.
Expression of foraging in Pdfr-expressing specific cell population is essential for the induction of LMD behavior
Upon examining the expression patterns of Pdfr-positive cells in the brain, we observed robust expression within the EB (Fig 3M). Our previous research also suggested that the EB is a central region involved in forming memories related to LMD [15]. To identify the precise region within the EB where the foraging gene is active in promoting LMD behavior, we employed a mini-scale screening approach using established enhancer trap GAL4 lines [58]. These lines have been effectively utilized to delineate the anatomical structure of the adult central complex. We identified cells labeled by 30y- and c61-GAL4 drivers as potential candidates (Fig 4A–J). The 30y-GAL4 driver is known for its expression in the MB, EB and FB, subesophageal ganglion (SOG), antennal & optic lobes (AL & OL), protocerebrum, and median bundle. Meanwhile, c61-GAL4 has been associated with expression in Fa3 neurons of the central complex (CC) and extends projections through the protocerebral bridge (PB) to the FB [58–60]. Given that the c61-GAL4 driver, which is specific to a restricted set of neurons, disrupted LMD behavior when for gene expression was knocked down (Fig 4J), while the broader EB driver c547-GAL4 did not (Fig 2C), we hypothesize that a very specific subset of c61-positive neurons that are c547-negative are solely responsible for the neuronal function of foraging that leads to LMD.
Candidate Pdfr-expressing cells in the ellipsoid body drivers for LMD screening.(A-J) LMD assays for male knockdown of foraging driven by subsets of neuronal cell lines of the EB, 30y-GAL4(A), 078y-GAL4 (B), 210y-GAL4 (C), 104y-GAL4 (D), 007y-GAL4 (E), c42-GAL4 (F), c232-GAL4 (G), c205-GAL4 (H), c161-GAL4 (I), and c61-GAL4 (J). (K) LMD assay for male knockdown of foraging driven by EB-split-GAL4, SS00096. (L) Male flies expressing EB-split-GAL4, SS00096, with UAS-myrGFP. Source image lsm files (~500MB) were downloaded from FlyLight platform constructed by Janelia Farm Research Center (JFRC) then reconstructed using ImageJ https://flylight-raw.janelia.org/cgi-bin/view_raw_imagery.cgi?line=SS00096 [96, 97]. Scale bars represent 100 μm.
Screening for overexpression of the foraging gene has provided evidence that the expression level of foraging in cells targeted by the 30y-GAL4 and c61-GAL4 drivers is critical for the generation of LMD (S2A–K Fig). This finding aligns with previous research indicating that feeding-related traits are influenced by the dosage of the foraging gene [40]. By expressing wild-type for gene in cells labeled by the 30y-GAL4 driver, we were able to restore normal LMD behavior (S2L Fig). Moreover, utilizing a recently identified EB-split GAL4 driver line (SS00096) [61], we demonstrated that knocking down for expression in specific EB neurons significantly impacts LMD behavior (Fig 4K–L). Aligning with genetic control data (S2M Fig), our results further suggest that the interval timing-related traits are also modulated by the dosage of the foraging gene within specific cell populations of the EB.
foraging expression in the heart modulates calcium dynamics via Pdfr signaling to regulate LMD behavior
Although the specific population of neurons in the EB relies on the foraging gene for the induction of LMD, there may also be a non-neuronal contribution from the foraging gene to elicit LMD behavior. This is supported by our recent findings that corazonin receptor (CrzR), a gene expressed in glial cells, is a crucial component for LMD [62]. Recent studies have indicated that the foraging gene is expressed across various tissues and is not confined to neuronal populations, extending its reach to glial subtypes and peripheral tissues such as the gastric and reproductive systems [63]. Additionally, the expression of the foraging gene in multiple tissues and organs is known to be influenced by starvation [10]. Utilizing the fly SCope 10x-Cross tissue platform, we discovered that the foraging gene is expressed at high levels in the majority of tissues (S3A–N Fig). Notably, the foraging gene shows particularly strong co-expression with Pdfr in the fat body (S3A Fig), muscle (S3I Fig), and oenocytes (S3J Fig). Using the 10x and SMART-seq2 platforms, we identified robust co-expression of foraging and Pdfr in the heart (Fig 5A).
Sexually dimorphic expression of the foraging gene in the heart.(A) SCOPE scRNA-seq datasets reveal cell clusters colored by expression of foraging (blue), Pdfr (green) in heart. (B-E) LMD assays for tissue-specific knockdown of foraging via for-RNAi using (B) ppl-GAL4, (C) Mhc-GAL4, (D) PromE800-GAL4ts and (E) Hand-GAL4. (F-I) LMD assays for tissue-specific knockdown of Pdfr via Pdfr-RNAi using (F) ppl-GAL4, (G) Mhc-GAL4, (H) PromE800-GAL4ts and (I) Hand-GAL4. (J) SCOPE scRNA-seq datasets reveal cell clusters colored by expression of foraging (blue), fruitless/Pdfr (red/green) in heart. (K-L) SCOPE scRNA-seq datasets reveal cell clusters colored by expression of foraging (red), doublesex/fruitless (blue/green) in heart (K) and neurons (L). (M) Male flies heart expressing the UAS(FRT.stop)mCD8GFP; fruFLP together with Pdfr2A-GAL4 were immunostained with anti-GFP (green) antibody and phalloidin (magenta). (N) LMD assay for male knockdown of foraging driven by fru-GAL4. Scale bars represent 100 μm. (O) LMD assay for male knockdown of foraging driven by dsx-GAL4.
Our findings implicate PDF-PDFR mediated peptidergic signaling as a mechanism through which this specific organ system influences a diverse array of behaviors and physiological processes. Considering the critical role of these organs in sugar and lipid metabolism, essential for energy storage and homeostasis, it is plausible that foraging gene expression within these tissues may significantly regulate energy-related behaviors and physiological responses [64–68]. Notably, the knockdown of foraging gene expression in the fat body, muscle, and oenocytes did not perturb LMD behavior (Fig 5B–D). However, targeted knockdown of foraging in the heart using the Hand-GAL4 driver resulted in disrupted LMD behavior (Fig 5E). Similarly, knockdown of Pdfr in both muscle and heart tissues also led to impaired LMD (Fig 5F–I), indicating that Pdfr expression in the heart and muscle is essential for activating the signaling pathways required to generate LMD behavior. These results indicate that foraging gene expression in the heart (S3O Fig) is essential for the maintenance of interval timing behaviors.
Interval timing generation depends on foraging function in fru-positive heart cells
LMD represents a male-specific interval timing behavior that relies on sexually dimorphic NPF neurons situated within the brain [15,16]. In Drosophila, sex-biased gene expression in the brain can indeed represent sexual dimorphic features [69]. Sexual dimorphism refers to the phenotypic differences between males and females of the same species. These differences can be influenced by genetic factors, including differential expression of genes between the sexes [70,71].
In Drosophila, sexual dimorphism refers to the distinct differences in phenotype between males and females. These differences are largely determined by the expression of the fruitless (fru) and doublesex (dsx) genes, which play critical roles in the development of male and female characteristics. These genes regulate the development of male and female-specific traits, contributing to the distinct phenotypes observed between males and females of the same species [72–76].
Investigation of the co-expression patterns of the foraging gene with fru and dsx revealed distinct heart cell and neuronal populations that express foraging in conjunction with either fru or dsx (Fig 5J–L). The fru gene is primarily involved in the regulation of sexual behaviors through the modulation of neural pathways, whereas dsx exhibits broader effects, impacting both neuronal circuits and the development of sexual characteristics in various cell types, extending beyond neurons [73]. Indeed, we observed Pdfr expression in both fru-positive neurons and heart cells (Figs 5M and S3P). Notably, Pdfr-positive brain neurons did not overlap with the EB, consistent with previous reports that EB cells are not fru-positive [77,78]. Additionally, we found that the 30y-GAL4 driver labels fru-positive heart cells, similar to the Pdfr^2A^-GAL4 driver (S3Q Fig). Specifically, the inhibition of the for gene in fru-expressing cells resulted in the disruption of LMD behavior (Fig 5N), whereas the knockdown of the for gene in dsx-expressing cells did not affect LMD behavior (Fig 5O).
Therefore, we conclude that the knockdown and genetic rescue effects observed with the Pdfr^2A^-GAL4 driver (Fig 3J and 3L) and the 30y-GAL4 driver (Figs 4A, S2A, and S2L) are attributable to their expression in the heart. In summary, our findings demonstrate that fru-positive heart cells expressing foraging and Pdfr play a critical role in mediating LMD behavior. These findings support the hypothesis that foraging exhibits sexually dimorphic effects primarily in male-specific neuronal populations.
Heart calcium dynamics are regulated by foraging and Pdfr signaling in a social context-dependent manner
Given the compelling evidence indicating that foraging function is exclusively dependent on a specific neuronal population and not on other tissues for the manifestation of LMD behavior, we sought to explore the calcium response properties of for^MI01791-TG4.1^ neurons in flies experiencing diverse social conditions. Utilizing CaLexA, a transcription-based calcium reporter system [79], we observed elevated levels of CaLexA signals originating from for-positive neurons within the central brain region of group-reared male flies compared to those reared in isolation (S4A–C Fig). In contrast, the levels of CaLexA signals within the fat body remained unchanged between socially isolated and group-reared flies (S4D–E Fig). This differential response suggests that calcium signaling within a specific neuronal population proximal to the central brain region plays a pivotal role in modulating interval timing behavior.
Calcium dynamics play a pivotal role in regulating heart function across species, from humans to fruit fly [80–82]. In humans, calcium ions (Ca^2^⁺) are central to cardiac muscle contraction and relaxation, acting as key mediators of excitation-contraction coupling. In response to electrical signals, Ca^2^⁺ influx through voltage-gated channels triggers the release of stored calcium from the sarcoplasmic reticulum, leading to muscle contraction. Dysregulation of calcium handling is implicated in various cardiac pathologies, such as arrhythmias and heart failure [82]. We observed that fly heart pericardial cells (PCs) exhibit robust CaLexA signals under group-housed conditions but not in socially isolated conditions (Fig 6A–C). These changes in calcium dynamics were abolished when either foraging (Fig 6D–E) or Pdfr (Fig 6F–G) was knocked down in the heart, indicating that both genes are essential for mediating social context-dependent calcium signaling in PCs.
The dynamics of heart calcium are modulated by foraging activities and Pdfr signaling.(A) CalexA assay for Hand-GAL4 together with lexAop-mCD8GFP; UAS-CaLexA, lexAop-CD2-GFP of group (up) and single (bottom) male flies. The box represents the fluorescence signal of an individual pericardial cell (PC). Scale bars represent 50 μm in heart images and represent 5 μm in individual PC images. See the “Methods” for a detailed description of the fluorescence intensity analysis used in this study. (B) The small panels are presented as a red scale to show the GFP/RFP fluorescence marked by the threshold function of ImageJ. (C) Quantification of percent area for calcium signals displayed in (A) between group and single male flies. (D) CalexA assay for Hand-GAL4 together with UAS-mCD8RFP, lexAop-mCD8GFP; lexAop-mCD8GFP; UAS-CaLexA, lexAop-CD2-GFP of genetic control (empty-RNAi, up) and group male flies with knocking down foraging (for-RNAi, bottom). RFP (UAS-mCD8RFP) labels cell membranes independently of CaLexA-GFP. Strain generated by integrating BDSC #32229 and #66542. Scale bars represent 50 μm in heart images. (E) Quantification of percent area for calcium signals displayed in (D) between group male flies expressing Hand-GAL4 with empty-RNAi and for-RNAi. (F) CalexA assay for Hand-GAL4 together with lexAop-mCD8GFP; UAS-CaLexA, lexAop-CD2-GFP of genetic control (empty-RNAi, up) and group male flies with knocking down Pdfr (Pdfr-RNAi, bottom). Scale bars represent 50 μm in heart images. (G) Quantification of percent area for calcium signals displayed in (F) between group male flies expressing Hand-GAL4 with empty-RNAi and Pdfr-RNAi. (H) Model of how foraging regulate LMD behavior. The images are from https://www.svgrepo.com/.
Previous studies have delineated the multifaceted influence of the foraging gene, extending beyond locomotor behavior to include alcohol sensitivity [7], sucrose responses [8], and social network formation [28]. These behaviors are all profoundly influenced by the serotonergic system, which plays a pivotal role in modulating a wide array of physiological and behavioral processes [83–87]. Despite this, our experiments indicate that the foraging gene’s expression in the serotonergic system is not a prerequisite for LMD behavior. By manipulating foraging gene levels within the serotonergic system using 5-HT1B-GAL4 and Trhn-GAL4 drivers, we observed no disruption in LMD (S5A–D Fig). Furthermore, we did not detect a significant co-expression between the foraging gene and either 5-HT1B or Trhn (S5E–5F Fig), suggesting that the serotonergic system is not essential for the foraging gene’s function in generating LMD behavior.
Collectively, these findings indicate that foraging expression collaborates with PDF-PDFR signaling in specific EB brain regions and fru-positive heart cells to regulate calcium dynamics in a social context-dependent manner. This modulation of calcium dynamics ultimately influences LMD, an interval timing behavior (Fig 6H).
Discussion
This study explores the role of the foraging gene in regulating interval timing behaviors, particularly mating duration, in Drosophila melanogaster. The foraging gene, known for its influence on behavioral plasticity and decision-making, exhibits distinct effects in two allelic variants—rover (for^R^) and sitter (for^S^). These variants display specific deficiencies in LMD and SMD behaviors, highlighting the gene’s role in interval timing (Fig 1). While the gene is expressed in key brain regions associated with memory and learning, its impact on LMD was not observed in these areas (Fig 2). Instead, foraging expression in Pdfr-positive neurons and fru-positive heart cells was found to be critical for LMD, suggesting its involvement in both neural and non-neural circuits (Figs 3–5). Additionally, the study revealed that foraging modulates calcium dynamics in a social context-dependent manner, further linking its function to interval timing behaviors (Fig 6). These findings underscore the complex interplay between genetic, neural, and environmental factors in regulating interval timing, with the foraging gene playing a central role in orchestrating these behaviors.
The foraging gene exhibits distinct influences on interval timing behaviors (LMD and SMD) in Drosophila, with the rover variant specifically affecting SMD and the sitter variant affecting LMD. The rescue of LMD by reintroducing wild-type foraging gene expression into the appropriate neurons highlights the critical role of the foraging gene in mediating interval timing behaviors [8,40,46,63]. Given the utilization of distinct circadian clock genes, neuropeptides, and neural circuits by LMD and SMD [18,34], it would be intriguing to explore the mechanisms by which the single gene foraging can differentially modulate these two distinct interval timing behaviors.
The foraging gene plays a critical role in regulating interval timing behaviors, with its allelic variants, rover and sitter, exhibiting distinct effects on LMD and SMD. These differences are primarily driven by their opposing impacts on cGMP-dependent protein kinase (PKG) activity. The for^R^ allele, associated with higher PKG activity, disrupts SMD while maintaining normal LMD (Fig 1A), suggesting that elevated PKG levels may hyperactivate or desensitize neural circuits specific to SMD processes. Conversely, the for^S^ allele, characterized by lower PKG activity, impairs LMD but not SMD (Fig 1B), indicating that reduced PKG activity fails to meet the neuromodulatory thresholds required for LMD coordination. The for^R^/for^S^ transheterozygotes, which disrupt both LMD and SMD (Fig 1C), reveal a complex interaction between these alleles, likely due to conflicting PKG activity levels or metabolic and neuronal polymorphisms that destabilize shared pathways. This phenomenon underscores the foraging gene’s pleiotropic roles, where allelic balance fine-tunes PKG activity to maintain behavioral robustness, while extreme or mismatched levels disrupt circuit-specific thresholds critical for distinct memory processes [6,10]. While our findings support PKG-mediated mechanisms, we acknowledge the alternative possibility that background mutations in the for^R^ or for^s^ stocks might contribute to the observed transheterozygotes phenotype. Such mutations could behave recessively in heterozygotes but show dominant interactions in the for^R^/for^S^ combination. Future studies using CRISPR-generated alleles could help resolve these competing explanations.
The foraging gene’s influence on interval timing behaviors extends beyond neural circuits to include metabolic and synaptic regulation. The intact behaviors observed in for^R^/+ or for^S^/ + heterozygotes suggest that intermediate PKG activity levels balance circuit dynamics, allowing for normal LMD and SMD. However, the dual deficits in for^R^/for^S^ transheterozygotes highlight the importance of allelic balance, as conflicting PKG levels may lead to systemic disruptions in both metabolic and neural pathways. This aligns with previous studies showing that foraging mediates adult plasticity and gene-environment interactions, particularly under stress conditions, and regulates synaptic terminal morphology and neuronal excitability [27,42]. The gene’s role in integrating genetic and environmental cues further emphasizes its central role in adaptive behaviors. Collectively, these findings illustrate the complex interplay between PKG activity, neural circuits, and metabolic regulation in shaping interval timing behaviors, highlighting the foraging gene as a key modulator of behavioral plasticity in Drosophila [3,6,27].
Our findings reveal a previously unrecognized non-neuronal mechanisms by which foraging modulates interval timing behaviors through its function in fru-positive heart cells. We demonstrate that foraging and Pdfr co-expression in these cells regulates social context-dependent calcium dynamics, as evidenced by robust CaLexA signals in group-housed flies, which are absent in socially isolated individuals (Figs 5A and 6A–C). Knockdown of either foraging or Pdfr in the heart disrupts these calcium fluctuations and impairs LMD behavior (Fig 5E–G), indicating that PDF-PDFR signaling acts in concert with foraging to modulate cardiac calcium activity. This interaction likely bridges social environmental cues with internal metabolic states, as foraging is known to interact with insulin signaling under stress, and PDF-PDFR pathways integrate circadian and peptidergic inputs. The sexually dimorphic nature of LMD, coupled with fru’s role in male-specific traits, suggests that foraging’s function in fru-positive heart cells represents a critical node for male reproductive strategies, linking cardiac physiology to interval timing behaviors. These results expand the scope of foraging’s pleiotropy, highlighting its role in coordinating organ-level calcium dynamics with neural circuits to adaptively regulate time-sensitive behaviors in response to social contexts.
In summary, the critical role of the foraging gene in mediating complex interval timing behaviors in Drosophila is evident. The gene’s expression in specific neurons and heart cells is crucial for its function. The intricate interplay between genetics, environment, and behavior revealed by these findings has broader implications for understanding the regulation of complex behaviors across species.
Methods
Ethics statement
All animal experiments reported in this manuscript were conducted in compliance with the ARRIVE guidelines and adhered to the U.K. Animals (Scientific Procedures) Act, 1986 and associated guidelines, EU Directive 2010/63/EU for animal experiments, or the National Research Council’s Guide for the Care and Use of Laboratory Animals.
Fly stocks and husbandry
Drosophila melanogaster were raised on cornmeal-yeast medium at similar densities to yield adults with similar body sizes. Flies were kept in 12 h light: 12 h dark cycles (LD) at 25°C (ZT 0 is the beginning of the light phase, ZT12 beginning of the dark phase) except for some experimental manipulation (experiments with the flies carrying tub-GAL80^ts^). Wild-type flies were Canton-S (CS). We have previously demonstrated that our CS flies exhibit normal LMD and SMD behaviors [15,19]. To reduce the variation from genetic background, all flies were backcrossed for at least 3 generations to CS strain. Following lines used in this study, Canton-S (#64349), Df(1)Exel6234(#7708), for^S^ (#76120), elav^c155^ (#25750), repo-GAL4(#7415), nSyb-GAL4(#68222), MB247-GAL4(#50742), c547-GAL4(#30819), Ilp2-GAL4(#37516), Pdf-GAL4(#6899), NPF-GAL4(#25682), sNPF-T2A-GAL4(#84706), empty-RNAi(#36304*), cry-GAL4*(#24514), Pdfr-GAL4(#33070), 30y-GAL4(#30818), 078y-GAL4(#30821), 104y-GAL4(#81014), 007y-GAL4(#30812), c42-GAL4(#30835), c232-GAL4(#30828), c205-GAL4(#30826), c161-GAL4(#27893), c61-GAL4(#30845), EB-split-GAL4^SS00096^(#86861), 5-HT1B-GAL4(#86276), Trhn-GAL4(#84694), P{PZ}for[06860](#12326), ppl-GAL4(#58768), Mhc-GAL4(#55133), PromE-GAL4(#65404), Pdfr^2A^-GAL4(#84684), fru-GAL4(#66696), dsx-GAL4(#63434), for^MI01791-TG4.1^ (#76140), UAS-Pdfr-RNAi(#42508), UAS-myrGFP(#77479), UAS-for(#37776), for-RNAi(#35158/#50741) were obtained from the Bloomington Drosophila Stock Center at Indiana University. UAS(FRT.stop)mCD8GFP; fru^FLP^(K1119), LexAop-CD8GFP(II); UAS-CaLexA, LexAop-CD2-GFP (K1234, originally BDSC #66542) were obtained from the Korea Drosophila Resource Center. To independently label cell membranes from CaLexA-driven GFP signals, we generated a transgenic strain (UAS-mCD8RFP, lexAop-mCD8GFP (X); LexAop-CD8GFP (II); UAS-CaLexA, LexAop-CD2GFP (III) by integrating BDSC stock #32229 and #66542. This design leverages distinct expression systems (UAS vs. LexAop) to separate RFP (membrane marker) and GFP (calcium activity reporter) signals. We thank Dr. Maria B. Sokolowski (University of Toronto) for sharing for^R^ variants, Drs. Yuh Nung Jan and Lily Yeh Jan (UCSF, USA) for kindly sharing GAL^14-94^ fly strain, Dr. Susan C.P. Renn (Washington University School of Medicine) for sharing 210y-GAL4 stain, Dr. Lihua Jin (Northeast Forestry University) for sharing Hand-GAL4 stain.
Mating duration assays
The mating duration assay in this study has been reported [15,16,19]. To enhance the efficiency of the mating duration assay, we utilized the Df(1)Exel6234 (DF here after) genetic modified fly line in this study, which harbors a deletion of a specific genomic region that includes the sex peptide receptor (SPR) [88,89]. Previous studies have demonstrated that virgin females of this line exhibit increased receptivity to males [89]. We conducted a comparative analysis between the virgin females of this line and the CS virgin females and found that both groups induced SMD. Consequently, we have elected to employ virgin females from this modified line in all subsequent studies. For naïve males, 40 males from the same strain were placed into a vial with food for 5 days. For single reared males, males of the same strain were collected individually and placed into vials with food for 5 days. For experienced males, 40 males from the same strain were placed into a vial with food for 4 days then 80 DF virgin females were introduced into vials for last 1 day before assay. 40 DF virgin females were collected from bottles and placed into a vial for 5 days. These females provided both sexually experienced partners and mating partners for mating duration assays. At the fifth day after eclosion, males of the appropriate strain and DF virgin females were mildly anaesthetized by CO_2_. After placing a single female into the mating chamber, we inserted a transparent film then placed a single male to the other side of the film in each chamber. After allowing for 1 h of recovery in the mating chamber in 25°C incubators, we removed the transparent film and recorded the mating activities. Only those males that succeeded to mate within 1 h were included for analyses. Initiation and completion of copulation were recorded with an accuracy of 10 sec, and total mating duration was calculated for each couple. All assays were performed from noon to 4pm. We conducted blinded studies for every test. The genetic controls using GAL4/+ or UAS/ + lines were not included in the supplementary figures because we have previously demonstrated that 100% of these flies exhibit normal LMD and SMD behaviors [15,16,19]. Consequently, we only included additional genetic control experiments when they were considered essential for key fly lines.
Immunostaining and antibodies
The dissection and immunostaining protocols for the experiments are described elsewhere [16,19]. After 5 days of eclosion, the Drosophila brain has been taken from adult flies and fixed in 4% formaldehyde at room temperature for 30 minutes. The sample has been washed three times (5 minutes each) in 1% PBT and then blocked in 5% normal goat serum for 30 minutes. The samples were first incubated overnight at 4°C with primary antibodies diluted in 1% PBT. Subsequently, fluorophore-conjugated secondary antibodies were applied and incubated for one hour at room temperature. The brain was mounted on plates with an antifade mounting solution (Solarbio) for imaging purposes. Samples were imaged with Zeiss LSM880. Primary antibodies: Chicken anti-GFP (1:500, Invitrogen), rabbit anti-LacZ antibody (1:1000, Rockland), rat anti-elav (1:100, DSHB), mouse anti-Bruchpilot (nc82) (1:50, DSHB). Fluorophore-conjugated secondary antibodies: Alexa-488 donkey anti-chicken (1:200, Jackson), Alexa Fluor 488-conjugated goat anti-rabbit (1:100, Thermo), Alexa Fluor 555-conjugated donkey anti-rat (1:100, Thermo), Alexa Fluor 647-conjugated goat anti-mouse (1:100, Jackson), plasma membranes of fatbody (stained by CellMask Deep red C10046, Thermo).
Quantitative analysis of fluorescence intensity
To ascertain calcium levels from microscopic images, we dissected and imaged five-day-old flies of various social conditions and genotypes under uniform conditions. For group reared (naïve) condition, the flies were reared in the group condition and dissect right after 5 days of rearing without any further action. For single reared condition, the flies were reared in single condition and dissect at the same time as group reared flies right after 5 days of rearing. The GFP signal in the brains and hearts was amplified through immunostaining with chicken anti-GFP primary antibody. Image analysis was conducted using ImageJ software. For the quantification of fluorescence intensities, an investigator, blinded to the fly’s genotype, thresholded the sum of all pixel intensities within a sub-stack to optimize the signal-to-noise ratio, following established method [90]. The total fluorescent area or region of interest (ROI) was then quantified using ImageJ, as previously reported. For CaLexA signal quantification, we adhered to protocols detailed by Kayser et al. [91], which involve measuring the ROI’s GFP-labeled area by summing pixel values across the image stack. This method assumes that changes in the GFP-labeled area are indicative of alterations in the CaLexA signal, reflecting synaptic activity. CaLexA signals were quantified using ‘integrated signal density’ (summed pixel intensity within manually defined ROIs), not merely ROI area. ROI intensities were background-corrected by measuring and subtracting the fluorescent intensity from RFP channel or nc82 channel, as per Kayser et al. [91].
Single-nucleus RNA-sequencing analyses
snRNAseq dataset analyzed in this paper is published in [47] and available at the Nextflow pipelines (VSN, https://github.com/vib-singlecell-nf), the availability of raw and processed datasets for users to explore, and the development of a crowd-annotation platform with voting, comments, and references through SCope (https://flycellatlas.org/ scope), linked to an online analysis platform in ASAP (https://asap.epfl.ch/fca).
Statistical analysis
Statistical analysis of mating duration assay was described previously [19]. More than 50 males (naïve, experienced and single) were used for mating duration assay. Our experience suggests that the relative mating duration differences between naïve and experienced condition and singly reared are always consistent; however, both absolute values and the magnitude of the difference in each strain can vary. So, we always include internal controls for each treatment as suggested by previous studies [92]. Therefore, statistical comparisons were made between groups that were naïvely reared, sexually experienced and singly reared within each experiment. As mating duration of males showed normal distribution (Kolmogorov-Smirnov tests, p > 0.05), we used two-sided Student’s t tests. The mean ± standard error (s.e.m) (**** = p < 0.0001, *** = p < 0.001, ** = p < 0.01, * = p < 0.05). All analysis was done in GraphPad (Prism). Individual tests and significance are detailed in figure legends. Besides traditional t-test for statistical analysis, we added estimation statistics for all MD assays and two group comparing graphs. In short, ‘estimation statistics’ is a simple framework that—while avoiding the pitfalls of significance testing—uses familiar statistical concepts: means, mean differences, and error bars. More importantly, it focuses on the effect size of one’s experiment/intervention, as opposed to significance testing [93]. In comparison to typical NHST plots, estimation graphics have the following five significant advantages such as (1) avoid false dichotomy, (2) display all observed values (3) visualize estimate precision (4) show mean difference distribution. And most importantly (5) by focusing attention on an effect size, the difference diagram encourages quantitative reasoning about the system under study [94]. Thus, we conducted a reanalysis of all of our two group data sets using both standard t tests and estimate statistics. In 2019, the Society for Neuroscience journal eNeuro instituted a policy recommending the use of estimation graphics as the preferred method for data presentation [95].
Supporting information
S1 FigCritical Role of foraging Alleles in LMD and SMD behaviors.(A-B) LMD and SMD assays for for^R^/+ and for^S^/ + males. (C) LMD assay of flies expressing elav^c155^ drives together with for-RNAi^GL00026^. (D) LMD assay for for-RNAi^HSM04486^/ + . (E) LMD assay of flies for elav^c155^/Y. (F) LMD assay of flies for Pdfr^2A^*-GAL4/ + *. (G) LMD assay of flies expressing nSyb-GAL4 together with for-RNAi.(TIF)
S2 FigLMD Requires Specific EB Neurons with foraging Gene.(A-K) LMD assays for male overexpressing foraging driven by subsets of neuronal cell drivers of the EB, 30y-GAL4(A), 078y-GAL4 (B), 210y-GAL4 (C), 104y-GAL4 (D), 007y-GAL4 (E), c42-GAL4 (F), c232-GAL4 (G), c205-GAL4 (H), c819-GAL4 (I), c161-GAL4 (J), and c61-GAL4 (K). (L) LMD assay for 30y-GAL4 drives for overexpression under for^s^ homozygote. (M) LMD assay for *UAS-for/ + *.(TIF)
S3 FigThe co-expression of foraging gene and Pdfr in various tissues.(A-N) SCOPE scRNA-seq datasets reveal cell clusters colored by expression of foraging (blue), Pdfr (green) in different tissues. (O) Male flies expressing the for^TG4.1^-GAL4 together with UAS-mCD8GFP were immunostained with anti-GFP (green) antibody and phalloidin (magenta). (P) Male flies brain expressing the UAS(FRT.stop)mCD8GFP; fru^FLP^ together with Pdfr^2A^-GAL4 were immunostained with anti-GFP (green) and nc82 (magenta) antibodies. Scale bars represent 100 μm. (Q) Male flies heart expressing the UAS(FRT.stop)mCD8GFP; fru^FLP^ together with 30y-GAL4 were immunostained with anti-GFP (green) antibody and phalloidin (magenta). Scale bars represent 100 μm.(TIF)
S4 Figforaging neurons in the AL of the brain are responsible for regulating LMD.(A) Different levels of neural activity of the brain as revealed by the CaLexA system in group and single reared flies. Male flies expressing for^MI01791-TG4.1^ along with LexAop-CD8GFP(II); UAS-CaLexA, LexAop-CD2-GFP were dissected after 5 days of growth. The dissected brains were then immunostained with anti-GFP (green) and anti-nc82 (blue). GFP is pseudo-colored as “red hot”. Scale bars represent 100 μm in brain panels. (B) The GFP fluorescence (green) in male fly brain was processed using ImageJ software, where a threshold function was applied to distinguish fluorescence from the background. (C) Quantification of relative value for GFP fluorescence. (D) Different levels of intracellular calcium level of the fat body as revealed by the CaLexA system in group and single reared flies. Scale bars represent 25 μm in fat body panels. (E) Quantification of mean intensity for GFP fluorescence.(TIF)
S5 Figforaging Gene’s function Independent of Serotonergic system in LMD behavior.(A-B) LMD assays of flies expressing 5-HT1B-GAL4 drives together with for-RNAi (A) and UAS-for (B). (C-D) LMD assays of flies expressing Trhn-GAL4 drives together with for-RNAi (C) and UAS-for (D). (E) SCOPE scRNA-seq datasets reveal cell clusters colored by expression of foraging (blue), 5-HT1B (green) in neurons. (F) SCOPE scRNA-seq datasets reveal cell clusters colored by expression of foraging (blue), Trhn (green) in neurons.(TIF)
S1 FileCalcium signals (GFP) in Drosophila heart cells (Hand-GAL4, RFP). Phalloidin stained in purple.(JPG)
The reference list from the paper itself. Each links out to its DOI / PubMed record.
- 1Osborne KA, Robichon A, Burgess E, Butland S, Shaw RA, Coulthard A, et al. Natural behavior polymorphism due to a c GMP-dependent protein kinase of Drosophila. Science. 1997;277(5327):834–6. doi: 10.1126/science.277.5327.834 9242616 · doi ↗ · pubmed ↗
- 2de Belle JS, Hilliker AJ, Sokolowski MB. Genetic localization of foraging (for): a major gene for larval behavior in Drosophila melanogaster. Genetics. 1989;123(1):157–63. doi: 10.1093/genetics/123.1.157 2509284 PMC 1203778 · doi ↗ · pubmed ↗
- 3Ben-Shahar Y. The foraging gene, behavioral plasticity, and honeybee division of labor. J Comp Physiol A Neuroethol Sens Neural Behav Physiol. 2005;191(11):987–94. doi: 10.1007/s 00359-005-0025-1 16133503 · doi ↗ · pubmed ↗
- 4Foucaud J, Philippe A-S, Moreno C, Mery F. A genetic polymorphism affecting reliance on personal versus public information in a spatial learning task in Drosophila melanogaster. Proc Biol Sci. 2013;280(1760):20130588. doi: 10.1098/rspb.2013.0588 23576793 PMC 3652466 · doi ↗ · pubmed ↗
- 5Eddison M, Belay AT, Sokolowski MB, Heberlein U. A genetic screen for olfactory habituation mutations in Drosophila: analysis of novel foraging alleles and an underlying neural circuit. P Lo S One. 2012;7(12):e 51684. doi: 10.1371/journal.pone.0051684 23284741 PMC 3524188 · doi ↗ · pubmed ↗
- 6Anreiter I, Sokolowski MB. The foraging Gene and Its Behavioral Effects: Pleiotropy and Plasticity. Annu Rev Genet. 2019;53:373–92. doi: 10.1146/annurev-genet-112618-043536 31487469 · doi ↗ · pubmed ↗
- 7Oepen AS, Catalano J, Azanchi R, Kaun KR. The foraging gene affects alcohol sensitivity, metabolism and memory in Drosophila. bio Rxiv. 2021;2021.02.09.430533. doi: 10.1101/2021.02.09.430533 PMC 921534234092172 · doi ↗ · pubmed ↗
- 8Belay AT, Scheiner R, So AK-C, Douglas SJ, Chakaborty-Chatterjee M, Levine JD, et al. The foraging gene of Drosophila melanogaster: spatial-expression analysis and sucrose responsiveness. J Comp Neurol. 2007;504(5):570–82. doi: 10.1002/cne.21466 17701979 · doi ↗ · pubmed ↗