Cloning and function analysis of ZmICE1a, a contributor to the melioration of maize kernel traits
Yifei Xiao, Liang Tu, Yulin Jiang, Pengfei Liu, Xiangyang Guo, Angui Wang, Yunfang Zhu, Xuefeng Lu, Zehui Chen, Xun Wu

TL;DR
This study identifies and analyzes the ZmICE1a gene, which improves maize kernel traits and plant growth, offering potential for breeding higher-yield maize varieties.
Contribution
The novel contribution is cloning and functionally characterizing ZmICE1a, a gene linked to improved maize kernel traits and plant growth.
Findings
Overexpression of ZmICE1a leads to improved kernel traits and increased plant height.
Transcriptome analysis shows ZmICE1a affects genes involved in abscisic acid signaling and metabolism pathways.
Abstract
Kernel traits are important factors in determining maize yield. Gene mining and clarification of relevant gene functions associated with kernel traits is beneficial for breeding high-yield maize varieties. In our previous research, a critical quantitative trait locus (QTL), qKWEI3.1, associated with kernel weight was mapped using a maize F2:3 population derived from the parental lines SCML0849 and ZNC442. In the present study, qKWEI3.1 was fine-mapped, the ZmICE1a gene was cloned, and the relevant functions of ZmICE1a were dissected. The results showed that plants overexpressing ZmICE1a exhibited a shorter reproductive period, increased plant height, greater stem diameter, higher photosynthetic efficiency, and meliorated kernel traits. Transcriptome analysis revealed that ZmICE1a overexpression mediated differentially expressed genes (DEGs) such as SNRK2–10, the E3 ubiquitin-protein…
Genes, proteins, chemicals, diseases, species, mutations and cell lines named across the full text — each resolved to its canonical identifier and authoritative record.
Click any figure to enlarge with its caption.
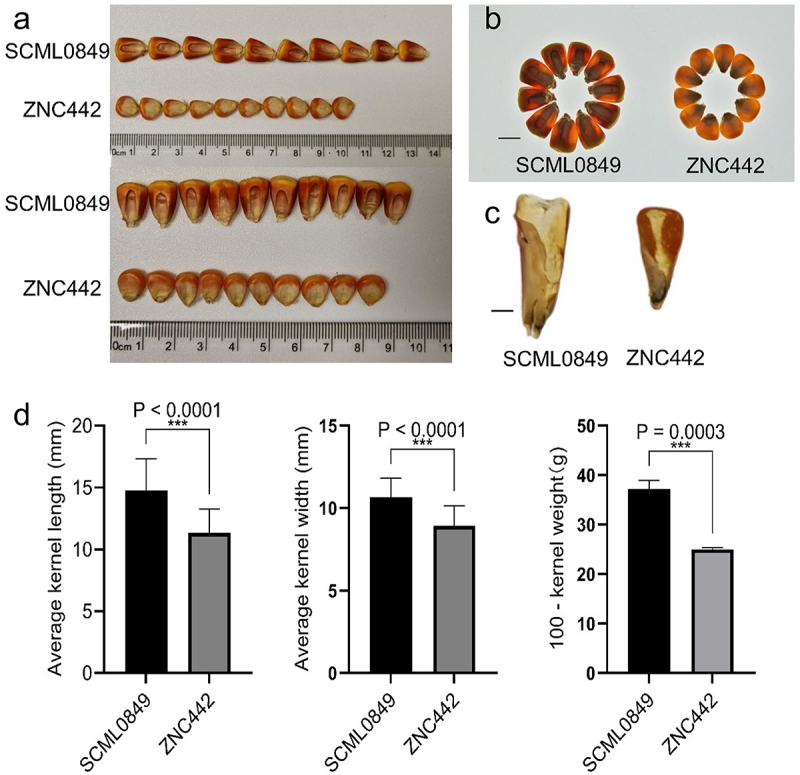 Figure 1
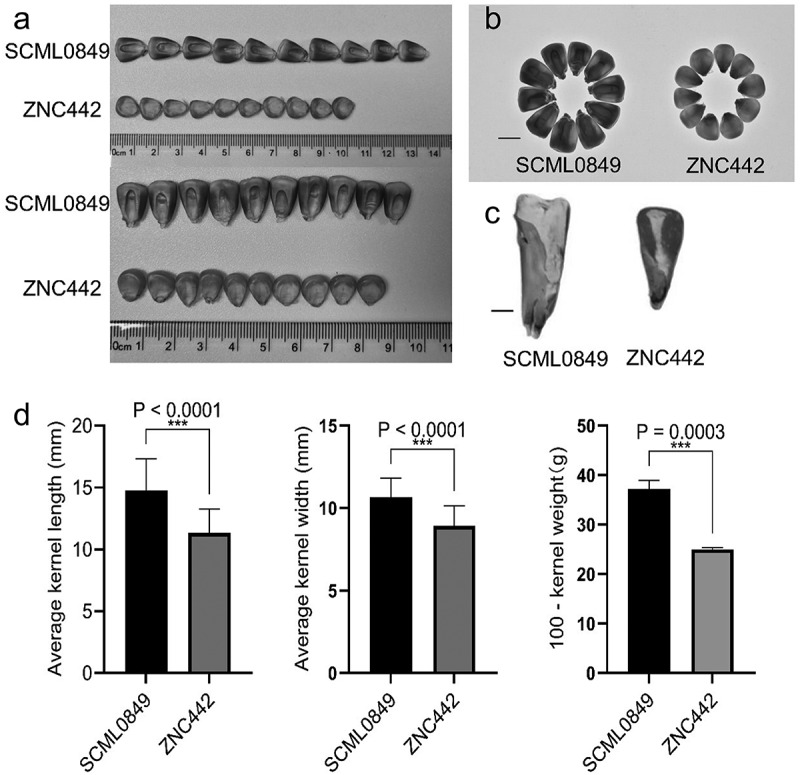 Figure 2
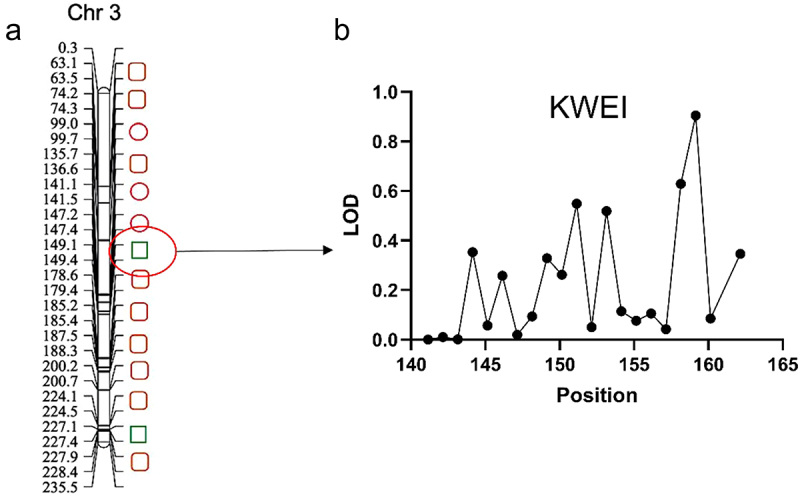 Figure 3
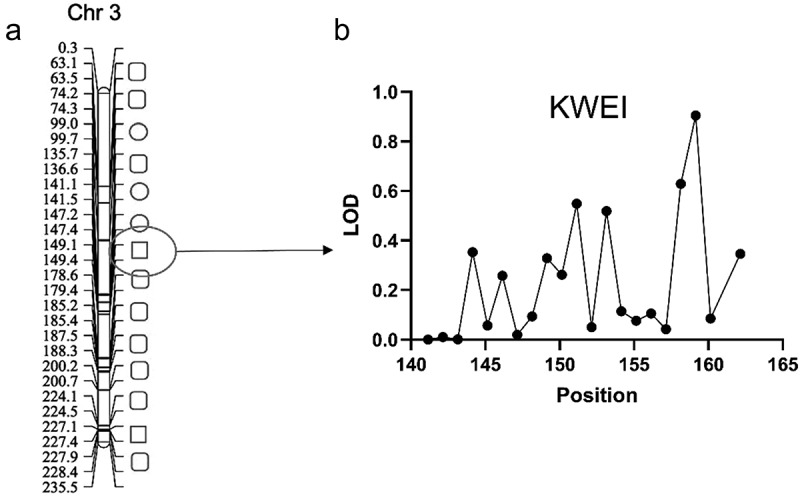 Figure 4
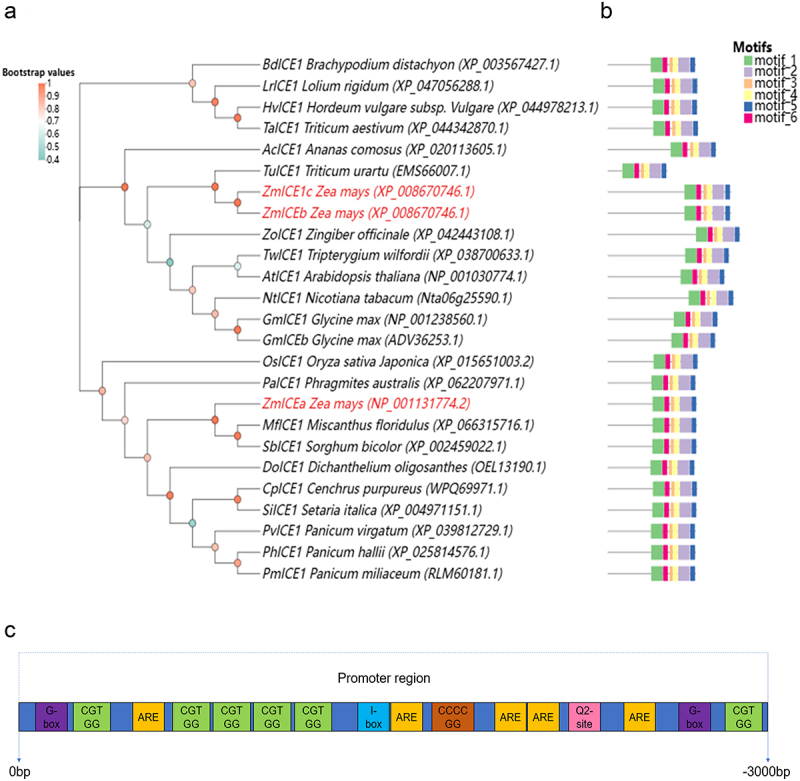 Figure 5
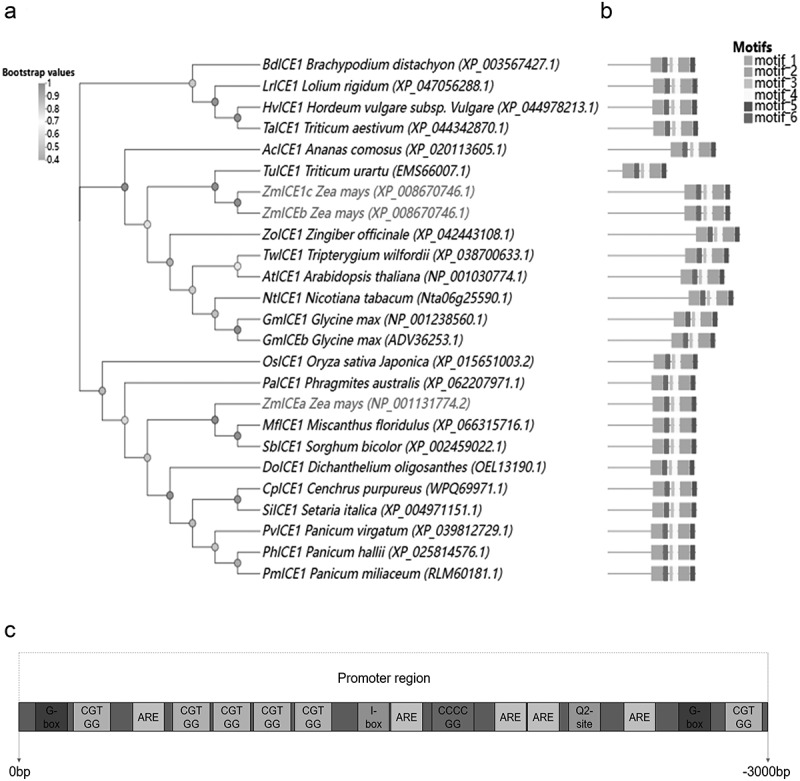 Figure 6
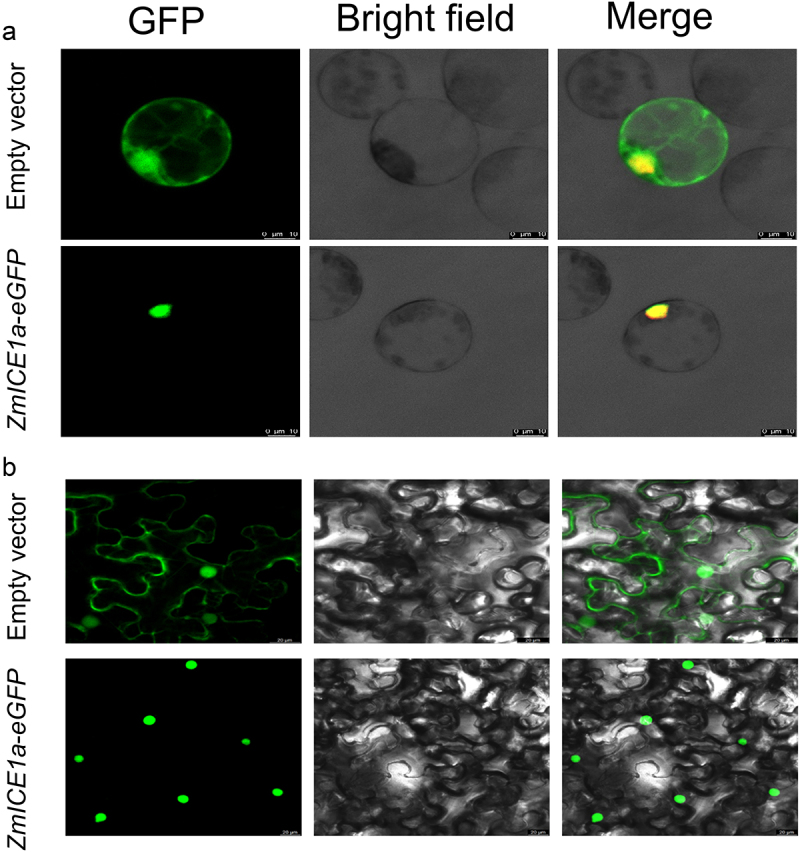 Figure 7
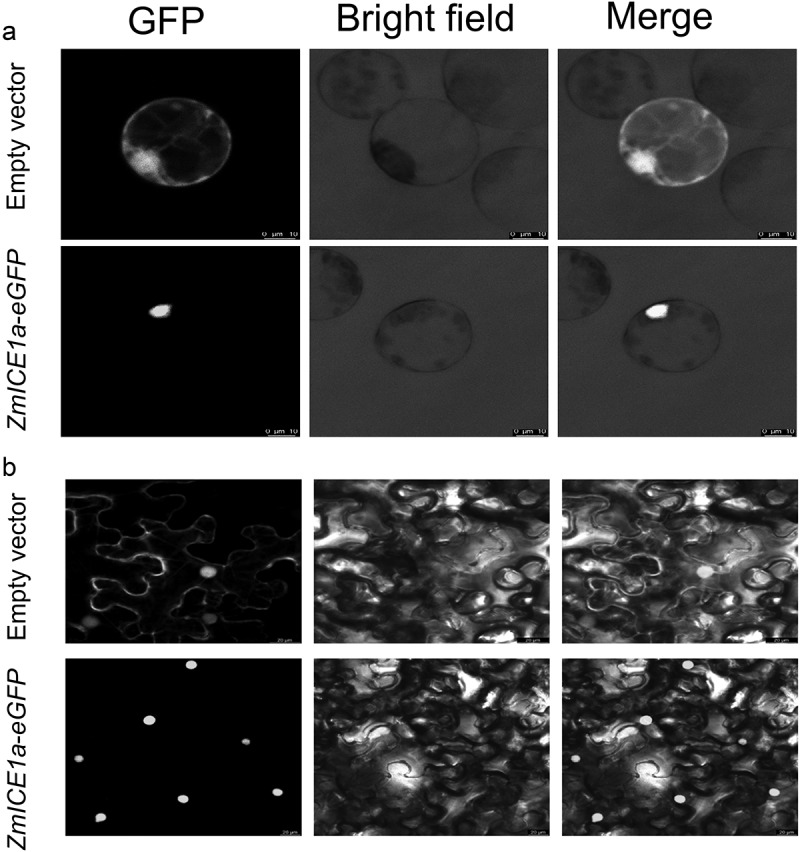 Figure 8
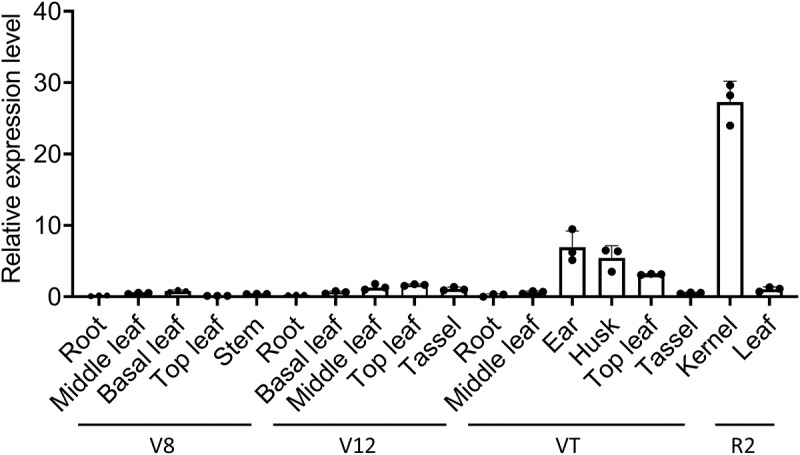 Figure 9
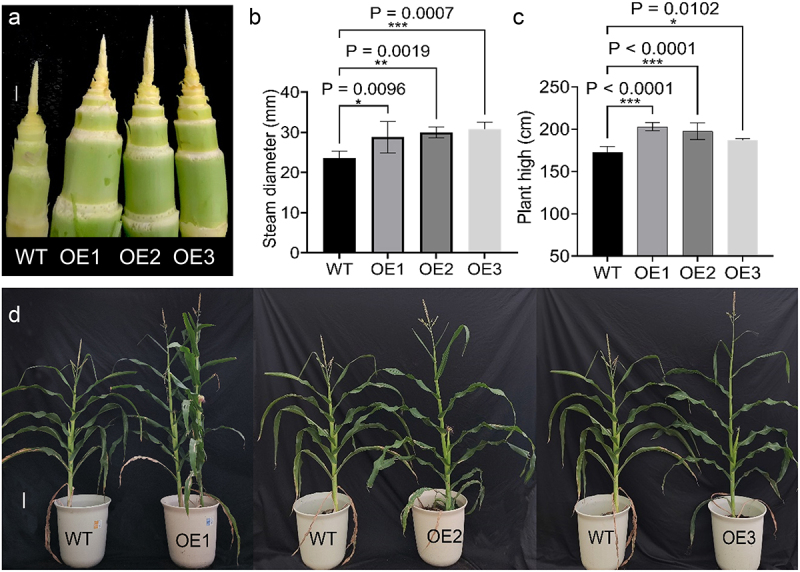 Figure 10
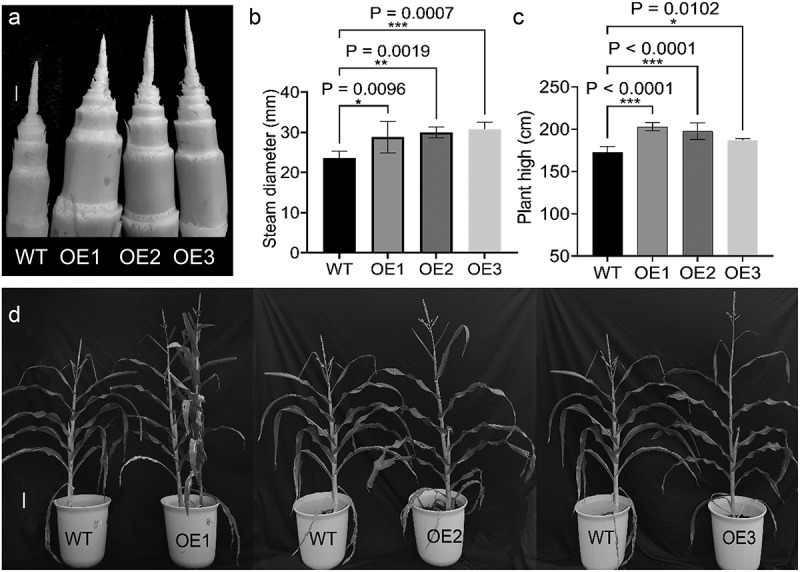 Figure 11
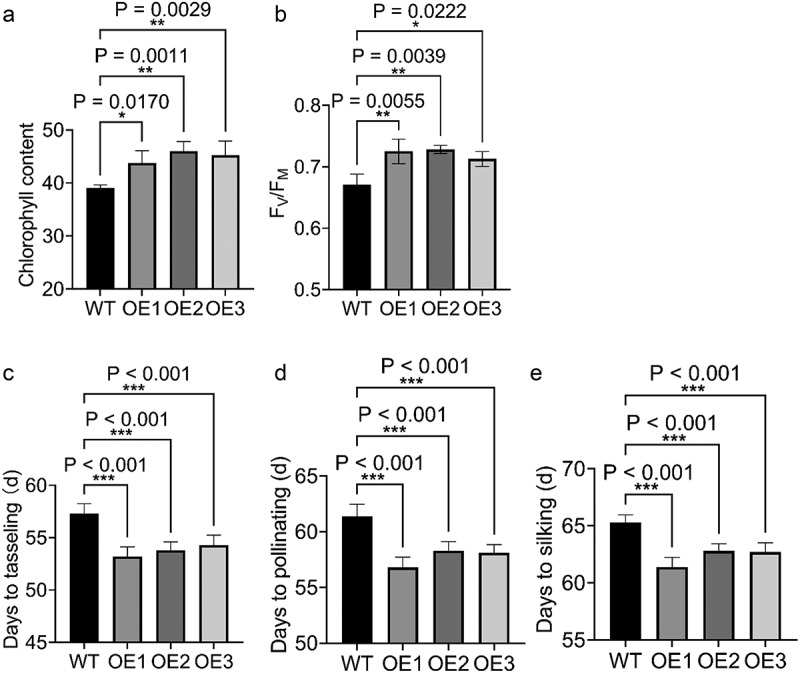 Figure 12
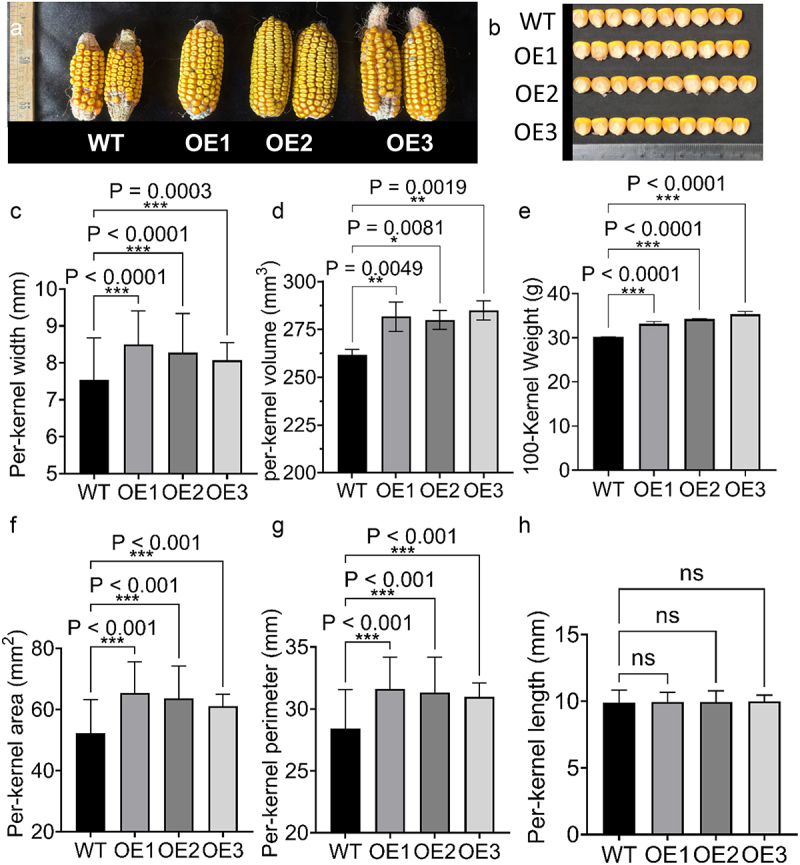 Figure 13
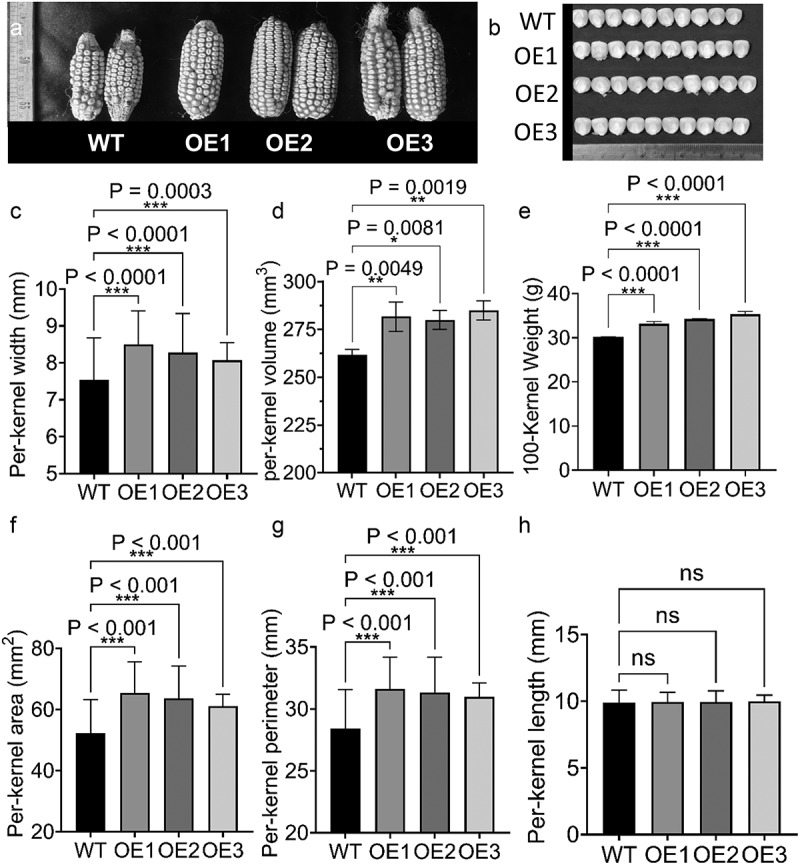 Figure 14
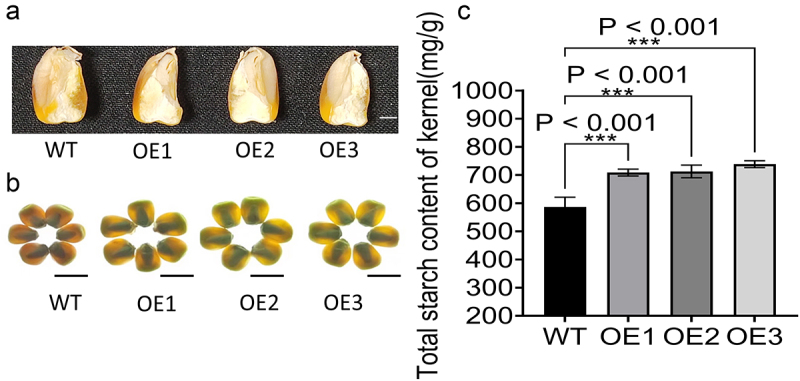 Figure 15
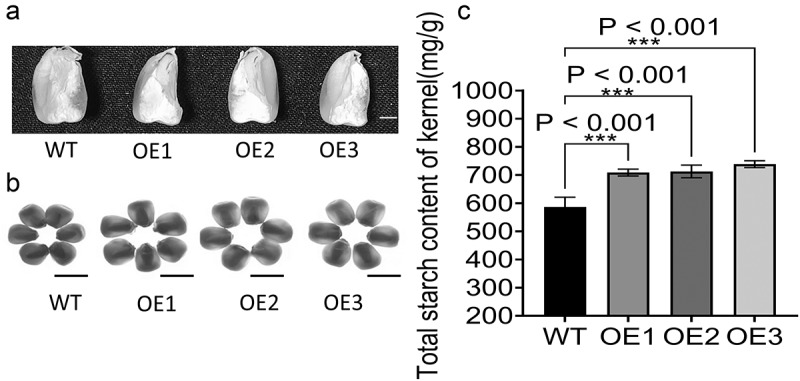 Figure 16
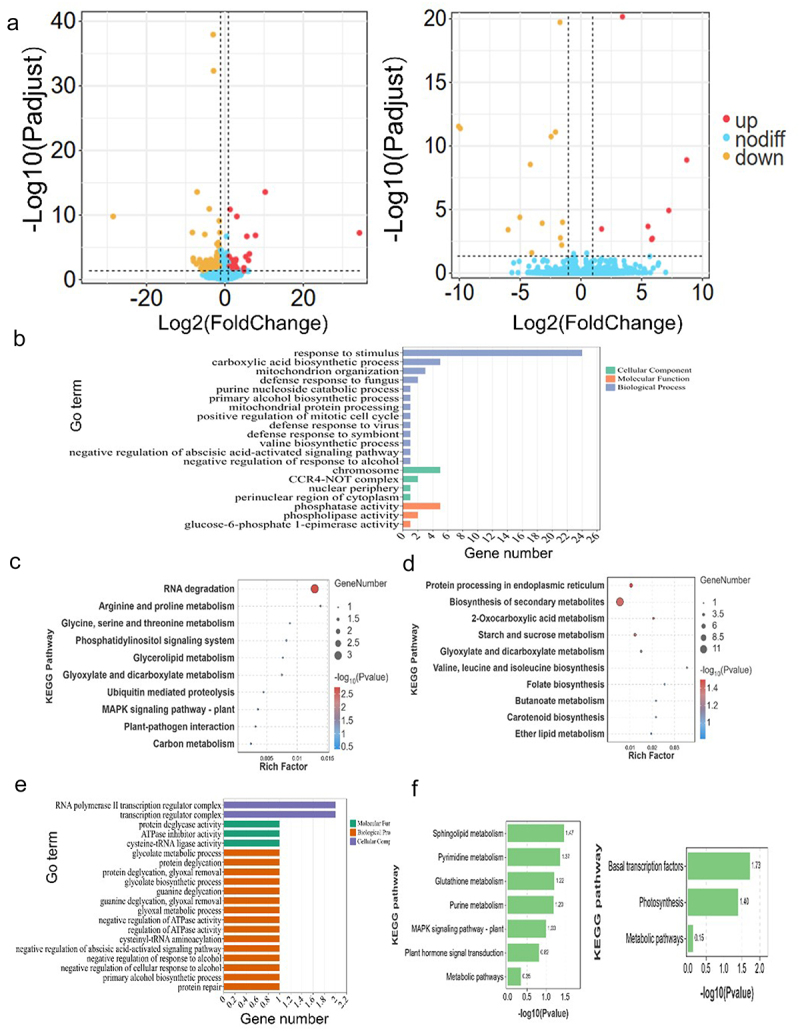 Figure 17
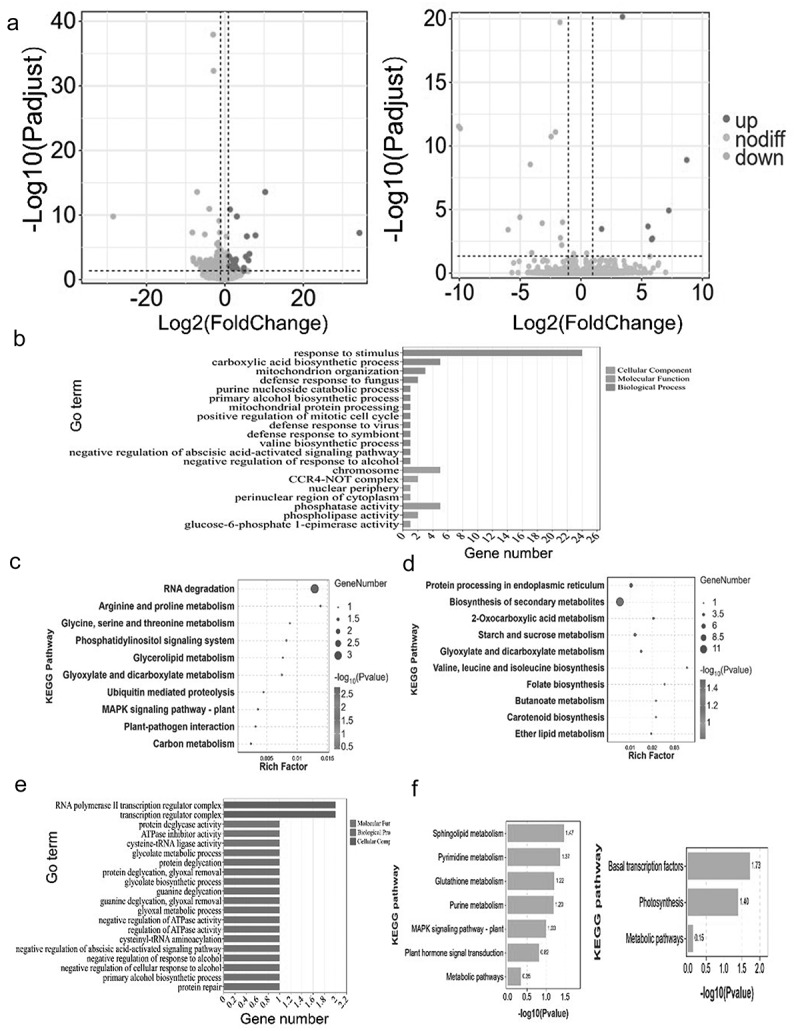 Figure 18
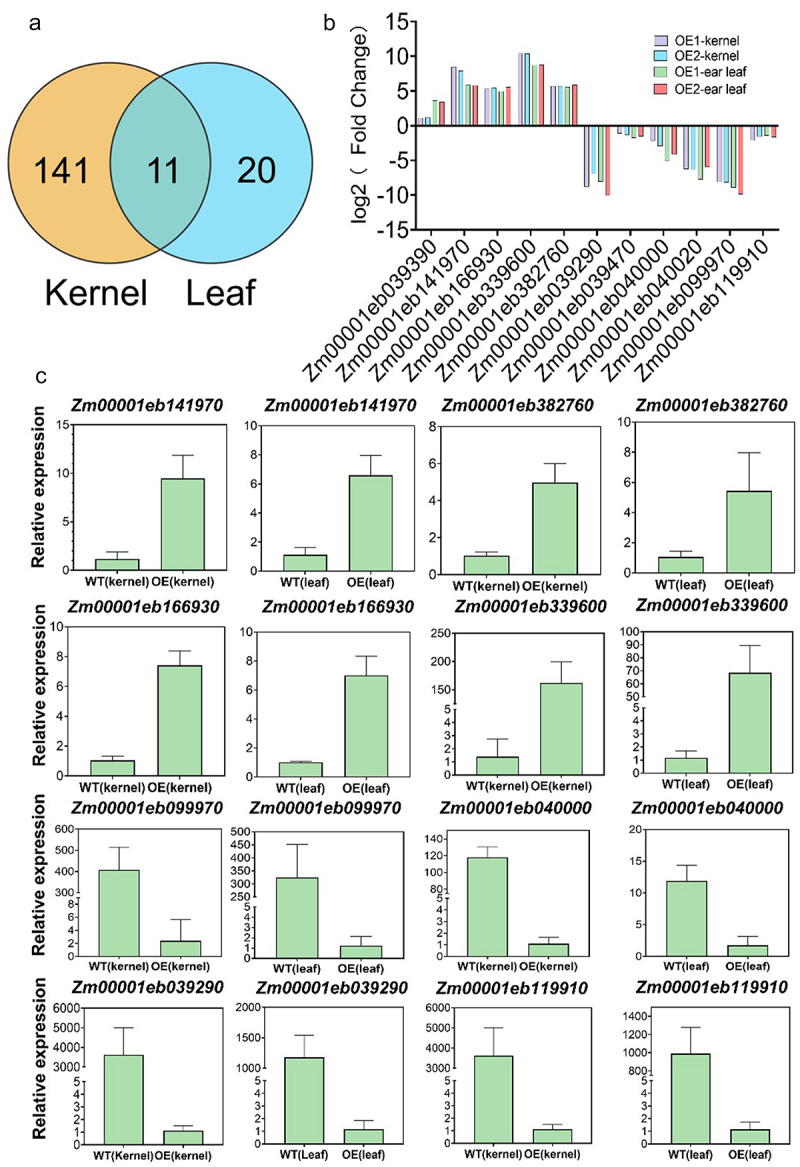 Figure 19
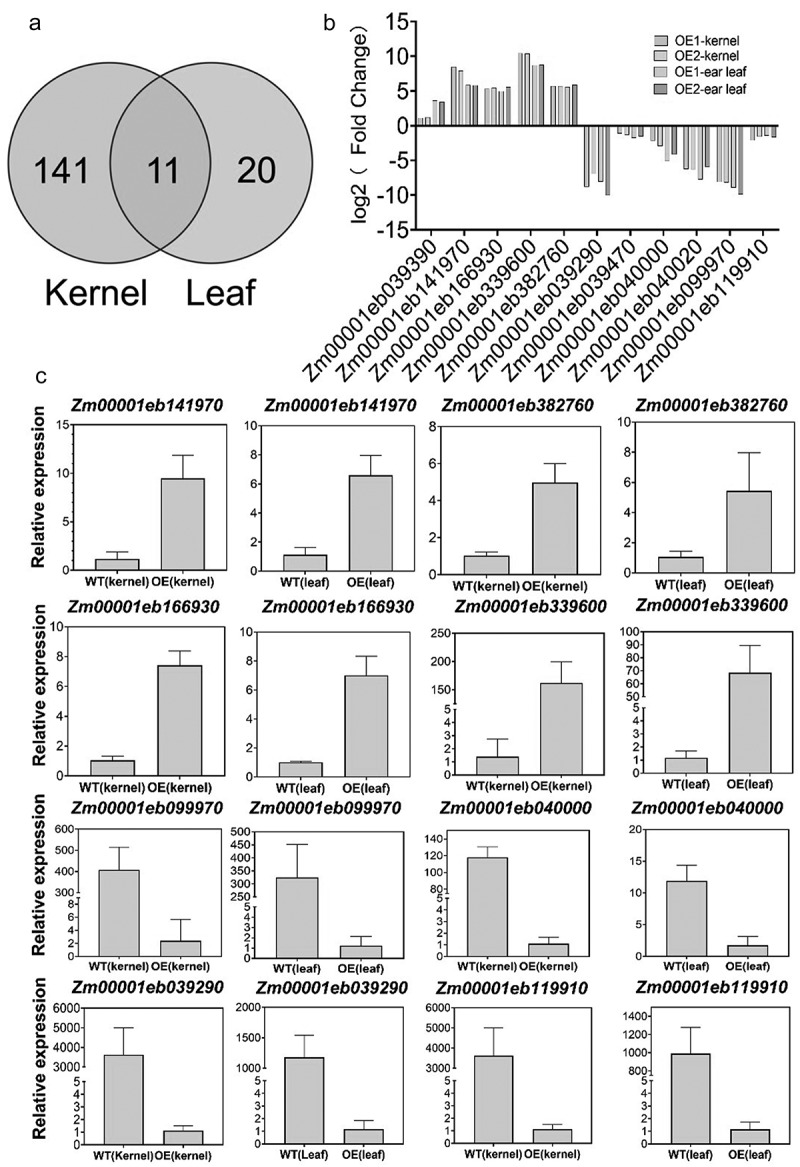 Figure 20
- —National Natural Science Foundation of China10.13039/501100001809
- —National Key Research and Development Program of China10.13039/501100012166
- —Guizhou Provincial Science and Technology Plan Project
- —Guizhou Provincial Science and Technology Plan Project
- —Innovation Capacity Construction of Breeding Scientific Research Platform in Guizhou Province
- —Youth Science Foundation Project of Guizhou Academy of Agricultural Sciences
- —Construction of Genetic Transformation Platform for Dryland Grain Crops in Guizhou Province
- —Guizhou Academy of Agricultural Sciences Guojihou Subsidy
- —Innovation Capacity Construction of Biological Breeding for Specialty Crops in Karst Mountainous Areas
- —Construction of Scientific Research Capacity and Conditions for the Provincial Key Laboratory of Biological Breeding of Characteristic Grain and Oil Crops in Karst Mountainous Areas
Peer Reviews
No public reviews on file for this paper yet. If you reviewed it on a platform where reviews are public (OpenReview, ICLR, NeurIPS, ICML), you can paste yours below so the community can read it here.
Videos
No videos yet. Explain this paper in a talk, walkthrough, or lecture? Add one.
Taxonomy
TopicsCrop Yield and Soil Fertility · Rice Cultivation and Yield Improvement · Genetic Mapping and Diversity in Plants and Animals
Introduction
Maize is a major food crop grown worldwide. The extensive application of maize in animal husbandry, as an industrial raw material, and in the food-processing industry underscores its importance for global food security and economic development.^1^ Consequently, boosting maize yields is crucial for enhancing human quality of life and remains a primary objective of current maize breeding programs.^2^ Maize kernel traits are important contributors to yield, including kernel length and width, 100-kernel weight, protein content, and starch content.^3^ Clarification of the genetic and developmental mechanisms of kernel traits is beneficial for the rapid development of new high-yielding varieties.^4^
In recent decades, many genetic loci and candidate genes associated with kernel traits have been reported by mapping quantitative trait loci (QTLs) or through genome-wide association studies (GWAS).^5,6^ Liu et al.^7^ identified 12 QTLs associated with maize kernel size and weight, accounting for 10% of the total phenotypic variation. Zhang et al.^8^ identified 19 common QTLs and 18 significant single-nucleotide polymorphisms (SNPs) associated with maize kernel size. Liu et al.^9^ identified a critical gene, ZmINCW1, associated with kernel size and weight. Further research showed that overexpression of ZmINCW1 reduces seed weight.^9^ Map-based cloning revealed that one kernel size-related gene, qwk9, encodes a pentatricopeptide repeat protein, and influences photosynthesis and grain filling.^10^
In addition, many genes associated with maize kernel development have been identified using homology searches or mutant-based cloning.^10^ Using the maize kernel mutant defective kernel 42, the dek42 gene was cloned and shown to significantly disrupt the expression of thousands of genes during kernel development, resulting in small, defective kernels.^11^ Utilizing a different maize small-kernel mutant, the smk501 gene was cloned and shown to encode a RUBylation-activating enzyme E1 subunit ZmECR1 (E1 C-TERMINAL RELATED 1) protein, and affected kernel development by regulating AUX/IAA degradation.^12^ These genes cloned from mutants usually have critical functions in important developmental processes and may cause lethality. Thus, it is difficult to utilize these genes effectively in breeding. Therefore, gene mining by map-based cloning and investigation of weak mutations remains invaluable.
In our previous research, we mapped a critical QTL, qKWEI3.1, associated with maize kernel weight using a population of F_2:3_ progeny derived from the parental lines SCML0849 and ZNC442.^13^ In the present study, 419 SNPs located within 8 Mb adjacent to this QTL were used to narrow the genetic location and clone a candidate gene for ZmICE1a (ZmbHLH175). Recently, Wang Q et al.^14^ generated loss-of-function mutants of ZmICE1a using CRISPR/Cas9 and found that ZmICE1a plays a crucial regulatory role in the endosperm defense response and coordinates the balance between defense and storage during endosperm development through the JA-ZmJAZ9-ZmICE1a-MPI signaling pathway. Coincidentally, in our research, the functions of ZmICE1a were dissected by integrating overexpression (OE) and transcriptome analysis. The objectives of the study were as follows: 1) fine map the QTL qKWEI3.1; 2) dissect the positive function of ZmICE1a in meliorating maize kernel width, 100-weight, and starch content; 3) elucidate the function of ZmICE1a in the early reproductive phase, and in increasing the plant height, stem diameter, and photosynthetic efficiency; and 4) analyze the regulatory network of ZmICE1a and other genes involved in kernel development. The results provide an important genetic basis for the improvement of yield in maize breeding programs.
Materials and methods
Plant materials
For fine mapping of the QTL qKWEI3.1, a population of F_2:3_ lines derived from the parental lines SCML0849 and ZNC442 was used.^13^ For function analysis of ZmICE1a, the maize inbred lines B104 were used as the wild type (WT) and OE lines were generated from the B104 inbred line.
Fine mapping of the QTL qKWEI3.1
In this study, one F_2:3_ population comprising 133 lines was selected. A total of 410 SNP markers located within an 11 Mb interval adjacent to qKWEI3.1 were selected (Table S2). QTL analyses of F_2:3_ for the interval were conducted using inclusive composite interval mapping (ICIM)in QTL IciMapping software Version 4.1.^15^ Using the B73 reference genome (version 4), a bioinformatics analysis was conducted by utilizing the public database MaizeGDB (https://www.maizegdb.org.) to identify candidate genes.
Cloning of ZmICE1a
Total RNA was extracted using the TRIzol Reagent (Takara, Dalian, China) and treated with DNase to remove contaminant genomic DNA. The PrimeScript™ 1st Strand cDNA Synthesis Kit (Takara) was used for the cDNA synthesis in accordance with the manufacturer’s instructions. Primers were designed with SnapGene® 6.0.2 (GSL Biotech LLC, San Diego, CA, USA) based on the maize B73 reference genome V4 accessed in MaizeGDB (https://www.maizegdb.org.) (Table S1). The CDS sequences of ZmICE1a from B73, B104, ZNC442, and SCML0849 were cloned. The PCR products were verified by 1% agarose gel electrophoresis and purified using the DNA Gel Purification Kit (UElandy, Suzhou, China). The purified target fragment was cloned into Escherichia coli strain DH5α cells using the Lethal Based Simple Fast Cloning Kit (Tiangen Biotech, Beijing, China). Single colonies were verified by colony PCR and authenticated by 1% agarose gel electrophoresis, then positive clones were sequenced by Sengon Biotech (Shanghai, China).
Genetic structure analysis of ZmICE1a
The CDS sequences of ZmICE1a from B73, B104, ZNC442, and SCML0849 were first aligned using SnapGene® 6.0.2 (GSL Biotech LLC, San Diego, CA, USA), and their deduced amino acid sequences were compared. The coding sequence (CDS) of ZmICE1a cloned from B104 was used as the query in a BLAST search of the National Center for Biotechnology Information databases (NCBI; https://www.ncbi.nlm.nih.gov/.) and Nicotiana benthamiana and Nicotiana tabacum omics databases (Nicomics) to detect homologs in other plant species, including rice, wheat, Arabidopsis, Nicotiana tabacum, and so on. The obtained sequences were aligned using the ClustalW algorithm and a phylogenetic tree was constructed with MEGA Version 11 using the Neighbor-joining model. Sequence motif analysis was performed using the online MEME tool (https://meme-suite.org). Visualization of the phylogenetic tree and motif analysis was amalgamated using ChiPlot (https://www.ChiPlot.online). The 3000 bp sequence upstream of the ZmICE1a promoter was extracted from B73 reference genome V4 accessed in MaizeGDB (https://www.maizegdb.org.) and the genetic structure was predicted using the PlantCARE database (https://bioinformatics.psb.ugent.be/webtools/plantcare/.).
Subcellular localization
To further evaluate the function of the protein encoded by ZmICE1a, the subcellular localization of ZmICE1a was assessed. The CDS of ZmICE1a was inserted into the PCAMBIA2300-35S-eGFP vector. The construct and the empty vector were transiently expressed in maize protoplasts and tobacco leaves, using a helium biolistic gun transformation system (Bio-Rad, Hercules, CA, USA). The GFP signal was visualized and captured using a confocal laser scanning microscope (Leica TCS SP5, Mannheim, Germany) with excitation at 488 nm.
Expression pattern analysis of ZmIce1a
For the B104 inbred line, different tissues were collected at four developmental stages, namely, jointing (V8), booting (V12), tasseling (VT), and grain filling (R2), based on a previous description of growth stages.^16^ Total RNA was extracted and cDNA was synthesized as described above. Quantitative real-time PCR (qPCR) was used to determine the expression level of ZmICE1a, using ZmACTIN2 as the internal reference gene, for three independent biological samples. All primers were designed using the PrimerQuest Tool (https://sg.idtdna.com/pages.) (Table S1). The fold difference (2^−∆∆Ct^) and relative expression levels were calculated using CFX Manager Software v1.5 (Bio-Rad).
Generation of ZmIce1a-overexpressing plants
The cDNA fragment of ZmICE1a was submitted to Wimi Biotechnology Co., Ltd. (Changzhou, China). The cDNA fragment was inserted downstream of the ubiquitin promoter to construct transgenic lines. Thereafter, the company conducted a series of meticulous experimental procedures to generate T1 seeds as follows. First, primers were designed based on the vector and the ZmICE1a cDNA template sequence. The upstream primer F combined the upstream 16 bp of the ZmICE1a cDNA template with the 16 bp upstream recombination arm, while the downstream primer R combined the downstream 16 bp of the template with the 16 bp downstream recombination arm.
Next, a 2×Rapid Taq Master Mix (Vazyme, Nanjing, China) was implemented in a 50 μL PCR reaction system. After completion of the PCR reaction, 3 μL of the product was analyzed by electrophoresis to verify the amplification of the correct fragment. If the correct band was observed, the target fragment was recovered using the FastPure Gel DNA Extraction Mini Kit DC301 kit (Vazyme, Nanjing, China) stock solution. The recombinant plasmid was transformed into E.coli DH5α cells and validated through colony PCR sequencing. Upon confirming the sequence accuracy, the vector plasmid was introduced into Agrobacterium tumefaciens strain EHA105 via electroporation and further identified by PCR.
For the transformation, freshly dissected immature maize embryos, approximately 1 mm in size, were used. The isolated maize embryos were placed in a 2 mL plastic centrifuge tube containing 1.8 mL of infection buffer, with approximately 150 immature embryos processed over a 30-min period. The infection buffer was removed, then 1.0 mL Agrobacterium suspension was added and the mixture was incubated for 5 min. The embryos were gently poured onto the co-culture medium, and any excess Agrobacterium suspension on the surface was removed. The embryos and Agrobacterium were co-cultured in the dark at 23°C for 3 days. Then, the embryos were transferred to a resting medium and incubated in the dark at 28°C for 6 days. The embryos were then transferred to a screening medium supplemented with dialaphos for an initial 2-week screening, then incubated for an additional 2 weeks on a fresh screening medium. The antibiotic-resistant calli were transferred to a differentiation medium and cultured at 25°C under a light intensity of 5000 l×for 3 weeks. The differentiated seedlings were subsequently transferred to the rooting medium and incubated under the same environmental conditions until roots formed. The rooted seedlings were transplanted into small pots for further growth and subsequently transferred to the greenhouse. After growth for 3–4 months, seeds were harvested for subsequent analysis.
The T_0_ transgenic plants were genotyped using primers for the marker gene in the vector (Table S1). The expression level of ZmICE1a in positive transgenic lines was assessed by qPCR as described above. After repeated selfing, three homozygous T_3_ lines were selected and designated ZmICE1a-overexpressing lines 1, 2, and 3 (hereafter OE1, OE2, and OE3). Uniform, healthy kernels from the three T_3_ OE lines and the relevant WT (B104) were grown in an experimental field at Le Dong (LD; 18.24°N, 108.39°E, Hainan Province, China) from October 2023 to March 2024, and cultivated in greenhouses located in Gui Yang (GY; 26.11°N, 106.7°E, Guizhou Province, China) from March 2024 to August 2024. Phenotypic analyses were carried out at both locations.
Phenotypic analysis of ZmIce1a-overexpressing plants
Phenotypic traits for the OE lines and WT were recorded, comprising the stem size of plants at the V8 stage, plant height, days to tasseling (DTT), days to pollen shedding (DTP), days to silking (DTS), and chlorophyll content were measured at the VT stage. Each trait was measured on five plants. Mature grains were harvested and dried, and then kernel traits, including the kernel weight, length, and width, were measured using the SC-G software (Wanshen Detection Technology Co., Ltd., Hangzhou, China). Twenty uniform kernels were randomly selected, and submerged in a 100 ml graduated cylinder containing 20 ml water, and the change in water level was recorded to calculate the individual kernel volume. The maximum quantum efficiency of photosystem II (FV/FM) of ear leaves was estimated using an OS30p+ Chlorophyll Fluorometer (OPTI-SCIENCES Inc., Hudson, NH, USA). All photosynthesis measurements were performed with three biological replicates.
Starch content assay
The starch content of kernels from ZmICE1a-overexpressing and WT plants was determined as described by Clegg^17^ using the Starch Content Assay Kit (Solarbio Science and Technology, Beijing, China) following the manufacturer’s instructions. For each OE line and the WT, measurements were performed with three biological replicates. The experimental samples and standard samples from the Starch Content Assay Kit were analyzed using a microplate reader. The standard curve generated from the standard samples is presented in Table S2. Subsequently, the starch content was calculated according to the provided formulas.
Transcriptome analysis of ZmIce1a-overexpressing plants
To elucidate the regulatory network involving ZmICE1a, transcriptome analysis was performed using RNA sequencing (RNA-Seq). The ear leaves and kernels in central ears were sampled from WT, OE1, and OE2 plants grown in the greenhouse. Samples from three individual plants were collected 14 days after pollination and pooled. Transcriptome analysis was performed by JiYu Technology Co., Ltd. (Chengdu, China). Adapter sequences and low-quality reads were filtered using FastQC (http://www.bioinformatics.babraham.ac.uk/projects/fastqc/). Subsequently, the cleaned reads were mapped to the maize Zm-B73-REFERENCE-NAM-5.0 reference genome using HISAT. Differentially expressed genes (DEGs) were identified by comparing the gene expression levels between the OE and WT samples. The DEGs were screened using the following criteria: fold change ≥ 2.00 and p-value ≥0.8, with a significant false discovery rate-adjusted p-value <0.05 based on three biological replicates. The identified DEGs were subjected to Gene Ontology (GO) and Kyoto Encyclopedia of Genes and Genomes (KEGG) pathway enrichment analyses using the clusterProfiler version 3.8 R package and the OmicShare online tool (https://www.omicshare.com/tools/).^18^ The transcriptome data were visualized with the OmicShare (https://www.omicshare.com/tools.) and ChiPlot (https://www.ChiPlot.online) online tools.
Statistical analysis
One-way analysis of variance was conducted using GraphPad Prism 9.0 (GraphPad, San Diego, CA, USA) to perform multiple comparisons.^19^ A significance level was established consistent with the New England Journal of Medicine policy for P-values.^20^ Student’s t-test was employed for pairwise comparisons with the significance threshold set to p < 0.05. All presented data are mean values derived from independent experiments.
Results
Fine mapping of the QTL qKWEI3.1
Using an F_2:3_ population derived from parents with contrasting kernel phenotypes (large-kernel floury inbred SCML0849 × small-kernel flint inbred ZNC442) (Figure 1), our prior work mapped qKWE3.1—a major QTL controlling 100-kernel weight in maize – to a 0.3 Mb interval on chromosome 3 (Figure 2(a)).^13^ Fine-mapping was performed using 410 additional markers spanning an extended region (141–162 Mb). High-resolution linkage analysis resolved a distinct peak LOD score at 159.1419 Mb (Figure 2(b); Table S3). Screening of candidate genes within ± 400 kb of this peak identified ZmICE1a as the only gene with known functional relevance to kernel development (Table 1). Based on its positional priority and functional annotation, ZmICE1a was prioritized for functional validation. Figure 1.The kernel relative traits of ZNC442 and SCML0849 inbred lines. (a) The kernel pictures of ZNC442 and SMCL0849. (b) Kernel phenotypes observed on a lightbox ZNC442 and SMCL0849. Bar=10 mm. (c) Longitudinal sections of ZNC442 and SMCL0849. Bar=2 mm. (d) Kernel relative traits of ZNC442 and SMCL0849 including Average kernel length, Average kernel width, 100-kernel weight. Figure 2.Fine Mapping and Candidate Gene Identification for Maize Kernel Weight (KWEI) on Chromosome 3 (Chr 3). (a) Red circle represents markers used in the first-round mapping, identifying a 0.3 Mb interval containing qKWE3.1.^13^ (b) Green square represents KWEI.Table 1.Candidate genes in the interval.IDDescriptionZm00001d042263bHLH transcription factor, own-regulates starch synthesisZm00001d042264UnknowZm00001d042265UnknowZm00001d042266UnknowZm00001d042267ARF-transcription factor 10Zm00001d042268coryne1, involved in shoot apical meristem (SAM) developmentZm00001d042269pza00827, DNAJ heat shock N-terminal domain-containing proteiZm00001d042270UnknowZm00001d042271Trihelix-transcription factor 30,Zm00001d042272putative histone-lysine N-methyltransferase family protein, candidate gene for kernel number per rowZm00001d042273UnknowZm00001d042274cl615_-1, phosphatidylinositol transfer protein CSR1Zm00001d042275cl615_-3, phosphatidylinositol transfer protein CSR1Zm00001d042276putative beta-14-xylosyltransferase IRX10LZm00001d042277PAP1, inositol polyphosphate multikinase IPK2-likeZm00001d042278UnknowZm00001d042279beta-1,4-xylosyltransferase4Zm00001d042280UnknowZm00001d042281beta-1,4-xylosyltransferase2Zm00001d042282Aldolase-type TIM barrel family proteinZm00001d042283UnknowZm00001d042284pco085637a, RING/U-box superfamily protein
Cloning and sequence analysis of the candidate gene ZmIce1a
Gene sequence analysis confirmed ZmICE1a CDS presence in all four inbred lines (Figure S1A), but revealed critical structural and functional divergences: B73 exhibited a 40bp CDS deletion (Figure S1A). SCML0849 and B104 showed 100% identical CDS sequences with zero variations across the entire coding region (Supplementary Figure S2). ZNC442 harbored six non-synonymous mutations in its CDS – specifically 300(G→C), 678(C→T), 699(G→A), 757(C→T), 874(T→G), and 979(G→A)(Supplementary Figure S2) – resulting in four amino acid substitutions compared with SCML0849: 114(Alanine→Proline), 253 (Phenylalanine→Leucine), 292(Alanine→Serine) and 327 (Leucine→Valine) compared with SCML0849 (Supplementary Figure S3).
Sequence alignment and phylogenetic analysis indicated that ZmICE1a was clustered on a separate branch alone and had a relatively close phylogenetic relationship with sorghum and Miscanthus floridulus. Meanwhile, ZmICE1b and ZmICE1c were clustered together, and their phylogenetic affinity was closer to Triticum Urartu. Furthermore, ZmICE1b and ZmICE1c were grouped into a large category with dicotyledonous plants such as Arabidopsis thaliana, Nicotiana tabacum, and Glycine max. (Figure 3(a)). Motif analysis revealed that homologs of ZmICE1a are extremely conserved across monocotyledonous plants and share most of the same motif location. While the motifs of ZmICE1b and ZmICE1c are extremely similar. (Figure 3(b)). These results suggest that definite evolutionary disparities and divergences exist between ZmICE1a and ZmICE1b/ZmIC1Ec and ZmICE1a may perform similar functions in monocotyledonous plants. Figure 3.Bioinformation analysis of ZmICEa. (a) Phylogenetic analysis of ICE1 homologous genes from rice, tobacco, Arabidopsis, wheat, and so on. (b) Prediction of motifs in ICE1 homologs. (c) Identification of cis-elements in the promoter region of ZmICE1a. The color blocks indicated the different cis-elements (Purple: G-box; Green: CGTGG; Yellow: ARE; Baby blue: I-box; Brown: CCCCGG; Pink: O_2_-site).
The 3000 bp sequence upstream of ZmICE1a was extracted to analyze the structure of the ZmICE1a promoter. Six specific cis-acting regulatory elements were identified, comprising I-box, G-box, AU-rich (ARE), and O2-site elements, and two unnamed elements, CGTGG and CCCCGG (Figure 3(c) and Table S4). The I-box and G-box elements are involved in light response.^21,22^ The ARE sequence is a cis-acting regulatory element essential for anaerobic induction.^23^ The O2-site is involved in the regulation of zein metabolism, which is a major constituent of the maize endosperm.^24^ These results suggest that ZmICE1a may be involved in light response, antimicrobial interaction, and seed development in maize.
Subcellular localization of ZmIce1a
Subcellular localization analysis showed that the fusion protein ZmICE1a-eGFP was detected only in the nucleus in maize protoplasts and tobacco leaf cells, whereas the fluorescence signal of the empty vector was detected throughout the protoplast (Figure 4). Therefore, it can be concluded that ZmICE1a may function in the nucleus, consistent with the function of a transcription factor. Figure 4.Subcellular localization of ZmICE1a. A-B Subcellular localization of ZmICE1a-eGFP in maize protoplasts (a) and Subcellular localization of tobacco leaf epidermal cells (b). GFP: Green Fluorescent signal; RFP: Red Fluorescent signal. Scale bars = 10 μm in (a) and 20 μm in (b).
Expression pattern of ZmIce1a
The expression levels of ZmICE1a varied significantly among tissues at various maize developmental stages (Figure 5). Notably, ZmICE1a was highly expressed in the kernel tissue at the R2 stage when kernels began to form. These results suggest that ZmICE1a is closely associated with maize growth and development, and may play important roles in kernel formation. Figure 5.The relative expression levels of ZmICE1a in different tissues at V8, V12, VT, and R2 stages.
Phenotypic analysis of ZmICE1a-overexpressing and WT plants
Among a total of 12 lines of T_0_ plants, 10 positive transgenic lines were identified (Fig. S4A). Relative expression levels were assessed using the qPCR method. Expression levels of ZmICE1a in OE1, OE2, and OE3 plants were significantly higher than those of WT plants (Fig. S4B, C). In addition, T_0_ plants of the OE1 and OE2 lines produced higher biomass than WT plants (Fig. S4D). Plants of the OE1, OE2, and OE3 lines were repeatedly selfed to generate T_3_ homozygous lines. Phenotypic analysis of the T_3_ homozygous lines was conducted in both field and greenhouse environments. Compared with WT plants, the T_3_ OE lines exhibited a more robust phenotype, such as enhanced aboveground architecture (Fig. S4D), thicker stems (Figure 6(a,b)), and an increase in plant height (Figure 6(c,d)). Given that ZmICE1a was predicted to be involved in light response (Figure 3(c)), we wondered if the stronger plants reflected higher photosynthetic efficiency in the OE lines. The chlorophyll content and FV/FM in ear leaves of the OE lines were significantly higher than those of WT plants (Figure 7(a,b)), suggesting that the higher chlorophyll content might account for the increase in photosynthetic efficiency. Consequently, we concluded that overexpression of ZmICE1a enhanced the photosynthetic efficiency, resulting in a more robust phenotype compared with that of WT plants. Figure 6.The phenotypes of OE lines and WT plants. (a) The maize internodes OE plants after seeding 60 days. Bar=1 cm. (b) The steam diameter of OE plants after seeding 60 days. (c) The plant height of mature OE plants. (d) The pictures of different OE lines at the VT stage. Scale bars = 1 cm in (a) and 10 cm in (d). The significant differences are determined by Dunnett’s Multiple Comparisons Test and marked with NEJM (New England Journal of Medicine) style of P-value (* P<0.033, ** P<0.002, and *** P<0.001). Figure 7.The index of photosynthetic efficiency and flowering-time traits of WT and OE lines. The chlorophyll content (a) and the F_V_/F_M_ (b) of ear leaves. c-e The flowering-time traits including the days to tasseling (c), the days to pollinating (d), and the days to silking (e). The significant differences are determined by Dunnett’s Multiple Comparisons Test and marked with NEJM (New England Journal of Medicine) style of P-value (* P<0.033, ** P<0.002, and *** P<0.001).
Furthermore, the OE plants grew more rapidly and entered the reproductive phase earlier than WT plants. Evaluation of flowering-time traits showed that DTT, DTS, and DTP of OE plants were less than those of WT plants (Figure 7(c–e)). These results indicated that overexpression of ZmICE1a accelerated the transition from vegetative to reproductive growth, and thus ZmICE1a might be associated with auxin mediation of this developmental change.
Overexpression of ZmIce1a meliorates kernel traits of maize
Mature ears of OE and WT plants growing in the field and greenhouse were harvested. Compared with WT plants, OE plants had larger ears and kernels (Figure 8(a,b)). Statistical analysis of the kernel traits revealed that kernel width, 100-kernel weight, kernel volume, kernel area, and kernel perimeter (Figure 8(c–g)) were significantly increased compared with those of WT plants, while there was no significant difference in kernel length. (Figure 8(h)). In addition, the OE plants’ kernels were floury than those of the WT (Figure 9(a,b)), suggesting that the kernels may have a higher starch content. As predicted, the total starch content was significantly higher in OE plants than in the WT (Figure 9(c)). Considering the foregoing results, we concluded that overexpression of ZmICE1a may promote maize plant growth by improving photosynthetic efficiency, thereby meliorating kernel traits. Figure 8.The ear phenotypes and kernel relative traits of WT and OE lines. (a) The ear pictures of different OE lines. (b) The kernel pictures of OE lines. c-g Kernel relative traits of OE lines including per-kernel width (c), 1000-kernel weight (d), per-kernel volume (e), per-kernel area (f), per-kernel perimeter (g), and per-kernel length (h). Figure 9.Starch concentration analysis of kernels. (a) Longitudinal section of OE lines. Bar=2 mm. (b) Kernel phenotypes observed on a lightbox. Bar=10 mm. (c) Total starch content of kernel of OE lines. The significant differences are determined by Dunnett’s Multiple Comparisons Test and marked with NEJM (New England Journal of Medicine) style of P-value (* P<0.033, ** P<0.002, and *** P<0.001).
Functional enrichment analysis of differentially expressed genes
To dissect the molecular mechanisms underlying ZmICE1a function, we employed RNA-Seq to analyze the transcriptome of developing kernels and ear leaves. A total of 141 DEGs were identified in developing kernels of ZmICE1a-overexpressing plants, compared with those of the WT, of which 19 and 122 genes were up-regulated and down-regulated, respectively (Figure 10(a) and Table S5). In contrast, 20 DEGs were detected in the ear leaves comprising seven up-regulated genes and 13 down-regulated genes (Figure 10(a) and Table S5). A total of 20 GO terms were enriched in developing kernels, which were mainly categorized into response to stimulus, carboxylic acid biosynthetic process, phosphatase activity, and chromosome organization (Figure 10(b) and Table S6). To further predict metabolic pathways, we performed a KEGG pathway enrichment analysis. Up-regulated DEGs in developing kernels were notably enriched in the RNA degradation pathway (Figure 10(c); Table S7). Down-regulated DEGs were especially associated with protein processing in the endoplasmic reticulum, biosynthesis of secondary metabolites, 2-oxocarboxylic acid metabolism, and starch and sucrose metabolism (Figure 10(d) and Table S7), suggesting that these signaling pathways involving ZmICE1a may contribute to maize kernel development.Figure 10.Functional enrichment analysis of differentially expressed genes (DEGs) in the ear leaf and kernel of OE lines collected on the 14^th^ day after pollination when compared with WT. (a) DEGs numbers in kernels (top) and ear leaves (bottom). (b) Gene Ontology (GO) annotation of DEGs in kernels. c-d Kyoto Encyclopedia of Genes and Genomes (KEGG) enrichment analysis of upregulated (c) and downregulated (d) genes in kernels. e-f GO annotation (e) and KEGG analysis (f) of DEGs in ear leaves.
Concerning the ear leaf, DEGs were mainly involved in the RNA polymerase II transcription regulator complex, transcription regulator complex, ATPase inhibitor activity, and negative regulation of the abscisic acid-activated signaling pathway (Figure 10(e) and Table S6). KEGG pathway enrichment analysis showed that up-regulated genes were significantly enriched in the sphingolipid metabolism and pyrimidine metabolism pathways, whereas down-regulated genes were predominantly associated with basal transcription factors and photosynthesis (Figure 10(f) and Table S7), suggesting that these pathways may enhance the photosynthetic efficiency of the OE plants.
Eleven DEGs were co-expressed in both developing kernels and ear leaves (Figure 11(a) and Table S8). These genes were implicated in stress-induced mitochondrial fusion (Zm00001eb039290), a serine proteinase inhibitor (Zm00001eb040020), RING-like zinc finger protein (Zm00001eb099970), a DJ-1/PfpI family member (Zm00001eb119910), mitochondrial ATPase inhibitor (Zm00001eb039390), a member of the protein kinase superfamily (Zm00001eb141970), two members of the low-molecular-weight phosphatase family (Zm00001eb339600, Zm00001eb382760) and unannotated genes (Zm00001eb039470, Zm00001eb040000, Zm00001eb119910) (Table S8). Notably, Zm00001eb141970, synonymous with the serine/threonine-protein kinase SAPK3, was up-regulated in both kernels and leaves (Figure 11(b, c)). The SnRK2 family, also known as the SAPK (SnRK2-Associated Protein Kinase) family, is pivotal in the abscisic acid (ABA) signaling pathway.^25^ Intriguingly, Lou et al.^26^ demonstrated that OsSPAK3 can positively affect grain length, tiller number, and yield in rice. Given the comprehensive phenotypic data, we propose that Zm00001eb141970 may play a pivotal role within the regulatory network of ZmICE1a.Figure 11.Common DEGs analysis in the kernels and ear leaves. (a) Common DEGs number in the kernel and ear leaf. (b) Relative expression levels of common DEGs. (c) KEGG enrichment analysis of common DEGs. (d) The verification of relative expression levels of DEGs by RT-qPCR. The significant differences are determined by the Student’s t-test (P<0.001).
Discussion
Maize domestication involved extensive artificial selection leading to abundant genetic modifications. Our prior work mapped qKWE3.1 and identified ZmICE1a (a bHLH transcription factor) as its candidate gene. While Wang et al.^14^ established that ZmICE1a balances endosperm defense and storage via the JA–ZmJAZ9–ZmICE1a–MPI pathway, our study reveals complementary roles in direct kernel quality regulation under non-stress conditions.
Overexpression of ZmICE1a significantly increased kernel size, 100-kernel weight, and starch content (Figure 8(c–g)), contrasting with smaller kernels and reduced vitreous endosperm in ZmOpaque11 mutants (Figure 9). This phenotypic antagonism, coupled with their co-activation of ZmYoda^27^ Fig. S4A, B), implies a potential co-regulatory mechanism for starch accumulation distinct from stress adaptation pathways.
Transcriptome analysis revealed coordinated upregulation of starch synthesis genes in both kernels and leaves of OE lines (Fig. S4C). Notably, two starch phosphorylases—ZmPho1 (Zm00001eb057840) and ZmPho2 (Zm00001eb147780) – were significantly enriched (Figure 10(b-d)). These enzymes catalyze reversible glucan phosphorolysis to produce glucose-1-phosphate,^28–30^ suggesting ZmICE1a may regulate starch metabolism through phosphorylase activity. Additionally, genes including SSRP1, SSRP2, and SUS1 showed parallel upregulation trends across organs (Fig. S4C), indicating a source-sink synchronization mechanism that extends beyond Wang et al.’s^14^ endosperm-centric model.
ZmICE1a overexpression also enhanced biomass and photosynthesis (Figure 7, S4D), potentially mediated by regulation of nitrogen uptake (e.g., ZmSAPK3, a kinase linked to nitrogen efficiency^31,32^ and photosynthetic components (e.g., ferredoxin-NADP reductase and E3 ligase AIP2; Figure 10(e, f)). These pathways were previously unassociated with ZmICE1a, providing a mechanistic explanation for vegetative growth advantages.
Notably, no significant regulation of ZmAS1/ZmDREB1 was detected (Table S9, Fig. S5A, B), and ZmJAZ9 exhibited organ-specific expression trends (downregulated in leaves, upregulated in kernels; Fig. S5B). This suggests kernel developmental functions operate independently of cold-stress responses,^33,34^ consistent with prior findings.
Collectively, our work expands the functional scope of ZmICE1a to include:(1) Co-regulation with ZmOpaque11 in starch biosynthesis, (2) Systemic influence on nitrogen-photosynthesis coupling, and (3) Organ-coordinated activation of starch metabolic pathways. These mechanisms highlight its potential for kernel yield improvement and illustrate how pleiotropic regulators evolve specialized functions during domestication.
Conclusions
Using an F_2:3_ population derived from the maize parental lines SCML0849 and ZNC442, we identified a candidate gene, ZmICE1a, via fine-mapping of the major QTL qKWE3.1 (previously annotated as qKWEI3.1, corrected for nomenclatural consistency). ZmICE1a as a key target for dissecting the molecular basis of maize kernel weight regulation. Bioinformatic analysis indicated that the promoter region of ZmICE1a contained several specific cis-acting regulatory elements associated with light response, antimicrobial interaction, and kernel formation. ZmICE1a was primarily expressed in the kernel. Overexpression of ZmICE1a resulted in acceleration of the transition to the reproductive phase, and increased the plant height, stem diameter, and photosynthetic efficiency, thereby meliorating kernel traits. Transcriptome analysis of three OE lines identified several DEGs associated with the ABA signaling pathway, and starch and sucrose metabolism, such as SAPK3, the E3 ubiquitin-protein ligase AIP2, Pho1, and Pho2, indicating that these genes may participate in the ZmICE1a regulatory pathway. The present findings highlight the important function of ZmICE1a in maize kernel development, providing theoretical support for a novel function, and insights for future research and breeding efforts. However, the conclusions are based on phenotypic analysis and transcriptome data for OE plants, and thus specific regulatory mechanisms and pathways require further exploration and verification.
Supplementary Material
Supplemental Material
Supplemental Material
The reference list from the paper itself. Each links out to its DOI / PubMed record.
- 1Ray DK, Sloat LL, Garcia AS, Davis KF, Ali T, Xie W. Crop harvests for direct food use insufficient to meet the UN’s food security goal. Nat Food. 2022;3(5):367–15. doi: 10.1038/s 43016-022-00504-z.37117562 · doi ↗ · pubmed ↗
- 2Andorf C, Beavis WD, Hufford M, Smith S, Suza WP, Wang K, Woodhouse M, Yu J, Lübberstedt T. Technological advances in maize breeding: past, present and future. Theor Appl Genet. 2019;132(3):817–849. doi: 10.1007/s 00122-019-03306-3.30798332 · doi ↗ · pubmed ↗
- 3Fernández JA, Messina CD, Salinas A, Prasad PVV, Nippert JB, Ciampitti IA, Dreisigacker S. Kernel weight contribution to yield genetic gain of maize: a global review and US case studies. J Exp Botany. 2022;73(11):3597–3609. doi: 10.1093/jxb/erac 103.35279716 · doi ↗ · pubmed ↗
- 4Wang C, Li H, Long Y, Dong Z, Wang J, Liu C, Wei X, Wan X. A systemic investigation of genetic architecture and gene Resources controlling kernel size-related traits in maize. Int J Mol Sci. 2023;24(2):1025. doi: 10.3390/ijms 24021025.36674545 PMC 9865405 · doi ↗ · pubmed ↗
- 5Lan T, He K, Chang L, Cui T, Zhao Z, Xue J, Liu J. QTL mapping and genetic analysis for maize kernel size and weight in multi-environments. Euphytica. 2018;214(7):119. doi: 10.1007/s 10681-018-2189-0. · doi ↗
- 6Li C, Wu X, Li Y, Shi Y, Song Y, Zhang D, Li Y, Wang T. Genetic architecture of phenotypic means and plasticities of kernel size and weight in maize. Theor Appl Genet. 2019;132(12):3309–3320. doi: 10.1007/s 00122-019-03426-w.31555889 · doi ↗ · pubmed ↗
- 7Liu Y, Wang L, Sun C, Zhang Z, Zheng Y, Qiu F. Genetic analysis and major QTL detection for maize kernel size and weight in multi‑environments. TAG Theor Appl Genet Theoretische Angew Genetik. 2014;127(5):1019–1037. doi: 10.1007/s 00122-014-2276-0.24553962 · doi ↗ · pubmed ↗
- 8Zhang X, Guan Z, Wang L, Fu J, Zhang Y, Li Z, Ma L, Liu P, Zhang Y, Liu M. Combined GWAS and QTL analysis for dissecting the genetic architecture of kernel test weight in maize. Mol Genet Genomics. 2020;295(2):409–420. doi: 10.1007/s 00438-019-01631-2.31807910 · doi ↗ · pubmed ↗