Fluorescence Guided Raman Spectroscopy enables the training of robust support vector machines for the detection of tumour marker proteins
Johannes Reifenrath, Benjamin Gardner, Alexander Gigler, Friederike Liesche-Starnecker, Suzy Eldershaw, Nick Stone, Jürgen Schlegel

TL;DR
This paper introduces a new method called Fluorescence Guided Raman Spectroscopy to detect tumor marker proteins using Raman shifts and machine learning.
Contribution
The novel contribution is Fluorescence Guided Raman Spectroscopy, which isolates protein spectral signatures and trains robust classifiers across cell lines.
Findings
mTagBFP2 was identified as the most Raman-compatible fluorophore for use with a 532 nm Raman system.
Support vector machines trained on Raman data achieved up to 79% accuracy in classifying cells based on connexin 43 content.
Key Raman shifts correlated with changes in protein structure, as predicted by I-TASSER models.
Abstract
Raman spectroscopy provides comprehensive biochemical information on a sample’s composition, yet it is often used to analyze aggregated spectra rather than specific shifts. We introduce Fluorescence Guided Raman Spectroscopy (FGRS) as a methodology enabling the isolation of proteins’ spectral signatures and the training of classifiers that generalize across cell lines. We demonstrate the utility of this approach using connexin 43, a marker protein of glioblastoma tumour microtubes. By screening eGFP, sodium fluorescein, and mTagBFP2 for their compatibility with a Raman system operating at 532 nm, we selected mTagBFP2 as the most Raman-compatible fluorophore, whereas the other fluorophores emitting near 532 nm caused spectral interference. mTagBFP2 was cloned into a connexin 43 expression vector, allowing fluorescent tracking and Raman interrogation with subsequent peak identification…
Genes, proteins, chemicals, diseases, species, mutations and cell lines named across the full text — each resolved to its canonical identifier and authoritative record.
Click any figure to enlarge with its caption.
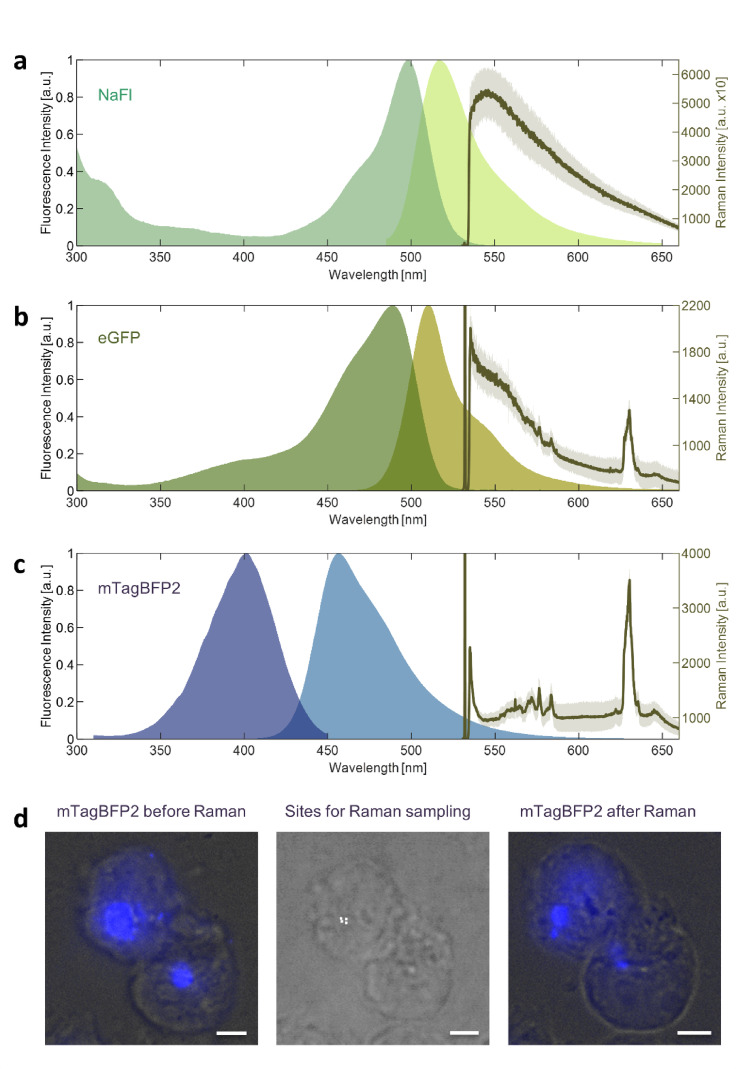 Figure 1
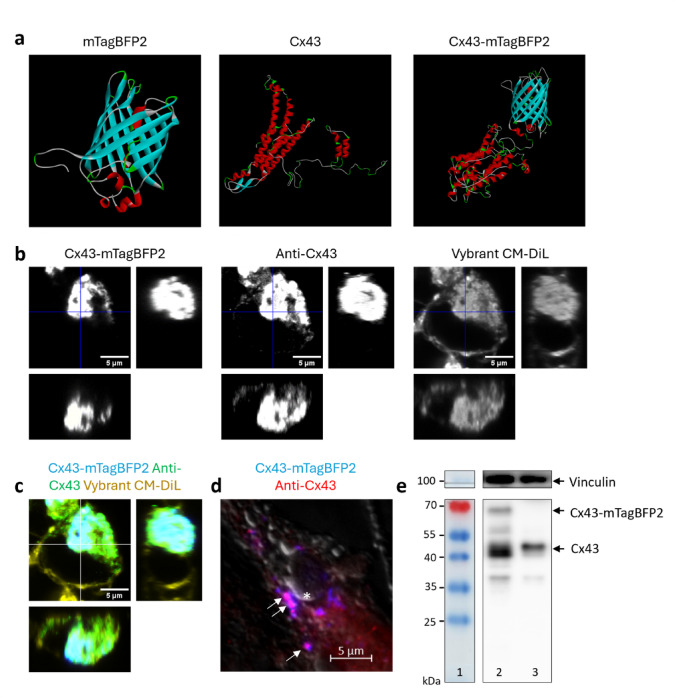 Figure 2
 Figure 3
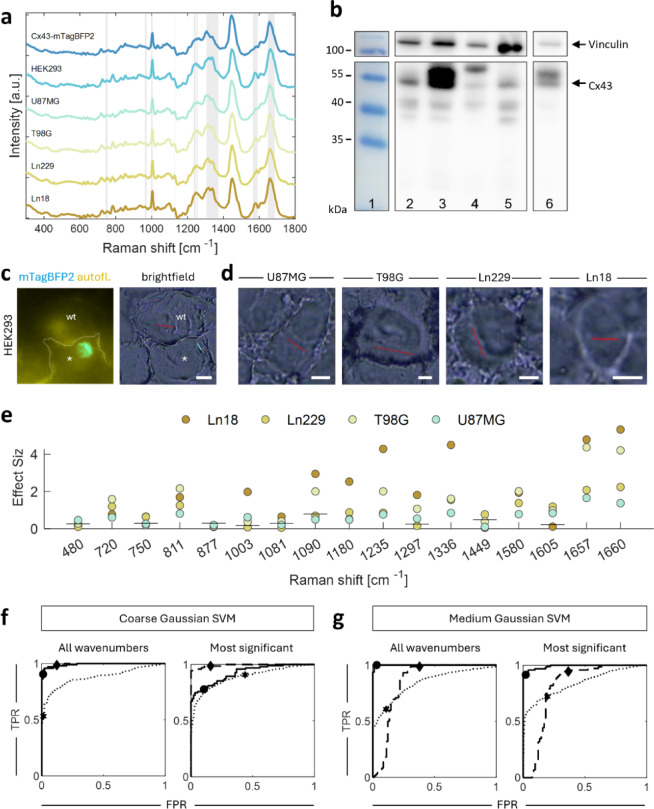 Figure 4
Peer Reviews
No public reviews on file for this paper yet. If you reviewed it on a platform where reviews are public (OpenReview, ICLR, NeurIPS, ICML), you can paste yours below so the community can read it here.
Videos
No videos yet. Explain this paper in a talk, walkthrough, or lecture? Add one.
Taxonomy
TopicsSpectroscopy Techniques in Biomedical and Chemical Research · Connexins and lens biology · Identification and Quantification in Food