Physical activity, screen time and sleep among children and adolescents: findings from the 2022 active healthy kids Ethiopia
Chalchisa Abdeta, Alem Deksisa, Mesfin Hailu, Debrework Tesfaye, Lucy Westerman, Anthony D. Okely, John J. Reilly, Mark S. Tremblay

TL;DR
This study examines physical activity, screen time, and sleep among Ethiopian children and adolescents, finding limited data and mixed improvements since 2018.
Contribution
The study provides updated surveillance on movement behaviors in Ethiopia, highlighting data gaps and changes since the 2018 report card.
Findings
Only 16% of children met physical activity guidelines and 55% met screen time guidelines.
Grades for several indicators improved since 2018, but data for sleep remains incomplete.
Data quality and representativeness limitations were identified.
Abstract
Few studies have been conducted on movement behaviours in low-income countries, indicating a need for further surveillance. This study aimed to track changes since the release of Ethiopia’s 2018 Report Card indicators and explore further gaps in physical activity, sedentary screen time and sleep among Ethiopian children and adolescents (5–17 years). We reviewed studies examining physical activity, sedentary screen time and sleep among Ethiopian children and adolescents. Relevant data were systematically searched from digital databases including PubMed, Medline, Scopus, Web of Science, WHO Hinari and Google Scholar, in alignment with the study objective. Policy or program documents were obtained from Ethiopian government official websites. Records were screened by two independent reviewers and extracted by the first author and verified by a co-author. Data were synthesised according to…
Genes, proteins, chemicals, diseases, species, mutations and cell lines named across the full text — each resolved to its canonical identifier and authoritative record.
Click any figure to enlarge with its caption.
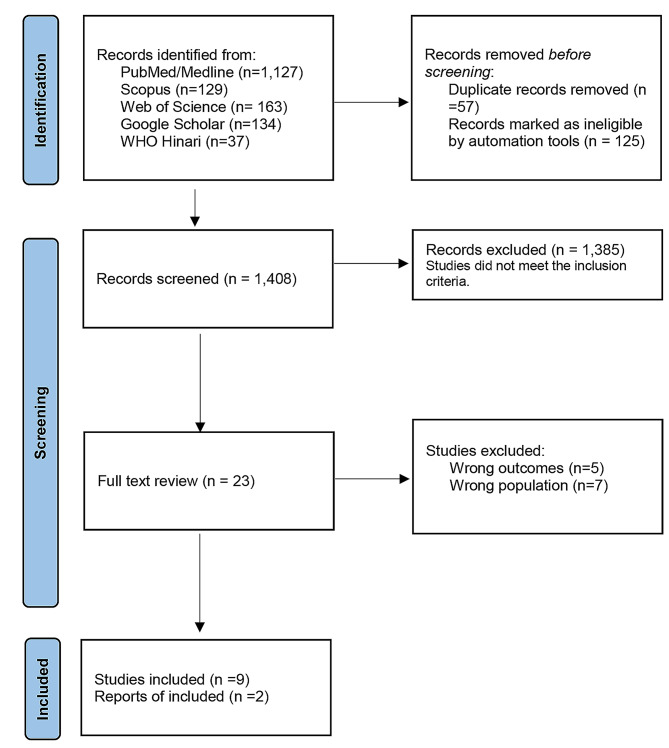 Figure 1
Peer Reviews
No public reviews on file for this paper yet. If you reviewed it on a platform where reviews are public (OpenReview, ICLR, NeurIPS, ICML), you can paste yours below so the community can read it here.
Videos
No videos yet. Explain this paper in a talk, walkthrough, or lecture? Add one.
Taxonomy
TopicsObesity, Physical Activity, Diet · Child Nutrition and Water Access · Global Public Health Policies and Epidemiology
Background
Adequate physical activity and sleep, along with reduced sedentary behaviour including screen time are beneficial for health and well-being in children and adolescents [1–5]. The World Health Organization (WHO) recommends that children and adolescents aged 5–17 years should attain: (i) At least an average of 60 min of moderate-to-vigorous intensity physical activity per day; (ii) Vigorous-intensity physical activity and muscle and bone strengthening activities at least 3 days per week; and (iii) Limit sedentary time, particularly sedentary recreational screen time [6]. However, the WHO’s 2020 guidelines lack specific recommendations for screen time and sleep [6]. Comparable Canadian guidelines advise that children and adolescents aged 5–17 years should spend less than two hours a day on recreational screen time. They also encourage limiting time spent in extended sitting and replacing sitting time with physical activity. Moreover, the Canadian guidelines suggest that children aged 5–13 years should get 9–11 h of good quality sleep per 24-hour period, while adolescents aged 14–17 years should have 8–10 h of good quality sleep during the night [3].
Over 80% of children and adolescents worldwide (ages 11–17 years) fail to meet the WHO recommendations for physical activity, putting them at higher risk for non-communicable diseases (NCDs) [7, 8]. Physical inactivity, sedentary behaviour, and inadequate sleep are growing concerns for NCDs globally [9], now the leading causes of disability and premature death, affecting families, communities, health systems, and economies [10]. Additionally, physical inactivity is a major risk factor for childhood obesity, which is on the rise globally [11]. Promoting healthy levels of these behaviours can significantly enhance health outcomes, contributing to the United Nations Sustainable Development Goal (SDG) 3: Good Health and Well-being by reducing NCDs and improving overall health [12]. Increased physical activity also helps to improve cognitive function, concentration, and memory in children and adolescents, leading to better academic performance and overall educational attainment [6], aligning with SDG 4: Quality Education. Furthermore, addressing these issues can help reduce health disparities and promote social equity, supporting SDG 10: Reduced Inequalities. Additionally, initiatives like promoting active transport and community sports can contribute to SDG 11: Sustainable Cities and Communities by creating more sustainable and equitable urban environments. These efforts collectively aim to reduce NCDs, enhance education, reduce inequalities, and create healthier communities, demonstrating the interconnected nature of the SDGs [12–14].
There’s a paucity of evidence in global surveillance for movement behaviours and their determinants especially in Low-and Middle-Income Countries (LMICs) [13]. The Active Healthy Kids Global Alliance (AHKGA) is intensifying efforts globally to address this disturbing evidence gap through a surveillance initiative called the ‘Global Matrix’ that enables engagement of LMICs in surveillance [9, 15]. The AHKGA enables countries to monitor and compare children and adolescent’s physical activity, sedentary behaviour, and sleep through harmonised development of country Report Cards (RC) [9]. In 2018, Ethiopia released the first country RC [16]. Tracking changes since this inaugural RC can provide valuable insights on physical activity, sedentary screen time and sleep among children and adolescents. Full reports on Ethiopia’s participation can be found here. This information can inform policy and practice, aiding the implementation of the WHO Global Action Plan on Physical Activity 2018–2030 in Ethiopia and other LMICs [8, 17]. This study aimed to track changes since the release of Ethiopia’s 2018 RC indicators and explore further gaps in physical activity, sedentary screen time and sleep among Ethiopian children and adolescents (5–17 years).
Methods
Study design, setting and participants
We reported following the updated Preferred Reporting Items for Systematic reviews and Meta-Analyses (PRISMA) guidelines [18]. This study was conducted in Ethiopia, the second most populous nation in Africa with a population exceeding 120 million people. It is notable that about 80% of this population resides in rural areas, reflecting the country’s predominantly agrarian lifestyle. Ethiopia is categorised as a low-income country, and economically relies on agriculture [19]. However, rapid rural-urban migration is anticipated to increase the urban population from 21% in 2018 to 39% by 2050 [20]. This shift might induce various changes in physical activity, sedentary behaviour and sleep due to limited equitable infrastructure such as footpaths, youth centres, and recreational spaces [21]. Additionally, increased access to electronic devices might encourage children and adolescents to spend more time on screens in urban areas [22]. Recognising the importance of movement behaviour surveillance among children and adolescents, the country RC leader (CA) took the initiative to register Ethiopia to participate in the Global Matrix 4.0 study. Ethiopia’s RC team formed (AD, MH, and DT) with multidisciplinary expertise in public health, physiotherapy, physical activity, and sport science. This study drawn from studies included children and adolescents aged 5–17 years old in Ethiopia who were apparently healthy and had no known health problems or disabilities. Data were collected between January 1, 2018, and August 30, 2022.
Eligibility criteria
The search terms were built on the Population,* Concept and Context (PCC) framework* [22]. Studies were included if they reported data on physical activity, sedentary screen time and sleep among Ethiopian children and adolescent (5–17 years old or any subset), either separately or together. Studies published between January 2018 and August 2022 were included. Studies focused on children and adolescents with known health problems or disabilities as well as participants over 17 years were excluded.
Data sources
Table 1 presents data sources used in this study. This study was guided by systematically searched data from digital databases including PubMed, Medline, Scopus, Web of Science, WHO Hinari and Google Scholar, in alignment with the study objective. Policy or program documents were obtained from Ethiopian government official websites, including the Ministry of Health, Ministry of Women, Children and Youth, and Ministry of Culture and Sport. The AHKGA benchmarks were used to assign grades for the RC indicators.
Table 1. Data sources for Ethiopia’s 2022 report card developmentIndicatorAverage takenStudy characteristicsIndividual findingsStudy designSample (n)Age (years)Nature of studyHow data measuredReferenceOverall Physical Activity16%14%Cross-sectionaln = 6325–18Parent- or self-reportedProportion of participants who met at least 60 min of moderate or vigorous aerobic activity daily, including vigorous activity and muscle-strengthening exercises at least 3 days a week).Biadgilign et al., 202217%Cross-sectionaln = 58013–19Proportion of participants who met 60 min of moderate to vigorous physical activity per day for at least three days per week during recreation, sport, and leisure-time.Mohammed et al., 2020aOrganized Sport and Physical Activity44%63%Cross-sectionaln = 49810–19Proportion of participants engaged in moderate-to-vigorous sports activities per week.Belay et al., 202126%Cross-sectionaln = 6166–12Proportion of participants involved in Sport activity per week.Mekonnen et al., 2018Active Play68%77%Cross-sectionaln = 48210–18Proportion of children and adolescents who regularly played in their home compound.Fitsum et al., 202158%Cross-sectionaln = 58013–19Proportion of children and adolescents who had access to playground.Mohammed et al., 2020aActive Transportation68%32%Cross-sectionaln = 49810–19Proportion of participants who walked or biked to and from school on weekdays.Belay et al., 202176%Cross-sectionaln = 48210–18Fitsum et al., 202180%Cross-sectionaln = 52210–19Worku et al., 202182%Cross-sectionaln = 6166–12Mekonnen et al., 2018Sedentary behaviour54%44%Cross-sectionaln = 48210–18Proportion of participants who spent time on watching movies/TV for more than 2 h per day.Fitsum et al., 202165%Cross-sectionaln = 58013–19Proportion of participants who spent time on screen devices for more than 2 h per day.Mohammed et al., 2020bPhysical Fitness-------No clear evidenceSleep-------No clear evidenceFamily and PeersAHKGA benchmark (< 20%)14%Cross-sectional-5–17Parent- or self-reportedProportion of children and adolescents who receive encouragement and support from their family and friends to engage in physical activity.Abdeta et al., 2019SchoolAHKGA benchmark (80-86%)82%Cross-sectionaln = 6325–18Proportion of children and adolescents who participated in physical education at school.Biadgilign et al., 2022Community and Environment43%58%Cross-sectionaln = 58013–19Proportion of participants with access to a playground in their residential area.Mohammed et al., 2020b28%Cross-sectionaln = 58013–19Proportion of participants with access to a gymnasium in their residential area.Mohammed et al., 2020bGovernmentAHKGA benchmark (47 − 53%)Car Free Day initiative---Monthly eventPresence of documented evidence of policies and strategies addressing physical activity, along with their implementation.Government reportMass Sports campaign---Government report; Tulu et al., 2019Non-Motorised Transport Strategy 2020–2029---10 yearsGovernment reportNational Adolescent and Youth Health Strategy (2016–2020)---5 yearsAHKGA: Active Healthy Kids Global Alliance. The percentage column represents the percentage of children and adolescents who meet the AHKGA benchmark. All data were derived from individual studies published between January 2019 and August 2022, following the last report card
Table 2 displays the standard grading system for the AHKGA indicators. We used the ten core harmonised indicators for physical activity (Overall Physical Activity, Organised Sport and Physical Activity, Active Play, Active Transportation, Physical Fitness, Family and Peers, Schools, Community and Environment, and Government) and Sedentary Behaviour. Additionally, the Sleep indicator was added for the first time to expand Ethiopia’s 2018 RC. The Canadian 24-hour movement guidelines for children and youth were used for the sleep indicator [3].
Table 2. Report card grading rubric.GradeBenchmarksExplanationAA^+^=94 − 100%A = 87 − 93%A^−^ = 80 − 86%We are succeeding with a large majority of children and adolescents (≥ 80%)BB^+^=74 − 79%B = 67 − 73%B^−^ = 60 − 66%We are succeeding with well over half of children and adolescents (60 − 79%)CC^+^=54 − 59%C = 47 − 53%C^−^ = 40 − 46%We are succeeding with about half of children and adolescents (40 − 59%)DD^+^=34 − 39%D = 27 − 33%D^−^ = 20 − 26%We are succeeding with less than half with some children and adolescents (20 − 39%)FF = 0 -19%Wearesucceeding with veryfew of children and adolescents (< 20%)INCINC = IncompleteInadequate information to assign a gradeTaken from Active Healthy Kids Global Alliance
Data analysis
Data were analysed using harmonised procedures of the AHKGA guidelines and indicators [9]. The country RC team evaluated the existing available evidence and assigned grades for all indicators and sent it to AHKGA auditors for approval. The average individual prevalence findings for each indicator were computed to assign grades based on the AHKGA benchmarks. Grades were determined by the percentage of Ethiopian children and adolescents who met the benchmark for each indicator. Each grade reflected the country’s success in creating opportunities that encourage children and adolescents to engage in physical activity and sleep well, while reducing sedentary screen time behaviour. Progress was evaluated by comparing the 2022 grades with those from the 2018 RC to identify areas where further improvement is required.
Results
Source of evidence and report card grades
Figure 1 illustrates the PRISMA flowchart for this review, while Table 3 presents the RC grades. Data used for grading all indicators were primarily derived from individual studies due to a dearth of evidence, and all of them were based on parent-or self-reports. We only found nine studies and two government documents related to the physical activity of children and adolescents in Ethiopia.
Fig. 1PRISMA flowchart diagram
Table 3. Summary of Ethiopia’s 2022 report cardIndicatorGradeMetrics used to assign a gradeRationale for Grade2018 gradesRecommendations to improve the gradesOverall Physical ActivityFProportion of children and adolescents who meet the WHO physical activity guideline.Only 15.8% of Ethiopian children and adolescents met the WHO physical activity guideline (Mohammed et al., 2020a; Biadgilign et al., 2022).D• Integrate physical activity questions into the Ethiopia Health and Demographic Survey.• Promote and create more opportunities for physical activity.• Develop locally appropriate physical activity programs.Organised Sport and Physical ActivityC-Proportion of Ethiopian children and adolescents participating in organised sport and physical activity at least once per week.44.1% of Ethiopian children and adolescents were participating in organised sport activities in school environments (Mekonnen et al., 2018; Belay et al., 2021).C• Increase organised sports participation within residential and school environments.• Integrate organised sports into the school curriculum.Active PlayBProportion of Ethiopian children and adolescents who engaged in unstructured active play at any intensity for more than two hours a day.67.7% of Ethiopian children and adolescents were involved in outdoor active play at any intensity for more than 2 h per day (Mohammed et al., 2020a; Fitsum et al., 2021).B• Create unstructured outdoor play opportunities in residential areas.• Build more playgrounds in urban and rural areas.Active TransportationB-Proportion of Ethiopian children and adolescents who use active transportation to get to and from places in the form of walking and biking to go to school or friend’s home, or recreational places.64.0% of Ethiopian children and adolescents were using active forms of transportation (walking/biking) to and from school (Mekonnen et al., 2018; Belay et al., 2021; Fitsum et al., 2021; Worku et al., 2021).C• Promote active transportation to create public awareness.• Improve pedestrian and cycling infrastructure.• Develop safe routes for walking and biking to school.• Implement Ethiopia Non-Motorised Transport Strategy 2020–2029.Sedentary behaviourC+Proportion of Ethiopian children and adolescents who engage in 2 h or less of sedentary recreational screen- time per day.On average, the proportion of Ethiopian children and adolescents who met the sedentary recreational screen time guidelines was 54.5% for this indicator (Mohammed et al., 2020b; Fitsum et al., 2021).F• Educate families on setting screen time limits.• Promote alternative activities to screen time, such as reading or outdoor play.• Integrate screen time education into the school curriculum to help students make informed decisions.Physical FitnessINCProportion of Ethiopian children and adolescents who meet criterion-referenced standards for cardiorespiratory fitness, muscular strength, and endurance.There is no adequate information in Ethiopia to assign a grade for this indicator.INCConduct research on physical fitness levels among children and adolescents.SleepINCProportion of Ethiopian children and adolescents who meet the Canadian sleep guidelines.There is no adequate information in Ethiopia to assign a grade for this indicator.-Conduct research on sleep duration and quality among children and adolescents.Family and PeersFProportion of Ethiopian children and adolescents who get support from their friends, peers, and families to get physically active.Only 14% of children were receiving encouragement and support from their families and friends to move (Abdeta et al., 2019).F• Encourage parents to participate in physical activities with their children and adolescents.• Develop locally appropriate family-based physical activity programs.SchoolA-Proportion of schools with policies and infrastructures that support physical activity participation of Ethiopia’s children and adolescents with trained physical education specialists in the school.81.5% of children and adolescents in Ethiopia were participating in physical education at school (Biadgilign et al., 2022).D• Expand extracurricular physical activity opportunities.• Develop school-based physical activity programs.Community and EnvironmentC-Percentage of communities/municipalities that create opportunities for physical activity among children and adolescents in Ethiopia.43% of children and adolescents had access to physical activity infrastructure such as playgrounds and gymnasiums (Mohammed et al., 2020a).F• Expand public spaces that supports physical activity, such as parks and recreational areas.• Develop community-based physical activity programs.GovernmentCEvidence of government policy and strategies that allocate resources to support and implement physical activity initiatives for children and adolescents in Ethiopia.Considering changes made on physical activity strategies and campaigns in Ethiopia, the Report Card team assign grade ‘C’ for this indicator (MOH, 2016;2019; Tulu et al., 2019; AACA, 2020).D• Develop comprehensive national movement behaviours guidelines• Improve movement behaviours surveillance through regular national surveys.• Implement the WHO Global Action Plan for Physical Activity 2018–2030 in Ethiopia (WHO, 2018).• Expanding existing national initiatives such as Car Free Day and Mass Sport program
Since the 2018 RC, there have been slight improvements in some grades, but not others. The grades for the Overall Physical Activity and Organised Sport and Physical activity indicators decreased from D to F and from C to C-, respectively. The grades for the Active Play, Physical Fitness, and Family and Peers indicators remained unchanged. The School,* Active Transportation*,* Sedentary Behaviour*,* Community and Environment*, and Government indicators showed an increase in grades from D to A-, C to B-, F to C+, F to C-, and D to C, respectively. The Sleep indicator was introduced for the first time.
Physical activity, sedentary screen time and sleep profiles
Despite some improvements since the 2018 RC, significant limitations and surveillance gaps persist, particularly due to the lack of national data on movement behaviours. We found that physical activity profile of Ethiopian children and adolescents is alarmingly low. However, some positive aspects are worth highlighting. The School indicator received an A- for its role, with 82% of children and adolescents participating in physical education. Active Play also showed promising results, earning a B grade, as 68% of children engage in unstructured active play for more than two hours daily. Active Transportation was graded B-, with 68% of children walking or biking to school. On the other hand, Organised Sport and Physical Activity, as well as Community and Environment indicators, were graded C-, with just over 40% of children having access to physical activity infrastructure, such as parks or playgrounds, and actively participating in these activities. However, the Overall Physical Activity, and Family and Peers indicators were notably low, graded F, with only 14–16% of children receiving encouragement and meeting the WHO physical activity guidelines. Unfortunately, the Physical Fitness indicator remained ungraded due to insufficient data. Lastly, the Government indicator was graded C, indicating that while there are existing policies and strategies, there is a pressing need for improved surveillance, strategies, policies and investment to better support physical activity initiatives. The present study also reported the sedentary screen time profile of Ethiopian children and adolescents. The Sedentary Behaviour indicator received a grade of C+. On average, 54% of children and adolescents in Ethiopia met the Canadian sedentary screen time guidelines. Lastly, the Sleep indicator was graded incomplete (INC) due to insufficient data.
Discussion
Summary of the findings
The present study showed that only a small proportion of Ethiopian children and adolescents met the guidelines for physical activity (16%) and sedentary screen time (55%). Unfortunately, there were no available data for sleep. Since the release of Ethiopia’s 2018 RC, there have been improvements in the grades for School,* Active Transportation*,* Sedentary Behaviour*,* Community and Environment*, and Government indicators. However, grades for Overall Physical Activity, and Organised Sport and Physical activity decreased, while the rest of indicators remained unchanged. Despite some improvements since the 2018 RC, significant limitations and surveillance gaps persist, particularly due to the lack of national data on these behaviours.
Physical activity, sedentary screen time and sleep profiles
This study highlighted the movement behaviour profiles of Ethiopian children and adolescents, noting some progress since the 2018 Report Card, along with persistent challenges. Similar AHKGA indicators and metrics were applied in both report cards, but new evidence was included in the recent RC. An increased grade in School (from D to A-), Active Transportation (from C to B-), Community and Environment (from F to C-), and Government (from D to C) indicators are encouraging. These improvements might be attributed to physical education sessions at school [23], limited vehicle ownership that encourages children and adolescents to use active travel (walking or biking) to and from school [24–27], and access to some physical activity infrastructure such as playgrounds [28]. Recent government initiatives that support physical activity in Ethiopia, such as Car Free Day initiatives, the Mass Sport Program, and the Ethiopia Non-Motorised Strategy 2020–2029 [29–31], may also have helped, despite some disruptions due to the COVID-19 pandemic and conflicts in the country. However, the decline in grades for Overall Physical Activity (from D to F) and Organised Sport and Physical Activity (from C to C-) are concerning, as levels of physical activity were so low [23–25, 28], indicating a need for interventions to promote healthy behaviours. Furthermore, grades for the Active Play (B), Physical Fitness (Incomplete), and Family and Peers (F) indicators remained unchanged since the 2018 RC [16]. The Sedentary Behaviour indicator improved from F to C+, with 55% of children and adolescents meeting the sedentary screen time guidelines [26, 32, 33]. This suggests some progress in reducing screen time, but more effort is needed to further minimise screen time and promote active alternatives. In the context of a low-income country like Ethiopia, several socio-economic factors contribute to sedentary screen time [34]. Children and adolescents tend to engage in sedentary screen time due to limited access to alternative recreational activities [35]. The affordability and growing availability of electronic devices have made screen time a convenient option for many households in LMICs [36]. The introduction of the Sleep indicator was a significant step forward, despite the current lack of information to assign it a grade. One study [23] attempted to report sleep as a correlate of physical activity but did not adequately specify the compliance according to the existing sleep guidelines for this age group [3, 37].
When interpreting our findings, it’s important to consider several factors. Variations in data sources are expected due to updates in the 2020 WHO guidelines [6]. Studies conducted before 2020 were reported based on the 2010 WHO guidelines, which had different recommendations [38]. For example, unlike the 2010 WHO guidelines, the 2020 guidelines recommend an average rather than a fixed threshold, as detailed in the background section. Additionally, some data sources measured physical activity below the standard of either the former or 2020 WHO guidelines. These variations specifically affect the Overall Physical Activity indicator. Moreover, it is unclear whether the data sources included educational screen time or only recreational screen time for the Sedentary Behaviour indicator. Furthermore, new evidence reported since the release of the 2018 RC might also affect grade changes for all indicators. Such factors could impact grading accuracy, even if we used the average of those data sources to assign a grade. These changes could result from measurement differences rather than actual behavioural changes. However, it remains unclear whether the changes in grades genuinely reflect a true change in behaviours.
Recommendations
The present study identified critical gaps in physical activity, sedentary screen time, and sleep among Ethiopian children and adolescents. To address these, it is essential to implement targeted interventions and develop national movement behaviour guidelines that promote physical activity and reduce sedentary behaviour, which align with SDG 3: Good Health and Well-being, and SDG 4: Quality Education by integrating physical activity into school curricula. Further studies are needed, particularly by integrating surveillance of these behaviours into existing national surveys. This supports SDG 3 by monitoring health risks and SDG 17: Partnerships for the Goals through collaboration with various stakeholders. Expanding existing government initiatives like Car Free Day, Mass Sport Program, and the Ethiopia Non-Motorised Strategy 2020–2029 promotes SDG 11: Sustainable Cities and Communities by encouraging non-motorised transport and SDG 13: Climate Action by reducing greenhouse gas emissions. Community engagement, and family support are crucial in encouraging healthy habits, contributing to SDG 3 by creating a supportive environment and SDG 10: Reduced Inequalities by ensuring all children have access to opportunities for physical activity and healthy living.
Strengths and limitations
This study provided a valuable snapshot of physical activity and sedentary screen time among Ethiopian children and adolescents. It offered detailed data, identified critical gaps, and included actionable recommendations to inform policy, practice and future surveillance. However, the study has limitations, including insufficient data to accurately grade Physical Fitness and Sleep indicators, reliance on potentially biased parent- or self-reported data, and the absence of nationally representative data on sleep and other behaviours, preventing a more complete understanding of these behaviours. Additionally, sex or gender differences were not examined, which impacts the assessment of health equity. Furthermore, the current study is limited to available data sources, and future research should consider utilising primary data sources to provide a more accurate and complete understanding.
Conclusion
The best available data reveals significant room for improvement in physical activity, sedentary screen time, and sleep among Ethiopian children and adolescents. Addressing these issues will require policy, surveillance, and program actions that promote healthy levels of movement behaviours in Ethiopia.
The reference list from the paper itself. Each links out to its DOI / PubMed record.
- 1United Nations. Transforming Our World: The 2030 Agenda for Sustainable Development. United Nations. 2015. https://sdgs.un.org/goals. Accessed 28 September 2024.
- 2World Bank Group. Ethiopia overview. 2019. Available at https://www.worldbank.org/en/country/ethiopia. Accessed on 20 June 2024.
- 3United Nations, Department of Economic and Social Affairs, Division P. World Urbanisation Prospects: The 2018 Revision, Online edition. Available here https://www.population.un.org/wup/. Accessed on April 20, 2021.
- 4Addis Ababa City Administration. Ethiopia Non-Motorised transport strategy 2020–2029. Addis Ababa, Ethiopia.; 2020. https://www.unep.org/resources/policy-and-strategy/ethiopia-nonmotorised-transport-strategy-2020-2029.
- 5United Nations Educational, Scientific and Cultural Organization. Screen time and learner well-being: the debate, the evidence and directions for future research and policy; A research brief by UNESCO MGIEP. Paris, France. 2021. Retrieved from https://unesdoc.unesco.org/ark:/48223/pf 0000377895