On subcellular distribution of the zinc finger 469 protein (ZNF469) and observed discrepancy in the localization of endogenous and overexpressed ZNF469
Anne Elisabeth Christensen Mellgren, Ileana Cristea, Thomas Stevenson, Endy Spriet, Per Morten Knappskog, Stig Ove Bøe, Harald Kranz, Sushma N. Grellscheid, Eyvind Rødahl

TL;DR
This study investigates the subcellular localization of ZNF469, finding that endogenous ZNF469 is mainly cytoplasmic, while overexpressed ZNF469 forms nuclear aggregates resembling biomolecular condensates.
Contribution
The study reveals a discrepancy in the localization of endogenous versus overexpressed ZNF469 and suggests its potential role in biomolecular condensates.
Findings
Endogenous ZNF469 is predominantly cytoplasmic with weak nuclear staining.
Overexpressed ZNF469 forms nuclear foci resembling biomolecular condensates that overlap with proteasomes.
ZNF469 contains intrinsically disordered regions and low complexity domains, suggesting a propensity for aggregation.
Abstract
The zinc finger 469 gene (ZNF469) is a single‐exon gene predicted to encode a protein of 3953 amino acids. Despite pathogenic ZNF469 variants being associated with Brittle Cornea Syndrome (BCS), relatively little is known about ZNF469 beyond its participation in regulating the expression of genes encoding extracellular matrix proteins. In this study, we examined the expression and intracellular localization of ZNF469 in different cell lines. The level of ZNF469 mRNA varied from low levels in HEK293 cells to high levels in HeLa cells and primary fibroblasts. Antibodies against ZNF469 reacted among others with a protein of approximately 400 kDa in immunoblot analysis, which was mainly present in the insoluble fraction of the cytoplasm. Immunofluorescence analysis of interphase cells showed small cytoplasmic puncta and weak nuclear staining. In dividing HeLa cells, the antibodies…
Genes, proteins, chemicals, diseases, species, mutations and cell lines named across the full text — each resolved to its canonical identifier and authoritative record.
Click any figure to enlarge with its caption.
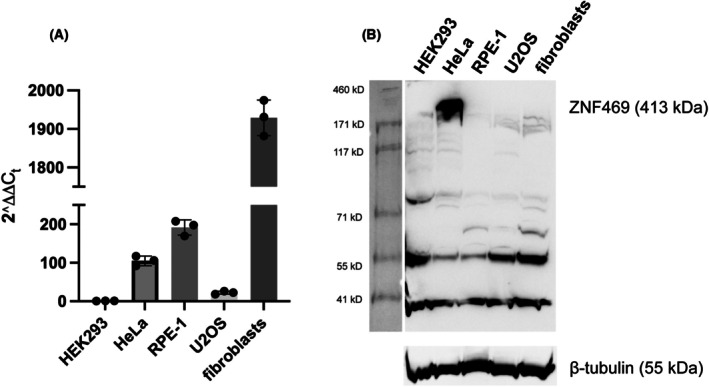 Fig. 1
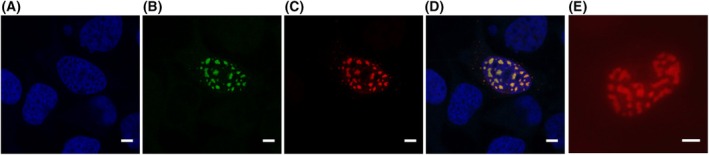 Fig. 2
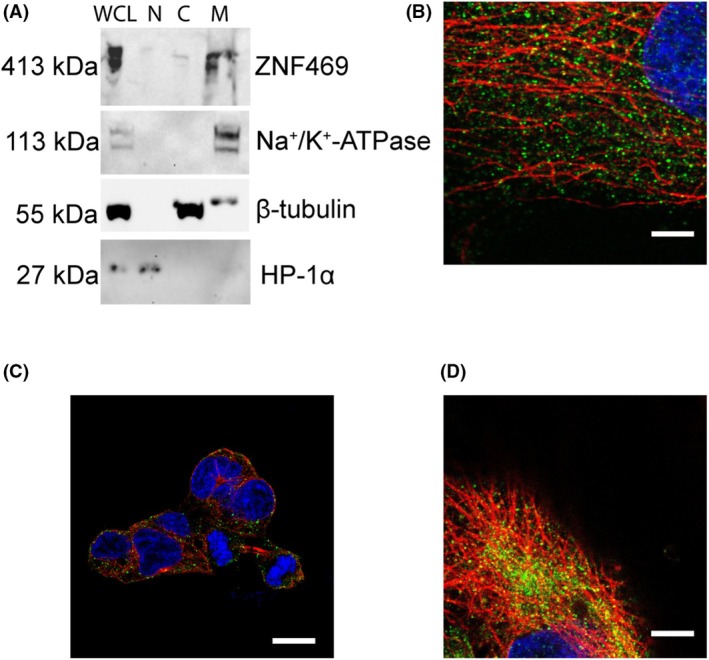 Fig. 3
 Fig. 4
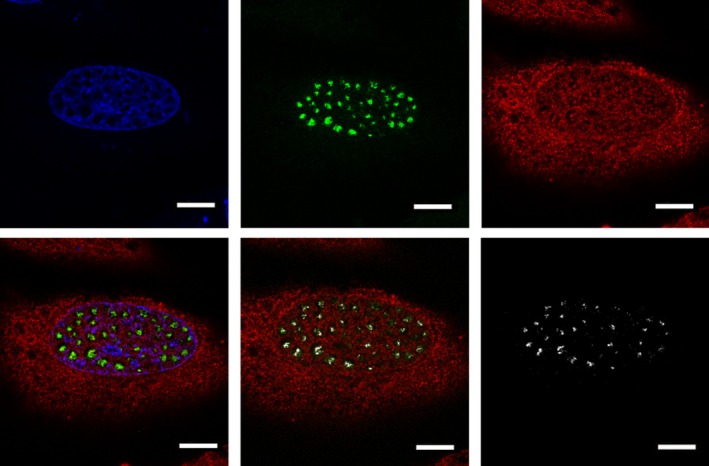 Fig. 5
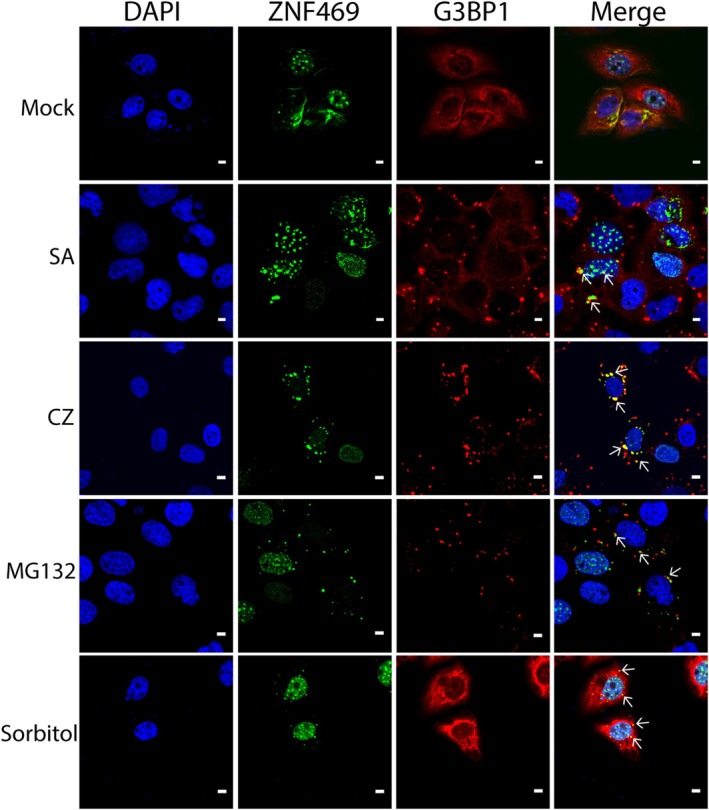 Fig. 6
- —Western Norway Regional Health Authority10.13039/501100004257
- —Universitetet i Bergen10.13039/501100005036
- —Inger Holm legacy
- —Dr. Nils and Anna Henrichsen legacy
Peer Reviews
No public reviews on file for this paper yet. If you reviewed it on a platform where reviews are public (OpenReview, ICLR, NeurIPS, ICML), you can paste yours below so the community can read it here.
Videos
No videos yet. Explain this paper in a talk, walkthrough, or lecture? Add one.
Taxonomy
TopicsRNA Research and Splicing · RNA modifications and cancer · Genomics and Chromatin Dynamics
The zinc finger 469 gene (ZNF469) (https://www.ncbi.nlm.nih.gov/gene/84627) is a single‐exon gene [1] located on chromosome 16q24.2. The full‐length mRNA is predicted to encode a large protein of 3953 amino acids with eight potential Cys2His2 (C2H2) zinc finger domains located mainly in the C‐terminal part of the protein (Fig. S1).
Pathogenic variants in ZNF469 are associated with Brittle Cornea Syndrome (BCS1; OMIM 229200), a rare, autosomal recessive connective tissue disorder. A similar phenotype is seen in individuals with pathogenic variants in the PR/SET‐Domain 5 (PRDM5) gene (BCS2; OMIM 614170), [2, 3, 4] (summary of reported ZNF469 variants in [5]). Among the typical manifestations are kyphoscoliosis, hearing impairment, joint hypermobility, skin hyperelasticity, decreased bone mineral density, and dental abnormalities. The ocular features include extreme thinning of the cornea, sometimes leading to spontaneous rupture, accompanied by malformations like keratoconus, keratoglobus, and blue sclera.
Genome wide association studies have revealed that common variants near ZNF469 contribute to variation in central corneal thickness [6, 7]. Conflicting evidence has been reported for the role of ZNF469 in the development of non‐syndromic keratoconus [8, 9, 10].
Studies of patient fibroblasts and fibroblasts from mice and zebrafish lacking ZNF469 have demonstrated a change in mRNA levels of extracellular matrix (ECM) genes, suggesting a role for ZNF469 in transcriptional regulation of ECM genes [1, 4, 5, 11]. In their zebrafish model, Bao et al. also observed increased expression of genes encoding proteasomal proteins [11]. A role for ZNF469 in regulating the expression of profibrotic genes was recently reported in hepatic stellate cells [12].
ZNF469 mRNA is present in most human tissues including the cornea and sclera, [2] with the highest levels detected in the ovary and brain (https://www.proteinatlas.org/search/ZNF469). Considerable variation in the level of ZNF469 mRNA in different cell lines has been observed with relatively high levels in HeLa cells and fibroblasts and low/undetectable levels in HEK293 cells. Intracellularly, the ZNF469 protein has been assigned to the nucleus but has also been found at cell junctions (https://www.proteinatlas.org/search/ZNF469). In transient transfection experiments, ZNF469 has been detected in the nucleus [12].
The aim of the present study was to examine the expression and intracellular localization of ZNF469 in greater detail using anti‐ZNF469 antibodies and plasmids expressing ZNF469 with and without a GFP tag.
Materials and methods
In silico analysis
Functional domains were identified using the InterPro (https://www.ebi.ac.uk/interpro/) [13] and SMART (http://smart.embl.de) database [14]. Intrinsically disordered regions were mapped using MobiDB (https://mobidb.org) [15], Database of Disordered Protein Prediction (D^2^P^2^) (http://d2p2.pro/) [16] and Rapid Intrinsic Disorder Analysis Online (RIDAO) (https://ridao.app) [17]. Classical nuclear localization signals were identified using cNLS Mapper (https://nls‐mapper.iab.keio.ac.jp/) [18]. A search for nuclear export signals was performed using LocNES (http://prodata.swmed.edu/LocNES/LocNES.php) [19].
Cells and tissues
Human embryonic kidney (HEK)293 cells (# CRL‐1573™; ATCC, Manassas, VA, USA), HeLa cells (#CCl‐2™; ATCC), SV40 immortalized human fibroblasts GM847 (#GM00847; Coriell Institute for Medical Research, Camden, NJ, USA), hTERT‐immortalized retinal pigment epithelial cells (RPE‐1) (#CRL‐4000; ATCC), wild‐type U2OS and ΔΔG3BP1/2 knock‐out U2OS cells stably transduced with mCherry‐G3BP1 (kindly provided by N. Kedersha, Brigham and Women's Hospital, Harvard Medical School, Boston, MA, USA) [20, 21] were cultured in Dulbecco's Modified Eagle's Medium (DMEM) containing 4.5 g·L^−1^ glucose (Lonza Bioscience, Basel, Switzerland) supplemented with 10% fetal calf serum, 2 mm L‐Glutamine, 100 U·mL^−1^ penicillin, and 0.1 mg·mL^−1^ streptomycin. GM847 cells [22] are a subclone of LN‐SV cells [23] that exhibit alternative lengthening of telomeres and express elevated levels of Promyelocytic Leukemia (PML) bodies.
Primary human skin fibroblasts were grown from punch biopsies from healthy individuals [24]. Approval for use of human material was obtained from the Regional Committee for Health and Research Ethics of Western Norway (IRB# 00001872) (ref. no. 3.2007.1368). Written informed consent was obtained from the healthy individuals. The study thus adhered to the Tenets of the Declaration of Helsinki.
Antibodies
The anti‐ZNF469 antibodies used in the present study were affinity purified rabbit antibodies against a peptide corresponding to amino acids 1659–1749 of ZNF469 (#PA5‐67072; ThermoFisher Scientific, Waltham, MA, USA). The supplier has later replaced this antibody with a new antibody directed against the same amino acids (#PA5‐145175).
Mouse monoclonal antibodies against the following proteins were used in double labeling immunofluorescence experiments: sc‐35 (kind gift from Prof. Karl‐Henning Kalland, University of Bergen), PML (#sc‐966; Santa Cruz Biotechnology, Dallas, TX, USA), TRF2 (#05‐521; Merck KGaA, Darmstadt, Germany), SUMO‐1 (#33–2400, ThermoFisher Scientific), U1 snRNP (#SAB4200188, Merck), acetylated tubulin (#T6793, Merck), α‐tubulin (#3873; Cell Signaling Technology, Danvers, MA, USA), β‐tubulin (#T4026; Merck), SPC25 (kindly provided by Stephen High, University of Manchester, UK), GM130 (#610823; BD Biosciences, Franklin Lakes, NJ, USA), TOMM20 (#WH0009804M1, Merck), ATPIF1 (#A‐21355; ThermoFisher Scientific), LAMP1 (#sc‐18 821, Santa Cruz Biotechnology), proteasome 19S S5A/ASF (#ab20239; Abcam, Cambridge, UK), proteasome 20S α1 + 2 + 3 + 5 + 6 + 7 (#ab 22 674; Abcam), and G3BP1 (#sc‐365 338; Santa Cruz Biotechnology). Rabbit polyclonal antibodies against SUMO1 (#4930; Cell Signaling Technology), HP1α (#2616; Cell Signaling Technology), PML (#sc‐5621; Santa Cruz Biotechnology), coilin (#sc‐32 860; Santa Cruz Biotechnology), and PCNA (#RB‐9055‐P; ThermoFisher Scientific) were used in immunofluorescence analysis of transfected cells only. Rabbit antibodies against GAPDH (#G9545; Merck), β‐tubulin (#2146; Cell Signaling Technology), Na^+^/K^+^‐ATPase (#ab76020; Abcam), and HP1α (#2616; Cell Signaling Technology) were used in immunoblots. Secondary antibodies for immunofluorescence analysis were Alexa Fluor 594 conjugated affinity purified (Fab)2 fragment goat anti‐mouse (#115‐586‐146) or goat anti‐rabbit IgG (#111‐586‐144), and Alexa Fluor 488 conjugated affinity purified (Fab)2 fragment goat anti‐rabbit IgG (#111‐546‐144) (Jackson ImmunoResearch, West Grove, PA, USA). For immunoblots, HRP‐conjugated goat anti‐rabbit IgG antibodies (#7074; Cell Signaling Technology) were used.
Plasmids
A BAC clone containing ZNF469 from the Caltech‐D human BAC library was obtained from Invitrogen (#CTD‐2589B6; ThermoFisher Scientific) (the BAC clone is unfortunately not available from this supplier after 1 Oct 2022). Full‐length ZNF469 was inserted into pAcGFP1‐N1 (Takara Bio, San Jose, CA, USA) and pCMVTNT (Promega, Madison, WI, USA) using homologous recombination by Gene Bridges (Gene Bridges, Heidelberg, Germany). A Kozak sequence was added to the 5′ end of ZNF469 [25]. In pAcGFP1‐N1, a 10 amino acid (Gly4Ser)2 linker was inserted between ZNF469 and the 5' end of the Aequorea coerulescens green fluorescent protein 1 gene. The plasmids were sequenced using Sanger sequencing. The cloned ZNF469 represents the complete ZNF469 DNA sequence, allowing for the expression of an mRNA predicted to encode the 3953 amino acids isoform with a predicted molecular weight of 413 kDa. See https://www.ensembl.org/Homo_sapiens/protview?peptide=ENSP00000456500 and https://www.ncbi.nlm.nih.gov/protein/NP_001354553.1.
Quantitative PCR (TaqMan analysis)
Total RNA was extracted from HEK293, HeLa, RPE‐1, U2OS cells and primary human fibroblasts using the RNeasy Mini Kit (#74104; Qiagen, Germany) according to the manufacturer's instructions. In addition, DNA digestion was performed using DNase I. RNA concentration was assessed using a Nanodrop spectrophotometer. cDNA was synthesized from 1 to 2.5 μg of total RNA using SuperScript™ VILO™ Master Mix (#11755050; ThermoFisher), following the manufacturer's protocol. TaqMan probes for the target gene ZNF469 (reporter dye FAM, #Hs00611441_s1) and the housekeeping gene HPRT1 (reporter dye VIC, #4326321E) were purchased from ThermoFisher. The PCR reaction was performed in a total volume of 10 μL containing 5 μL of TaqMan Universal Master Mix, 250 nm of each TaqMan probe, and 1 μL of cDNA. The cycling conditions included an initial activation at 50 °C for 2 min and denaturation at 95 °C for 10 min, followed by 40 cycles of 95 °C for 15 s and 60 °C for 1 min. Quantitative results were analyzed using the ΔΔCt method, normalizing to the reference gene HPRT1. Data analysis was conducted using the GraphPad Prism software (version 9.5.1). Each assay included no‐template controls. Cells were harvested from three separate dishes. RNA from each dish was subjected to three separate PCR reactions resulting in a total of nine replicates for each cell line.
Transfection with plasmid DNA
For transient transfection of HEK293, HeLa, GM847, and U2OS cells, the cells were grown on poly‐L‐lysine coated coverslips (0.1 mg·mL^−1^ poly‐L‐lysine (Merck) was used for coating) to approximately 50% confluency. Except for U2OS cells, the cells were transfected with plasmid DNA using FuGENE HD (Promega). To each well in a 12‐well plate, 1 mL of cell culture medium, 2 μg plasmid DNA, and 6 μL FuGENE in 100 μL Opti‐MEM I (ThermoFisher Scientific) were added. U2OS cells were transfected using Lipofectamine 3000 (ThermoFisher Scientific) as recommended by the manufacturer. The coverslips were fixed in 4% paraformaldehyde in 0.1 m phosphate buffer pH 7.5 48 h after the transfection and processed for immunofluorescence analysis using antibodies against marker proteins.
Stably transfected HEK293 cells were generated by incubating the cells in 0.5 mg·mL^−1^ geneticin (G418) (Merck) starting on the second day after transfection. Medium containing G418 was changed every 3–4 days.
Subcellular fractionation
HEK293 cells were resuspended in cold homogenization buffer (10 mm HEPES buffer pH 7.4, 50 mm sucrose, 1 mm PMSF, 1 μg·mL^−1^ aprotinin, and complete protease inhibitors (Roche Diagnostics)), and homogenized using 8 μm clearance balls (Isobiotec, Heidelberg, Germany) followed by centrifugation as described previously [26]. The suspension was first centrifuged at 2000 ** g **, 4 °C for 10 min. The pellet (nuclear fraction) was resuspended in homogenization buffer. The supernatant (cytoplasmic fraction) was centrifuged at 100 000 ** g **, 4 °C for 60 min. The resulting supernatant represents the soluble cytosol fraction. The pellet (insoluble cytoplasmic fraction) was washed by resuspension in homogenization buffer followed by centrifugation at 100 000 g, 4 °C for 15 min and was then resuspended in homogenization buffer. All three fractions were acetone precipitated and resuspended in an equal amount of sample buffer for immunoblot analysis.
Proteasome inhibition
The proteasome inhibitor MG132 (Merck) was diluted in DMSO. Cells were treated with MG132 at a final concentration of 10 μM for 5 h. Cells treated only with DMSO served as controls.
Immunoblot analysis
Cells were harvested by scraping in cold PBS, centrifuged at 900 g for 5 min at room temperature, and lysed in 50 mm Tris/HCl pH 7.5, 200 mm NaCl, 5 mm EDTA, 0.1% NP40, 0.5% Tween 20, and 1 mm PMSF supplemented with Complete protease inhibitors (Roche Diagnostics, Mannheim, Germany). Proteins were separated by SDS/PAGE using NuPAGE 3–8% Tris‐Acetate or Bolt 4–12% Bis‐Tris mini‐gels (ThermoFisher Scientific) and transferred to nitrocellulose membranes. After blocking, membranes were incubated overnight at 4 °C with anti‐ZNF469 antibodies diluted 1:1000, followed by HRP‐linked anti‐rabbit IgG antibodies as described previously [27]. A 20–220 kDa (Magic Mark; ThermoFisher Scientific) and a 30–460 kDa protein standard (HiMark; ThermoFisher Scientific) were used as molecular weight markers. After incubation with the Super Signal West Pico Substrate (Thermo Fisher Scientific), protein bands were visualized using a ChemiDoc Touch Imaging System (Bio‐Rad). GAPDH served as a loading control.
Immunofluorescence analysis
Double labeling immunofluorescence analysis was performed according to Sannerud and co‐workers with minor modifications [28]. Cells were grown on poly‐L‐lysine coated coverslips, rinsed in cold PBS, fixed with 4% paraformaldehyde in 0.1 M phosphate buffer pH 7.5 for 30 min, and kept overnight at 4 °C in washing buffer. After permeabilization (5 min) and treatment with normal goat serum (30 min), the cells were incubated with primary antibodies against ZNF469, followed by antibodies against various subcellular marker proteins. The coverslips were then washed and incubated with secondary antibodies (antibody dilutions have been reported previously [26]). Each incubation and washing step was carried out at 4 °C for a minimum of 12 h. The coverslips were mounted using ProLong Gold with DAPI (ThermoFisher Scientific). Negative controls included normal rabbit serum instead of ZNF469 antibodies. The specimens were examined using Leica SP5 or SP8 confocal laser scanning microscopes (Leica Microsystems, Wetzlar, Germany). The Lightning deconvolution software was used to enhance image resolution.
Live cell imaging
HEK293 cells stably expressing ZNF469 with a C‐terminal GFP tag were seeded in 35 mm culture dishes (no. 1.5 uncoated coverslip, 14 mm glass diameter) (#P35G‐1.5‐14‐C; MatTek) for live cell imaging. A Nikon TE2000 widefield microscope equipped with a 20× ELWD Plan Fluor objective (NA 0.45) and a DS‐QI1MC‐U2 camera, laser line 488 nm, was used for image capture under temperature and CO_2_ control (37 °C and 5% CO_2_). Imaging was performed overnight with images captured every 15 min.
Response to stress
Wild‐type U2OS, U2OS transfected with ZNF469‐GFP, and U2OS ∆∆G3BP1/2 cells transduced with mCherry‐G3BP1 were incubated with either 200 μM sodium arsenite (# 41533; Alfa Aesar/ThermoFisher Scientific) in DMEM, 20 μM clotrimazole (# C6019, Sigma/Merck) in Opti‐MEM, 100 μM MG132 (# 474790; Sigma/Merck) in DMEM, or 0.4 M D‐Sorbitol (# S6021; Sigma/Merck) in DMEM for 60 min prior to fixation and permeabilization in 100% methanol for 5 min. Stress granules were identified via the mCherry‐G3BP1 construct (excitation wavelength 587 nm, emission wavelength 610 nm) or through incubation with an antibody raised against G3BP1, as described above.
Fluorescence in situ hybridization
FISH was performed according to (10.21769/BioProtoc.999) [29]. Briefly, immunolabeled cells were re‐fixed in 4% paraformaldehyde with 0.1% Triton‐X100 for 10 min at room temperature. Cells were incubated with 0.5 μM 5′‐Cy5‐oligo d(T)30 against polyadenylated RNA (Integrated DNA Technologies, IA, USA) in hybridization buffer (70% formamide, 10 mm Tris/HCL [pH 7.4]) at 80 °C for 5 min and then for 120 min in a humidified chamber at room temperature. Blue pseudocolor was used to visualize the Cy5 signal.
Reproducibility
The number of technical and biological replicates is indicated in the figure legends. In the supplementary figures, all immunoblots and Fig. S5 represent examples from three biological replicates, while the remaining immunofluorescence images are examples from experiments performed in three technical replicates.
Results
In silico predictions
Apart from the zinc finger domains, the most prominent feature of ZNF469 is the presence of disordered regions. Approximately 74% of the protein is made up of disordered regions according to MobiDB. A total of 36 low‐complexity domains were present in the disordered regions according to the SMART database. Additional analysis with different predictors included in the D2P2 and RIDAO databases confirmed the presence of extensive disordered regions. The D2P2 analysis also revealed a potential methylation site and several putative phosphorylation sites. Molecular recognition features (MoRFs) represent functional regions that may undergo a transition from disorder to order by binding to their interaction partners. MoRFs were seen along the entire length of ZNF469. Five (one overlapping) classical monopartite nuclear localization signals were recognized by cNLS Mapper. No nuclear export signals were detected using the LocNES tool. An overview of the in silico predictions is shown in Fig. S1.
Endogenous expression of ZNF469
Quantitative PCR
For comparison with the data presented by the Human Protein Atlas, we performed quantitative PCR analysis of the ZNF469 RNA expression level in HEK293, Hela, U2OS, and RPE1 cells as well as primary human skin fibroblasts. Highest levels were detected in primary fibroblasts, while low levels were seen in HEK293 cells. The relative levels of ZNF469 mRNA is shown in Fig. 1A. Ct‐values are presented in Fig. S2A.
ZNF469 RNA and protein expression levels were measured by quantitative PCR (A) and immunoblot analysis (B) of ZNF469 in different cell lines. (A) After amplification with TaqMan probes, quantitative PCR results were analyzed using the ∆∆Ct method, normalizing the ZNF469 levels to the reference gene HPRT1. Results were obtained from a total of 9 replicates for each cell line. Error bars indicate SD. (B) The HiMark molecular weight standard is shown to the left. Representative blots from three biological replicates are presented.
Anti‐ZNF469 antibody and immunoblot analysis
We first examined the ZNF469 antibody in transfected cells overexpressing a ZNF469‐AcGFP fusion protein. A speckled nuclear fluorescence signal was observed in transfected cells. There was complete overlap of the green fluorescent protein signal and the signal produced by the antibody (Fig. 2) showing that the antibodies recognized the ZNF469 protein.
(A–D) HEK293 cells transfected with plasmids expressing a ZNF469‐AcGFP fusion protein (green) were labeled with antibodies against ZNF469 (red). Nuclei are shown in blue. An overlay with double labeled nuclear speckles in shown in yellow. (E) HEK293 cells transfected with a plasmid expressing ZNF469 without the AcGFP tag incubated with antibodies against ZNF469 (red). The experiments were performed in three biological replicates with similar results. Scale bar: 5 μm.
In immunoblot analysis of whole cell lysates, the ZNF469 antibody recognized a double band corresponding to protein(s) with a MW of approximately 400 kDa in HeLa cells (Fig. 1B). In a separate experiment, a ~400 kDa protein band was also seen in whole cell lysates from primary human fibroblasts (Fig. S3G). Several smaller sized protein bands were also seen. It is not clear if these are fragments or degradation products of ZNF469 or if there is cross‐reaction with other proteins.
Subcellular fractionation
Since the ~400 kDa protein band was most prominent in HeLa cells, we subjected HeLa cells to subcellular fractionation. The cells were lysed and separated into a nuclear and two cytoplasmic fractions. Antibodies against Na^+^/K^+^‐ATP‐ase and β‐tubulin were used as markers for the insoluble (“membrane”) and the soluble (“cytosol”) cytoplasmic fractions, respectively, while anti‐HP1α antibodies were used for the nuclear fraction. Immunoblot analysis revealed that the proteins recognized by the anti‐ZNF469 antibodies were present mainly in the insoluble (“membrane”) fraction of the cytoplasm (Fig. 3A, complete blots in Fig. S2). This included the ~400 kDa protein anticipated to represent full‐length ZNF469.
Intracellular localization of ZNF469 in interphase cells. (A) Subcellular fractionation of HeLa cells. Immunoblot showing endogenously expressed proteins detected by anti‐ZNF469 antibodies. C, soluble cytosolic fraction; M, insoluble cytosolic fraction; N, nuclear fraction; WCL, whole cell lysates. HP1α was used as marker for the nuclear fraction while β‐tubulin and Na+/K+‐ATPase were used as markers for the soluble and insoluble cytosolic fraction, respectively. The blots represent examples from three biological replicates. (B–D) Immunofluorescence analysis using anti‐ZNF469 antibodies (green) and antibodies against β‐tubulin (red) in primary fibroblasts from a healthy individual (B), HEK293 cells (C), and HeLa cells (D). Similar results were obtained in three biological replicates. Scale bar: 5 μm.
As described below, we observed punctate staining of the cytoplasm in HEK293 cells (Fig. 3C). This was surprising since HEK293 cells showed low levels of ZNF469 mRNA and undetectable levels of the ~400 kDa protein in immunoblot analysis of whole cell lysates. After subcellular fractionation, however, a ~400 kDa protein was detected in the insoluble fraction of the cytoplasm (Fig. S2).
Immunofluorescence analysis
Immunofluorescence analysis revealed punctate cytoplasmic staining in interphase cells (Fig. 3B–D; Figs S3, S7, S8). In HeLa cells, some of the staining was localized along microtubules. In double labeling experiments of primary fibroblasts, the pattern of ZNF469 antibody staining did not correspond to any of the major cytoplasmic organelles including endoplasmic reticulum (ER) (SPC‐25), Golgi (GM130), inner (ATPIF1) or outer (TOMM20) mitochondrial membrane, and lysosomes (LAMP1), although occasionally the staining would overlap (Fig. S3). A weak, punctate nuclear staining was seen in most cell lines except for HEK293 cells (Fig. 3, Figs S3, S7, S8). In stressed U2OS cells, a weak homogeneous nuclear staining was seen (Figs S7, S8).
The staining of the anti‐ZNF469 antibodies during mitosis was examined in HeLa cells and primary fibroblasts. In fibroblasts, the staining was mainly punctate (Fig. S4), while in HeLa cells, larger foci also appeared (Fig. 4). In double labelling experiments with antibodies against 19S proteasomes, complete overlap was seen in some of these foci, while in others, the ZNF469 staining surrounded the 19S proteasome staining in a doughnut‐like shape. The foci appeared early in mitosis, persisted through the final stages of cytokinesis, and were seen in the cytoplasm of the daughter cells shortly after the nucleus had reappeared (Fig. 4). Some overlapping staining with proteasomes was seen of the puncta in primary fibroblasts as well, but the characteristic doughnut‐shaped foci were not observed (Fig. S4). In some primary fibroblasts (<5%), doughnut‐shaped dots appeared in the cytoplasm during interphase, as shown in Fig. S3F. Incubation with the proteasome inhibitor MG132 resulted in an increase in the amount of the ~400 kDa protein recognized by the anti‐ZNF469 antibodies (Fig. S3G).
Double labeling immunofluorescence analysis of dividing HeLa cells (A–E). HeLa cells were incubated with antibodies against ZNF469 (green) and 19 S proteasomes (red) (A–D) or β‐tubulin (red) (E). (A and B) Metaphase. (C–E) Telophase (abscission). (D) Enlarged image from (C). Arrows in (B) and yellow‐white staining in (C and D) indicate overlapping staining for ZNF469 and 19 S proteasomes. Example images from three biological replicates are shown. Scale bar: 5 μm.
Transfection with ZNF469
We transfected HeLa, HEK293, GM847, and U2OS cells with the plasmid expressing the ZNF469‐AcGFP fusion protein. HEK293 cells were used since they are easy to transfect, GM847 cells because they express PML bodies, and U2OS cells for stress granule experiments. A strong speckled nuclear fluorescence signal appeared in interphase cells (Figs 2, 5, 6; Figs S5A, S6). In some cells, foci were also seen in the cytoplasm. As a control for the effect of the GFP tag, we transfected HEK293 cells with a plasmid expressing ZNF469 without the GFP tag. In immunofluorescence analysis, the ZNF469 antibodies produced a speckled nuclear staining as seen in cells transfected with ZNF469‐AcGFP, indicating that the GFP tag did not affect the localization of ZNF469 (Fig. 2).
HeLa cells transfected with plasmids expressing the ZNF469‐AcGFP fusion protein (green) and labeled with antibodies against 19 S proteasome (red). Nuclei are shown in blue. White signal indicates overlapping staining of ZNF469‐AcGFP and 19 S proteasomes. The experiment was repeated twice, each in three technical replicates. Scale bar: 5 μm.
Expression of ZNF469 during stress granule formation in wt U2OS cells transfected with ZNF469‐AcGFP (green). Anti‐G3BP1 antibodies were used to detect the stress granule marker G3BP1 (red). Stress modes included sodium arsenite (SA), clotrimazole (CZ), MG132, and sorbitol. Arrows indicate stress granules with overlapping staining of ZNF469 and G3BP1. All experiments were conducted in three technical replicates. Scale bar: 5 μm.
In mitotic cells, staining of the midbody was a prominent feature (Fig. S5D and Video S1). In addition, small foci were seen in HeLa cells, most prominent in abscission, where they were detected opposite to the midbody (Fig. S5D). In GM847 cells, GFP staining of the mitotic spindle was observed from late metaphase to telophase (Fig. S5). We also observed staining of cytoplasmic microtubules in the interphase of GM847 and U2OS cells (Fig. S5A; Fig. 6).
Double labeling immunofluorescence experiments with antibodies against proteins known to be present in nuclear speckles including sc35, U1snRNP, PML, SUMO, coilin, HP1α, and TRF‐2 were performed in GM847 cells. We did not observe any overlapping staining with ZNF469‐AcGFP (Fig. S6).
Antibodies against proteasomes, however, reacted with the nuclear foci as shown in HeLa cells (Fig. 5). By using the Lightning deconvolution module, punctate overlapping staining was seen in parts of the nuclear foci.
Live cell imaging
To further characterize the nuclear foci produced by ZNF469 in transfected cells, we performed live cell imaging. Since in silico analysis had revealed the presence of large, disordered regions with multiple low‐complexity domains in ZNF469, we hypothesized that the foci could represent biomolecular condensates. In stably transfected HEK293 cells expressing GFP‐tagged ZNF469, nuclear foci were seen resembling the foci observed in transiently transfected cells. The foci were dynamic in nature as their shape and position changed during the recording (Video S2). We observed splitting or fusion of some foci, indicating that they had liquid‐like properties.
Formation of stress granules
Stress granules are well‐characterized examples of biomolecular condensates [30]. We therefore examined ZNF469 during stress granule formation in U2OS cells using G3BP1 and oligo d(T) as markers. In untreated, native cells, punctate staining of anti‐ZNF469 antibodies was seen in the cytoplasm and in some nuclei. After treatment with sodium arsenite or clotrimazole, we observed overlapping staining of antibodies against ZNF469 and G3BP1 in a few granules, suggesting that proteins recognized by the anti‐ZNF469 antibodies could participate in the formation of stress granules (Fig. S7). In untreated transfected cells, stress granules appeared that did not show any overlapping staining with ZNF469, suggesting that the transfection itself represented a stressful event for the cells. Aggregates of ZNF469 and stress granules were frequently located next to each other (Fig. 6). After sorbitol treatment, some stress granules appeared that showed overlapping staining of G3BP1 and ZNF469‐AcGFP (Fig. 6). In ΔΔG3BP1/2 U2OS cells transduced with mCherry‐G3BP1, a prominent reaction of anti‐ZNF469 antibodies with stress granules was seen in all stress modes tested (Fig. S8).
Discussion
In this report, we present data showing that anti‐ZNF469 antibodies recognize a protein with the appropriate molecular weight that is localized in the cytoplasm. In contrast, when overexpressed in transfected cells, ZNF469 is seen mainly in nuclear foci. These foci split and fuse during live cell imaging, suggesting that they could represent biomolecular condensates.
The anti‐ZNF469 antibody reacted only to a minor extent with the nuclei, which is in contrast to the localization reported in the Human Protein Atlas (https://www.proteinatlas.org/search/ZNF469). We observed a cytoplasmic localization both in subcellular fractionation experiments and in immunofluorescence analysis. The nuclear localization reported in the Human Protein Atlas was shown for U2OS cells. The cells where we observed the most prominent nuclear reaction were also U2OS cells. It is possible that the extent of nuclear localization may vary between cell lines. In immunoblot analysis, we observed in addition to the ~400 kDa protein several other protein bands. They could represent degradation products or alternatively proteins cross‐reacting with the anti‐ZNF469 antibodies, which could bias the immunofluorescence analysis. In HEK293 cells, unexpected results were seen in that a ~400 kDa protein appeared in the insoluble fraction of the cytoplasm that was not detected in immunoblot analysis of whole cell lysates. To some extent, this could be explained by the relatively small volume of the cytoplasm relative to the nucleus in HEK293 cells compared to HeLa cells.
ZNF469 has been shown to play a role in regulating the transcription of ECM proteins [1, 4, 12]. We identified several nuclear localization signals in ZNF469 and therefore expected ZNF469 to be localized to the nucleus. Many transcription factors, however, reside in the cytoplasm and are transported to the nucleus only in response to specific stimuli [31, 32]. In the cytoplasm, they can be associated with membranes like the plasma membrane and the ER, or they can be present in macromolecular complexes in the cytosol [33]. Release for transport into the nucleus may involve proteolytic cleavage of the transcription factor from the membrane [34] or degradation of inhibitory factors that otherwise prevent nuclear transport [33].
In transfected cells, we observed nuclear localization of ZNF469 in multiple nuclear foci, as previously reported by Ariyachet et al. [12]. Both overexpression and tagging may result in mis‐localization of proteins, among others, because of overloading of the normal cellular localization machinery [35]. In cells overexpressing ZNF469 without a tag, similar nuclear foci appeared, as seen in cells overexpressing ZNF469 with a GFP tag, indicating that the tag did not influence the localization of ZNF469. The nuclear localization in transfected cells could indicate that when overexpressed, ZNF469 may titrate out inhibitory factors that otherwise prevent nuclear localization.
Overexpression may also cause erroneous formation of protein complexes by exceeding the cell's capacity for degradation, folding, or intracellular transport [36, 37]. Overexpressed or misfolded proteins can be sequestered into compartments including aggresomes [38], nucleoli [39], and stress granules [40, 41]. In some cell types, dispersed aggregates may appear instead of aggresomes [42]. Recently, proteasome‐containing foci have been shown to form in the nuclei of cells both at basal conditions and in cells exposed to various forms of stress [43, 44]. These foci are active sites of proteolysis and represent biomolecular condensates that are not co‐localized with known nuclear membrane‐less organelles [43, 44]. The nuclear foci seen in cells overexpressing ZNF469 showed overlapping staining with proteasomes and therefore resemble such proteasome‐containing foci. Live cell imaging of the ZNF469 nuclear foci revealed that they changed shape and position and would occasionally split or fuse, which is characteristic of the liquid‐like property of biomolecular condensates [45].
In silico analysis showed that ZNF469 contains large intrinsically disordered regions with multiple low complexity domains [46]. Although not essential [21], such regions may contribute to liquid–liquid phase separation of the protein [47, 48]. Stress granules are typical examples of biomolecular condensates [49, 50]. While ZNF469 has not been detected in screens of stress granules [51], we found that the anti‐ZNF469 antibodies recognized proteins that participated in stress granule formation, in particular in ΔΔG3BP1/2 U2OS cells transduced with mCherry‐G3BP1, supporting that they may form biomolecular condensates. Why the co‐localization appeared mainly in these cells is not clear. It could be related to the concentration of key constituents for stress granule formation, like G3BP1 [21].
A consistent feature seen in transfected cells was the co‐localization with the mitotic spindle, particularly at late stages of mitosis. Several zinc finger proteins are involved in spindle assembly and function, including chromosome alignment maintaining phosphoprotein (CAMP) (ZNF828) [52] and BuGZ (ZNF207) [53]. However, ZNF469 has not been identified in proteome analysis of purified mitotic spindles [54] or midbodies [55]. Microtubules can be a surface for biomolecular condensate formation, resulting in “wetting” of the microtubules [56]. Whether the staining of the midbody reflects a functional feature of ZNF469 or is just a consequence of ZNF469 overexpression remains to be determined.
The potential for ZNF469 to participate in the formation of biomolecular condensates could be relevant for cells expressing endogenous levels of ZNF469. In HeLa cells, foci where ZNF469 surrounded proteasomes were seen. These foci could represent multiphase droplets [57] with the proteasomes in the core and ZNF469 in the shell. Fu and co‐workers described proteasomal foci where the ubiquitinated substrate was localized in the center and the proteasomes in the periphery [44]. A combined aggregate and condensate could also be present since in many biomolecular condensates with a complex structure not all constituents are present in a liquid form [50, 51]. In a recent paper, Bao and co‐workers observed that loss of ZNF469 resulted in increased expression of proteasomal proteins in zebrafish [11]. The relationship between ZNF469 and proteasomes needs to be explored further.
Conclusion
Anti‐ZNF469 antibodies recognized a ~ 400 kDa protein that was localized mainly in the cytoplasm. When overexpressed, nuclear localization in large foci was seen. These foci resemble biomolecular condensates. ZNF469 contains large, disordered regions which may explain its tendency to aggregate and possibly form biomolecular condensates. Many transcription factors reside in the cytoplasm and are transported to the nucleus only when needed. A cytoplasmic localization of ZNF469 is therefore compatible with its proposed role as a transcriptional regulator. Due to the discrepancy in the localization of endogenous and overexpressed ZNF469, care must be taken when interpreting the data.
Conflicts of interest
A.E.C. Mellgren, None; I. Cristea, None; T. Stevenson, None; E. Spriet, None; P.M. Knappskog, None; S.O. Bøe, None; H. Kranz, None; S.N. Grellscheid, None; E. Rødahl, None.
Peer review
The peer review history for this article is available at https://www.webofscience.com/api/gateway/wos/peer‐review/10.1002/2211‐5463.70034.
Author contributions
AECM, TS, SNG, and ER conceived the study; SNG and ER supervised the study. AECM, TS, ES, IC, and ER conducted experiments. HK provided ZNF469 plasmids. All authors analyzed results. AECM, IC, and ER wrote the manuscript. All authors reviewed and approved the manuscript.
Supporting information
Fig. S1 Schematic representation of the ZNF469 protein with predictions of disordered regions.
Fig. S2 (A) Average Ct values from the quantitative PCR analysis shown in Fig. 1. (B) Full blots of the subcellular fractionation shown in Fig. 3. (C) Subcellular fractionation of HEK293 cells.
Fig. S3 (A–F) Immunofluorescence analysis of fibroblasts using antibodies against ZNF469 and proteins associated with cytoplasmic organelles. (G) Immunoblot analysis of fibroblast extracts without and after treatment with MG132.
Fig. S4 Immunofluorescence analysis of fibroblasts in metaphase using antibodies against ZNF469 and 19S proteasomes.
Fig. S5 (A–C) Transfected GM847 cells expressing ZNF469‐AcGFP fusion protein labeled with antibodies against acetylated tubulin. (D) Transfected HeLa cells expressing ZNF469‐AcGFP fusion protein during abscission.
Fig. S6 Immunofluorescence analysis of GM847 cells transfected with ZNF469‐AcGFP labeled with antibodies against nuclear proteins.
Fig. S7 Expression of ZNF469 during stress granule formation in wt U2OS cells using anti‐ZNF469 antibodies.
Fig. S8 Expression of ZNF469 during stress granule formation in ΔΔG3BP1/2 U2OS cells transfected with mCherry‐G3BP1.
Video S1 Live cell imaging of stably transfected HEK293 cells expressing ZNF469‐AcGFP fusion protein. During abscission, staining of the midbody is seen.
Video S2 Live cell imaging of stably transfected HEK293 cells expressing ZNF469‐AcGFP fusion protein. In interphase, the nuclear foci vary in size and some foci split or fuse during the recording.
The reference list from the paper itself. Each links out to its DOI / PubMed record.
- 1Rohrbach M , Spencer HL , Porter LF , Burkitt‐Wright EM , Bürer C , Janecke A , Bakshi M , Sillence D , Al‐Hussain H , Baumgartner M et al. (2013) ZNF 469 frequently mutated in the brittle cornea syndrome (BCS) is a single exon gene possibly regulating the expression of several extracellular matrix components. Mol Genet Metab 109, 289–295.23680354 10.1016/j.ymgme.2013.04.014PMC 3925994 · doi ↗ · pubmed ↗
- 2Abu A , Frydman M , Marek D , Pras E , Nir U , Reznik‐Wolf H and Pras E (2008) Deleterious mutations in the zinc‐finger 469 gene cause brittle cornea syndrome. Am J Hum Genet 82, 1217–1222.18452888 10.1016/j.ajhg.2008.04.001PMC 2427192 · doi ↗ · pubmed ↗
- 3Christensen AE , Knappskog PM , Midtbø M , Gjesdal CG , Mengel‐From J , Morling N , Rødahl E and Boman H (2010) Brittle cornea syndrome associated with a missense mutation in the zinc‐finger 469 gene. Invest Ophthalmol Vis Sci 51, 47–52.19661234 10.1167/iovs.09-4251 · doi ↗ · pubmed ↗
- 4Burkitt Wright EMM , Spencer HL , Daly SB , Manson FDC , Zeef LAH , Urquhart J , Zoppi N , Bonshek R , Tosounidis I , Mohan M et al. (2011) Mutations in PRDM 5 in brittle cornea syndrome identify a pathway regulating extracellular matrix development and maintenance. Am J Hum Genet 88, 767–777.21664999 10.1016/j.ajhg.2011.05.007PMC 3113239 · doi ↗ · pubmed ↗
- 5Stanton CM , Findlay AS , Drake C , Mustafa MZ , Gautier P , Mc Kie L , Jackson IJ and Vitart V (2021) A mouse model of brittle cornea syndrome caused by mutation in Zfp 469. Dis Model Mech 14, dmm 049175.34368841 10.1242/dmm.049175 PMC 8476817 · doi ↗ · pubmed ↗
- 6Lu Y , Dimasi DP , Hysi PG , Hewitt AW , Burdon KP , Toh T , Ruddle JB , Li YJ , Mitchell P , Healey PR et al. (2010) Common genetic variants near the brittle cornea syndrome locus ZNF 469 influence the blinding disease risk factor central corneal thickness. P Lo S Genet 6, e 1000947.20485516 10.1371/journal.pgen.1000947 PMC 2869325 · doi ↗ · pubmed ↗
- 7Gao X , Gauderman WJ , Liu Y , Marjoram P , Torres M , Haritunians T , Kuo JZ , Chen YD , Allingham RR , Hauser MA et al. (2013) A genome‐wide association study of central corneal thickness in Latinos. Invest Ophthalmol Vis Sci 54, 2435–2443.23493294 10.1167/iovs.13-11692 PMC 3621577 · doi ↗ · pubmed ↗
- 8Rong SS , Ma STU , Yu XT , Ma L , Chu WK , Chan TCY , Wang YM , Young AL , Pang CP , Jhanji V et al. (2017) Genetic associations for keratoconus: a systematic review and meta‐analysis. Sci Rep 7, 4620.28676647 10.1038/s 41598-017-04393-2PMC 5496893 · doi ↗ · pubmed ↗