Expression of Concern: Differential expression and function of CAIX and CAXII in breast cancer: A comparison between tumorgraft models and cells

Abstract
Genes, proteins, chemicals, diseases, species, mutations and cell lines named across the full text — each resolved to its canonical identifier and authoritative record.
Click any figure to enlarge with its caption.
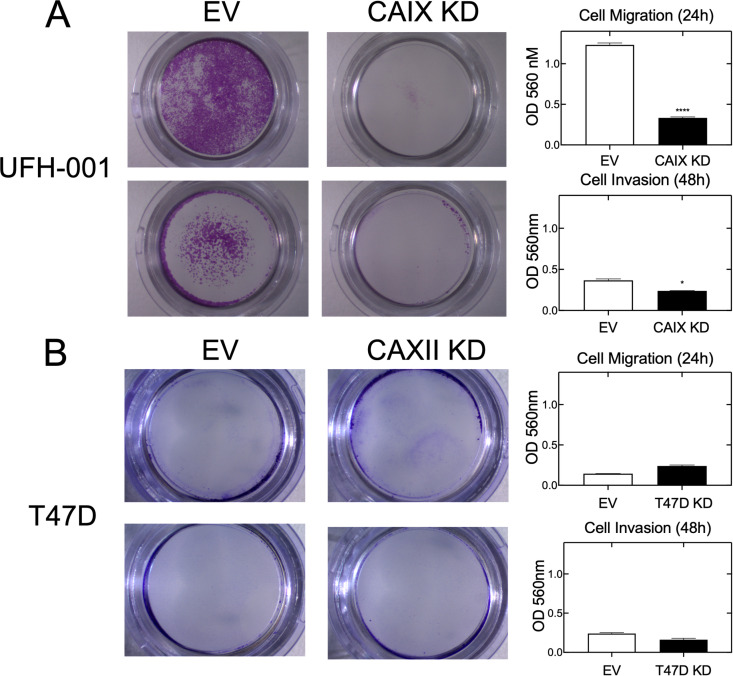 Figure 1
 Figure 2
 Figure 3
 Figure 4
 Figure 5
Peer Reviews
No public reviews on file for this paper yet. If you reviewed it on a platform where reviews are public (OpenReview, ICLR, NeurIPS, ICML), you can paste yours below so the community can read it here.
Videos
No videos yet. Explain this paper in a talk, walkthrough, or lecture? Add one.
Taxonomy
TopicsIon channel regulation and function · Radiopharmaceutical Chemistry and Applications · Chemical Synthesis and Analysis
After this article [1] was published, concerns were raised regarding results presented in Figs 4 and 6. Specifically:
Regarding the western blot concerns in Fig 4, the corresponding author stated that the western blots in Figs 4A and C in [1] were intentionally reused in Figs S4A and B in [2], and that there is no quantitative connection between the western blots in Figs 4A and C and the growth data across Figs 4A-D. For the plate image concerns in Fig 6, the corresponding author stated that the images in Fig 9A in [2] are correct and the images in Figs 6A and B in [1] are incorrect. An updated version of Fig 6 with the correct panels from the original experiments is provided here. The underlying images for the corrected Fig 6 are in S5-S12 Files, and the associated underlying data for the charts in Fig 6 are in S4 File.
With the exception of the underlying data for Figs 2B, 5B and 7A and the western blots, which the corresponding author stated are no longer available, the underlying data for the remainder of this article [1] are provided here in S1-S3 and S14-S24 Files. Analysis of a different data set from a later repeat experiment of Fig 7A under the same experimental conditions is provided here in S13 File. The corresponding author stated that the quantitative data for Fig 1 were generated using the Meyer Kaplan database [4].
Given that the primary data underlying Figs 2B, 5B and 7A are [1] are no longer available, and the primary data were not provided with the published article [1], contrary to the Data Availability statement, this article [1] does not comply with the PLOS Data Availability Policy.
In light of the concerns listed above, and as this article [1] does not comply with the PLOS Data Availability Policy, the PLOS One Editors issue this Expression of Concern.
Owing to the concerns about similarities with previously published content [3], published 2018 Taylor & Francis which is not offered under a CC BY license, the Migration EV panel of Fig 6A and all four panels of Fig 6B are excluded from this article’s [1] license.
Supporting information
S1 FileUnderlying quantitative data in support of the charts in Figs 4A and C in [1].(XLSX)
S2 FileUnderlying quantitative data in support of the chart in Fig 4B in [1].(XLSX)
S3 FileUnderlying quantitative data in support of the chart in Fig 4D in [1].(XLSX)
S4 FileUnderlying quantitative data in support of the charts in Fig 6 in [1].(XLSX)
S5 FileUnderlying image for the corrected Fig 6A UFH-001 EV migration panel.(TIFF)
S6 FileUnderlying image for the corrected Fig 6A UFH-001 CAIX migration panel.(TIF)
S7 FileUnderlying image for the corrected Fig 6A UFH-001 EV invasion panel.(TIFF)
S8 FileUnderlying image for the corrected Fig 6A UFH-001 CAIX invasion panel.(TIF)
S9 FileUnderlying image for the corrected Fig 6B T47D EV migration panel.(JPG)
S10 FileUnderlying image for the corrected Fig 6B T47D CAXII KD migration panel.(JPG)
S11 FileUnderlying image for the corrected Fig 6B T47D EV invasion panel.(JPG)
S12 FileUnderlying image for the corrected Fig 6B T47D CAXII KD invasion panel.(JPG)
S13 FilePrism/graph pad file with replicate data and figure in support of Fig 7A.This represents an analysis of a different data set to Fig 7A in [1] with the same experimental conditions.(PRISM)
S14 FilePrism/graph pad file with original data and figure in support of Fig 7B.(PZFX)
S15 FilePrism/graph pad file with original data and figure in support of Fig 7C.(PRISM)
S16 FilePrism/graph pad file with original data and figure in support of Fig 7D.(PZFX)
S17 FilePrism file with original data and figure in support of Fig 8A.(PRISM)
S18 FilePrism file with original data and figure in support of Fig 8B.(PZFX)
S19 FilePrism file with quantitative data and figure in support of Fig 9C.(PZFX)
S20 FilePrism file with quantitative data and figure in support of Fig 9D.(PZFX)
S21 FilePrism file with quantitative data and figure in support of Fig 9A.(PZFX)
S22 FilePrism file with quantitative data and figure in support of Fig 9B.(PZFX)
S23 FileUnderlying quantitative data in support of Fig 10 in [1].(XLS)
S24 FileUnderlying quantitative data in support of Fig 5C in [1].(XLSX)
The reference list from the paper itself. Each links out to its DOI / PubMed record.
- 1Chen Z, Ai L, Mboge MY, Tu C, Mc Kenna R, Brown KD, et al. Differential expression and function of CAIX and CAXII in breast cancer: A comparison between tumorgraft models and cells. P Lo S One. 2018;13(7):e 0199476. doi: 10.1371/journal.pone.0199476 29965974 PMC 6028082 · doi ↗ · pubmed ↗
- 2Mboge MY, Chen Z, Wolff A, Mathias JV, Tu C, Brown KD, et al. Selective inhibition of carbonic anhydrase IX over carbonic anhydrase XII in breast cancer cells using benzene sulfonamides: Disconnect between activity and growth inhibition. P Lo S One. 2018;13(11):e 0207417. doi: 10.1371/journal.pone.0207417 30452451 PMC 6242694 · doi ↗ · pubmed ↗
- 3Chen Z, Ai L, Mboge MY, Mc Kenna R, Frost CJ, Heldermon CD, et al. UFH-001 cells: A novel triple negative, CAIX-positive, human breast cancer model system. Cancer Biol Ther. 2018;19(7):598–608. doi: 10.1080/15384047.2018.1449612 29561695 PMC 5989806 · doi ↗ · pubmed ↗
- 4https://kmplot.com/analysis