Chromosome-level genome assembly of Cheilinus chlorourus (Bloch, 1791) (Perciformes: Labridae)
Jiangyong Qu, Xueying Yang, Zhuoran Song, Shuang Wang, Zhikai Xing, Lijun Wang, Xumin Wang

TL;DR
This study provides a high-quality chromosome-level genome assembly for the marine fish Cheilinus chlorourus, supporting future research on its genomics and ecology.
Contribution
The study presents the first chromosome-level genome assembly for a species in the Labridae family using a combination of sequencing technologies.
Findings
A 940.36 Mb genome was assembled, with 98.56% organized into 21 chromosomes.
29,213 protein-coding genes were identified, 79.93% of which were functionally annotated.
Abstract
In the classification of marine fish, the Labridae family ranks second in terms of species diversity and plays a vital role in coral reef ecosystems, comprising over 600 species across 82 genera. Despite its significance for ecological and evolutionary studies, genomic research on this group has lagged, resulting in a shortage of data, particularly regarding high-quality chromosome-level genome assemblies. To address this gap, this study focused on Cheilinus chlorourus from the Labridae family and successfully achieved a chromosome-level genome assembly. By integrating Illumina, PacBio, and Hi-C sequencing data, we assembled a genome measuring 940.36 Mb, with 926.86 Mb (98.56%) of the gene assembly organized into 21 chromosomes. A total of 29,213 protein-coding genes (PCGs) were identified, and 79.93% of these genes were functionally annotated. With this high-quality genome assembly,…
Genes, proteins, chemicals, diseases, species, mutations and cell lines named across the full text — each resolved to its canonical identifier and authoritative record.
Click any figure to enlarge with its caption.
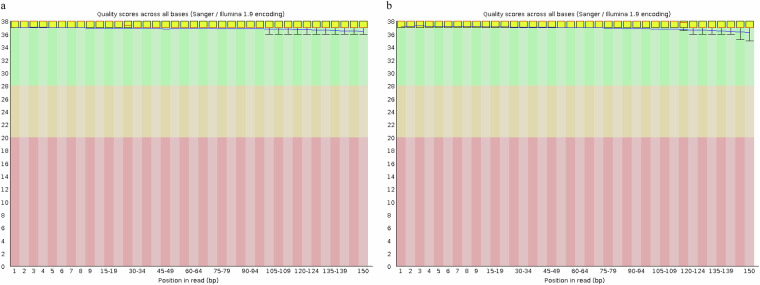 Figure 1
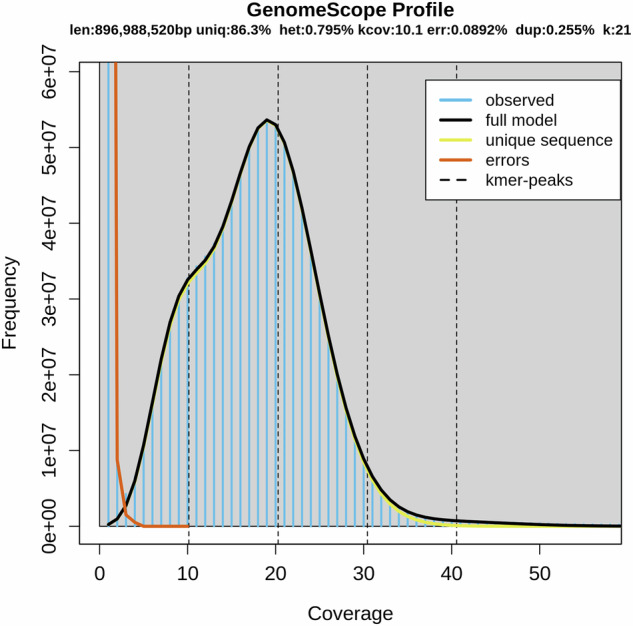 Figure 2
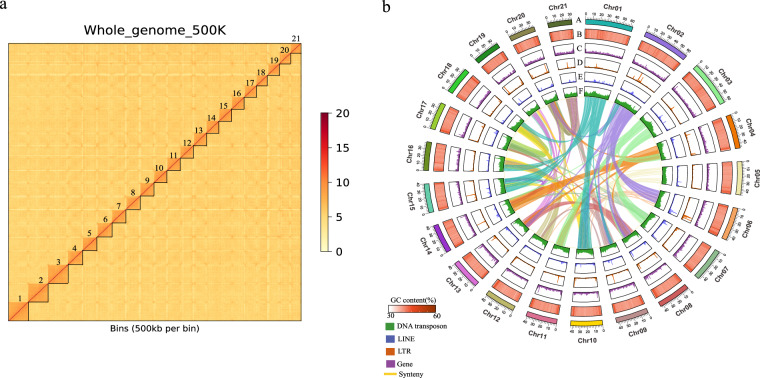 Figure 3
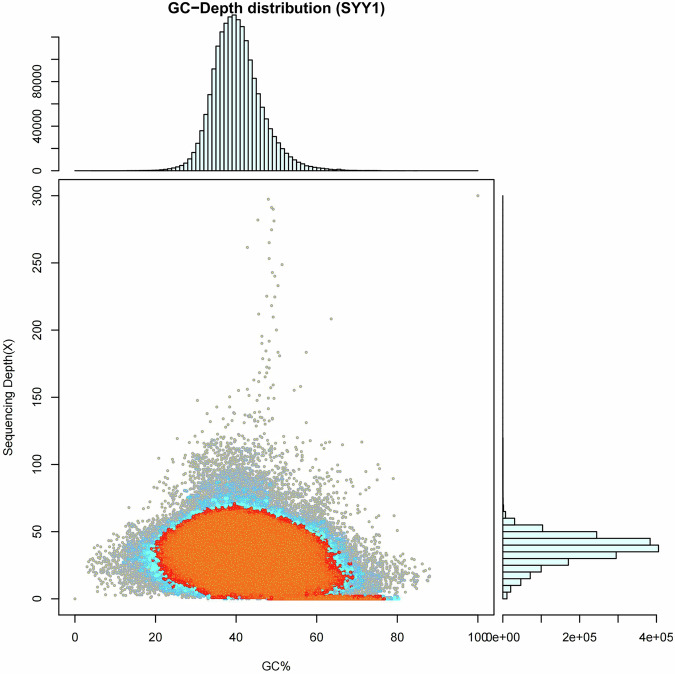 Figure 4
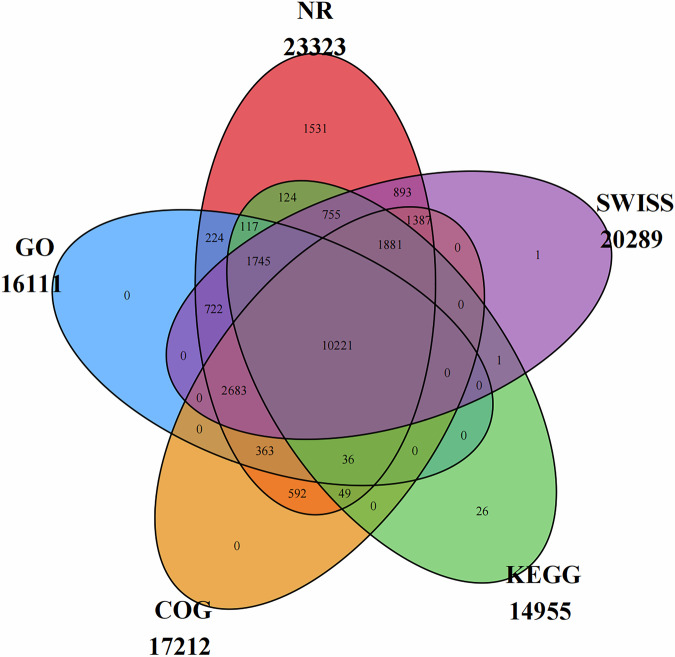 Figure 5
- —The Science and Technology Major Projects of Jilin Province () and the Shandong Provincial Natural Science Foundation (ZR2023QD150).
- —The Science and Technology Major Projects of Jilin Province (20230304002YY) and the Shandong Provincial Natural Science Foundation (ZR2023QD150).
Peer Reviews
No public reviews on file for this paper yet. If you reviewed it on a platform where reviews are public (OpenReview, ICLR, NeurIPS, ICML), you can paste yours below so the community can read it here.
Videos
No videos yet. Explain this paper in a talk, walkthrough, or lecture? Add one.
Taxonomy
TopicsGenomics and Phylogenetic Studies · Aquaculture disease management and microbiota · Coral and Marine Ecosystems Studies
Background & Summary
The Labridae family, renowned for its exceptional species diversity in marine ecosystems, ranks second in species richness among marine fish. It comprises over 600 species across 82 genera^1^. The Labridae family is notable for its significant morphological and ecological diversity, showcasing an impressive array of colors, shapes, and sizes^2,3^. This diversity makes it an excellent candidate for research on adaptive radiation, ecological niche differentiation, and the processes of sexual selection among species^4^. Additionally, fish from the Labridae family play a crucial role in coral reef ecosystems by maintaining biodiversity and ecological balance within these environments^5^.
Cheilinus chlorourus (Bloch, 1791) is a member of the genus Cheilinus in the order Perciformes and the family Labridae. It is widely distributed in coral reef ecosystems^6^. It is widely distributed across the Indian Ocean and the Pacific Ocean, as well as in the waters surrounding Taiwan and Hainan Island in China^7,8^. This species primarily inhabits coral reef areas characterized by mixed reef sand or regions with abundant seagrass^1,3^. The feeding habits of C. chlorourus are diverse, with a diet that mainly consists of fish, mollusks, crustaceans, polychaetes, and sea urchins^1^. C. chlorourus is a vital species in coral reef ecosystems^9^, playing an essential role in preserving biodiversity, material cycling, and ecological stability^10^. It is also a significant indicator for evaluating the evaluating the ecological health of coral reef. However, research on the biological traits of C. chlorourus is limited, particularly in the field of genomics. Like many other coral reef fish, there is a severe lack of genomic resources for C. chlorourus, with no genomic data currently available. Furthermore, genomic research on coral fishes, in general, has progressed slowly, resulting in insufficient data, especially regarding high-quality chromosome-scale genome sequences. This lack of information hinders a comprehensive understanding of evolutionary processes, adaptive radiation, and functional genomics in coral reef fish.
To address this research gap, this study integrated PacBio long-read sequencing, Illumina short-read sequencing, and Hi-C technology to assemble the first high-quality, chromosome-level genome of C. chlorourus. The resulting assembled genome measures 940.36 Mb, of which 926.86 Mb (98.56%) were anchored to 21 chromosomes. We identified 29,213 protein-coding genes (PCGs), 79.93% of which were functionally annotated. Furthermore, we discovered 6,661 non-coding RNAs (ncRNAs) and 468.4 Mb of repetitive elements. The genomic data from this research not only fill the gaps in the genomic information of C. chlorourus and provide a crucial foundation for understanding its biological characteristics, but also provide high-quality reference genomes for comparative studies of coral reef fish.
Methods
Sampling and sequencing
Samples were collected from the nearshore waters of Sanya, Hainan, China. Muscle tissue was isolated from the captured fish and used for DNA extraction, followed by genome sequencing and assembly. Immediately after collection, the muscle samples were rapidly frozen and preserved in liquid nitrogen to maintain their integrity until DNA extraction. The use of experimental animals was reviewed and approved by the Animal Welfare and Ethics Committee of Yantai University.
Muscle tissue DNA was isolated according to the manufacturer’s instructions using the E.Z.N.A^®^ Tissue DNA Kit (OMEGA, USA). The DNA was then fragmented into short segments ranging from 300 to 500 base pairs (bp) with a Covaris M220 device. The TruSeq^TM^ Nano DNA Sample Prep Kit (Illumina, USA) was employed to create a sequencing library containing 450 bp insert fragments. The libraries were quantified using the TBS-380 Picogreen technology from Invitrogen. Subsequently, high-throughput sequencing of the sample DNA was conducted on the Illumina NovaSeq 6000 platform^11^, generating 150 bp paired-end reads for genome surveys and base-level corrections. Following Illumina sequencing, approximately 22.05 Gb of initial sequence data were obtained (Table 1). Using FastQC software^12^, we analyzed the base-level quality of the Illumina raw sequencing data. The results indicated that all data had base quality scores within the green region, signifying high quality (Fig. 1). To enhance the accuracy of subsequent genome assembly, we opted to use Trimmomatic v0.39^13^ (https://www.usadellab.org/cms/index.php?page=trimmomatic) for quality control and trimming of the raw data. This step effectively removed adapter contamination and poor-quality read segments, ensuring robust downstream analyses. As a result, approximately 21.95 Gb of clean data was obtained.Table 1. Statistics of second-generation sequencing data (Illumina sequencing and Hi-C sequencing).Libraries typesInter size (bp)Raw data (Mb)Clean data (Mb)Q20 (%)Q30 (%)Illumina reads45022,046.621,951.899.0297.13Hi-C reads450128,962118,09198.7696.86Fig. 1Base quality distribution of Illumina raw data. (a) R1, (b) R2. The horizontal axis represents the coordinates of the read bases, while the vertical axis indicates the base masses of the reads (Solexa Scale: 40 = Highest, −15 = Lowest). The box plot illustrates the distribution of mass values for all bases at each position. The red line indicates the median base mass, while the blue line represents the concatenation of the mean values at each position.
After preparing the SMRTbell library, high-fidelity (HiFi) sequencing was performed on the PacBio Sequel II platform^14^. The raw sequencing data underwent several processing steps, including adapter removal, filtering of low-quality reads, and correction of sequencing errors. This process resulted in 35.34 Gb of data with a mean read length of 20.85 Kb (Table 2). DNA from an individual C. chlorourus was utilized to create a Hi-C library for chromosome-scale genome assembly^15,16^. Cells were exposed to formaldehyde to facilitate the cross-linking of DNA and proteins, thereby maintaining the stability of the DNA structure. The MboI restriction enzyme was employed to cleave the cross-linked DNA into fragments with sticky ends following cell lysis. The resulting DNA fragments underwent end repair and were simultaneously labeled with biotinylated oligonucleotides. Adjacent DNA fragments were then circularized through ligation using T4 DNA ligase. The cross-linked DNA-protein complexes were subsequently digested with protease to release the DNA. After purification, the DNA was fragmented to a size range of 500–700 bp. Streptavidin-coated magnetic beads were utilized to isolate biotin-labeled DNA, facilitating the construction of sequencing libraries compatible with next-generation sequencing platforms. The quantification and sequencing of the Hi-C libraries were conducted on the Illumina NovaSeq 6000 platform, generating data to support chromosome-scale genome assembly^17^. Following sequencing, the raw data underwent rigorous quality control, which included the removal of splice sequences, elimination of low-quality bases, and de-weighting. Approximately 118.09 Gb of high-quality clean data were obtained through this process (Table 1).Table 2. PacBio HiFi sequencing data statistics table.Reads NumberReads Bases(bp)Largest Length(bp)N50 Length(bp)N90 Length(bp)Average Length(bp)1,694,83435,336,828,52660,85921,32015,19120,850
Genome complexity assessment of C. chlorourus
Prior to genome assembly, K-mer statistical analysis was employed to estimate the genome size of C. chlorourus^18,19^. By analyzing the sequencing data using 21-mers, the estimated genome size was approximately 897.0 Mb, with the samples exhibiting a heterozygosity rate of 0.795% and a duplication rate of 0.255%. The substantial amount of non-repetitive sequences (unique) and the minimal error rate (error) indicated that the quality characteristics of the sequencing data were high (Fig. 2).Fig. 2. The genomic K-mer frequency distribution plot. (len: estimated genome size; uniq: proportion of non-repetitive sequences; het: heterozygosity; kcov: depth of heterozygous peak coverage; err: proportion of kmer generated by sequencing errors; dup: proportion of repetitive sequences; k: size of kmer used for evaluation).
Genome de novo assembly of C. chlorourus
Assemble three generations of PacBio HiFi long reads using the Hifiasm software^20^ (https://github.com/chhylp123/hifiasm). Hifiasm is a rapid and efficient de novo assembler specifically optimized for PacBio HiFi read lengths^20^. It processes all high-fidelity (HiFi) reads in memory for comparison and error correction. During this process, if a base in a read differs from the others and is supported by a minimum of three reads, it is identified as a single nucleotide polymorphism (SNP) and preserved; if this condition is not met, it is corrected as a sequencing error. This correction process eliminates most errors while preserving heterozygous variant information, significantly enhancing the accuracy of haplotype assembly. Based on the sequencing data, we have preliminarily constructed a genomic framework with a total length of approximately 940.36 Mb, which includes 39 scaffolds and a scaffold N50 of 42.47 Mb (Table 3). These results are consistent with the genome complexity estimates obtained from K-mer analysis.Table 3. Comparison of the assembled genomes of C. chlorourus with those of C. undulatus and L. mixtus.FeaturesCheilinus undulatus^24^Cheilinus chlorourusLabrus mixtus^25^Estimated genome size (Mb)1,173.2870.0740.6Contig number329103894Contig N50 (bp)16,477,22239,597,8492,678,957Scaffold number4539324Total length (bp)1,170,280,289940,359,651740,579,663Scaffold N50 (bp)51,466,93542,465,20430,403,003GC contents (%)39.540.3641Number of chromosomes242124Length of scaffolds anchored on chromosomes (Mb)1,170.0 (99.98%)926,86 (98.56%)679.85 (94.23%)
Chromosome-level genome assembly
Hi-C technology-assisted scaffold construction was utilized in the genome assembly process^21^. The overlapping clusters were analyzed using ALLHIC (v0.9.8) software (https://github.com/tanghaibao/allhic) to assess their associations^22,23^. The principle of Hi-C assisted assembly is based on the idea that cis interactions are stronger than trans interactions, and that cis interactions are enhanced as the linear distance between elements decreases. This principle facilitates the clustering, sorting, and orientation of contigs or scaffolds, which is essential for assembling a chromosome-level genome. The assembly was conducted using 118.09 Gb of clean data obtained from the Hi-C library (Table 1). The resulting sequences, totaling 926.86 Mb (98.56%), were successfully anchored and assigned to 21 chromosomes, with sizes ranging from 30.07 Mb to 63.24 Mb (Tables 3, 4). Compared to its congeneric species member Cheilinus undulatus (GCA_018320785.1)^24^, the genome of C. chlorourus is smaller in size. This difference reflects variations in the evolutionary history of the genomes between species rather than disparities in sequencing quality. In terms of assembly quality, the C. chlorourus genome demonstrates superior continuity, with a contig N50 of 39.6 Mb, which surpasses that of C. undulatus. Additionally, the fewer scaffolds observed in this study indicate a more compact assembly structure. When compared to Labrus mixtus (GCA_963584025.1)^25^, a member of the same family, C. chlorourus exhibits significant advantages across all assembly metrics, further confirming the higher completeness and practical utility of its genomic sequence (Table 3). Furthermore, to evaluate the quality of the chromosome-level genome assembly, we generated a whole-genome Hi-C heat map (Fig. 3a). This heatmap clearly delineated all 21 chromosomes, with significantly stronger interaction signals along the diagonal compared to other regions, indicating a high-quality genome assembly.Table 4. Assembly sequence length statistics.IDLength (bp)GC_contentIDLength (bp)GC_contentChr0163,236,60840.27%Chr1241,610,17040.07%Chr0262,688,11740.23%Chr1340,719,28640.27%Chr0362,431,37840.43%Chr1440,249,60340.32%Chr0447,434,78840.10%Chr1540,117,93940.11%Chr0546,156,84339.99%Chr1639,750,63740.26%Chr0646,013,10040.53%Chr1737,895,31140.36%Chr0745,882,78340.23%Chr1837,250,22140.68%Chr0843,880,98940.44%Chr1936,248,22440.72%Chr0943,841,75240.09%Chr2035,206,80640.76%Chr1042,465,20440.11%Chr2132,067,31640.76%Chr1141,716,59640.39%———Total (bp)926,863,671—Fig. 3. Hi - C assembly chromosome interaction heat map (a) and genome circle map of C. chlorourus (b). The circle map from the outside in: “A”represents chromosomes; “B”represents the GC content; “C”represents the gene density; “D”represents the LTR density; “E”represents the LINE density; “F”represents represents the DNA transposon density. Window size = 100 kb. Each central line in the circle represents connections between homologous gene pairs.
Assessment of the genome assemblies
To assess the quality of the genome assemblies, GC-Depth analysis was employed to identify potential biases in GC composition or non-target DNA contamination^26^. The sequencing reads were initially aligned to the constructed genomic sequences, followed by an analysis of both GC content and sequencing depth. Subsequently, correlation analyses between GC characteristics and sequencing depth were conducted. The findings indicated no significant GC bias, suggesting that the sequencing was performed with exceptional quality (Fig. 4). Furthermore, the integrity of the assembly was evaluated using Benchmarking Universal Single-Copy Orthologs (BUSCO v5.3.2) software^27,28^ (https://busco.ezlab.org/). The analysis revealed that out of 3,640 single-copy genes, 98.9% were found to be complete. Specifically, single-copy genes account for 97.9%, while duplicated genes make up 1.0%. The proportion of fragmented genes is 0.2%, and 0.9% of genes are missing in the assembled genome (Table 5). The low rates of duplications and deletions, combined with the high alignment rate of the raw sequencing data, collectively indicate that the quality of our assembly is high. The Merqury^29^ method was employed to evaluate the accuracy and completeness of the assembled genome. The quality value (QV) of the genome was determined to be 65.5965, with an error rate of 2.75642 e - 07. These assessment results further validated the completeness of the C. chlorourus genome assembly.Fig. 4. Graphical representation of the correlation between GC content and depth of sequencing. (The horizontal coordinates represent GC content, while the vertical coordinates indicate sequencing depth. The right side displays the distribution of sequencing depth, and the top shows the distribution of GC content. In this scatter plot, the red area highlights regions where the density of dots is relatively high).Table 5. Busco assessment results.TypeNumberPercentage (%)Complete BUSCOs (C)3,60298.9%Complete and single-copy BUSCOs (S)3,56597.9%Complete and duplicated BUSCOs (D)371.0%Fragmented BUSCOs (F)90.2%Missing BUSCOs (M)290.9%Total BUSCO groups searched3,640—
Repetitive sequence analysis
Prior to identifying and functionally annotating coding genes within the genome, we first classified duplicated sequences in the C. chlorourus genome using both homology-based alignment and de novo prediction methods. Scattered repeats were identified using RepeatMasker software^30^. Tandem Repeats Finder (TRF)^31^ was employed to detect tandem repeat sequences in the DNA. RepeatMasker identifies scattered repeats by aligning sequences with a database of known repetitive elements, such as Repbase. TRF analyzes tandem repeat sequences by validating percentages and examining the frequency of insertions and deletions (InDels) in neighboring patterns, applying statistical criteria for identification. Ultimately, we identified 468.4 Mb of repetitive sequences, which included 325.3 Mb of scattered repeats and 143.1 Mb of tandem repeats, accounting for 49.8% of the entire assembled genome. Among the scattered repeats, DNA transposons (DNAs) constituted the largest portion, totaling 136.9 Mb, while short interspersed nuclear elements (SINEs) represented the smallest portion at 2.6 Mb, which is 0.28% of the entire genome (Table 6).Table 6. Repeat elements in C. chlorourus genome.TypeNumberTotal Length (bp)In Genome (%)Interspersed repeats LTR74,55423,052,9682.4515 DNA740,847136,940,46514.5626 LINE148,77335,518,6703.7771 SINE20,9172,607,8770.2773 RC36,8188,690,8010.9242 scRNA000 Unknown695,815128,977,27113.7157 Subtotal1,717,724325,308,95234.5941Tandem repeats TRF289,34580,186,5468.5272 Minisatellite DNA187,78655,822,6795.9363 Microsatellite DNA53,8207,083,2980.7533 Subtotal530,951143,092,52315.2168 Total2,248,675468,401,47549.8109
Prediction of non-coding genes
The identification of tRNA regions and their corresponding secondary structures was performed using tRNAscan-SE v2.0.7^32^, while rRNA sequence predictions were made through RNAmmer software^33^. A total of 2,765 tRNAs were identified with tRNAscan-SE, and 2,679 rRNA genes were predicted by RNAmmer. The prediction of miRNA, snRNA, and sRNA followed a similar workflow, beginning with comparative annotations against the Rfam database^34^ using Rfam software^35,36^. This was followed by the CMsearch program^37^, which employed default parameters to identify the final sRNAs, snRNAs, and miRNAs. In total, 619 snRNAs and 598 miRNAs were predicted (Table 7).Table 7. Non-coding RNA result statistics.TypeNumberAverage length (bp)Total length (bp)In Genome (%)tRNA2,76574207,2510.022rRNA_de5S2,535115290,548—5.8S000—18S721,845132,8460.099228S727,076509,493—rRNA_ho5S————5.8S————18S————28S————sRNA0000snRNA61914288,2400.0094miRNA5987545,0640.0048
Prediction of protein-coding genes
To perform gene prediction on the C. chlorourus genome, we integrated multiple approaches, including de novo prediction, comparison of homologous protein sequences, and analysis of transcriptome data. The reference genome of C. undulatus (GCA_018320785.1)^24^ was utilized to train the de novo gene prediction software AUGUSTUS v3.2.3^38^ (https://bioinf.uni-greifswald.de/augustus/). The predictions based on homology were conducted using protein sequences from C. undulatus, which were aligned with the C. chlorourus genome sequences via TBLASTn^39^. Poorly matched results were filtered out, and redundancies were removed. GeneWise v2.4.1^40^ (https://www.ebi.ac.uk/seqdb/confluence/display/THD/GeneWise) was then employed for precise comparisons to identify the coding and intron regions of the genes. Transcriptome data from muscle tissues were aligned with the genome sequences using TopHat v2.1.1^41^ (https://ccb.jhu.edu/software/tophat/index.shtml), and transcripts were assembled using Trinity v2.11.0^42^ (https://github.com/trinityrnaseq/trinityrnaseq/releases). The resulting gene sets were integrated using EVidenceModeler v1.1.1^43^ (https://evidencemodeler.github.io/). In total, 29,213 protein-coding genes were identified (Table 8). To validate the accuracy of gene prediction, we compared the green-tailed lipped fish genome with published genomes of eight other fish species: C. undulatus^24^, L. mixtus^25^, Labrus bergylta^44^, Sebastes umbrosus^45^, Pseudochaenichthys georgianus^46^, Notolabrus celidotus^47^, Acanthochromis polyacanthus^48^, and Stegastes partitus^49^. The results demonstrated that key genomic features—including the number of protein-coding genes, average gene length, CDS length, and exon length—were comparable to those of other species, supporting the high quality of the genome assembly and annotation (Table 8).Table 8. Statistical table of coding gene information.SpeciesGene numberAverage gene length (bp)Average CDS length (bp)Average exon length (bp)Average intron length (bp)Average exons per geneC. chlorourus29,21314,879.451,538.60184.851,831.708.4C. undulatus23,31630,378.471,829.37293.372,676.8410.5L. mixtus22,74020,702.072,176.52267.751,847.7813.2L. bergylta23,51019,105.061,838.40313.671,527.9910.5S. umbrosus23,88122,843.001,839.73279.001,882.3310.5P. georgianus23,28721,975.502,003.35251.052,085.5712.0N. celidotus22,74023,263.181,995.87269.302,010.0711.9A. polyacanthus23,92126,022.881,807.07324.652,140.1310.4S. partitus22,58919,484.581,770.82259.781,665.6111.9
For the assembled genome sequences of the sequenced samples, the genomic features of C. chlorourus were visualized alongside the coding genes and the results of repeat predictions. Circular genome maps were generated using Circos software^50^, illustrating gene counts, repeat densities, and GC content (Fig. 3b).
Functional annotation of genes
The protein sequences derived from the predicted genes were functionally annotated by querying the Nr (https://ftp.ncbi.nlm.nih.gov/blast/db/FASTA/nr.gz), GO^51^, KEGG^52^, eggNOG, and Swiss-Prot^53^ databases using BLASTp (BLAST + 2.7.1)^54^. A stringent E-value threshold of ≤1e-5 was applied to ensure the reliability of the matches. To maintain biological relevance, only the best match from potentially multiple results for each sequence comparison was retained as the database comparison information for the gene. Ultimately, we successfully annotated 23,351 unigenes, representing 79.93% of the total predicted genes, in at least one database (Table 9, Fig. 5).Table 9. Statistical table of coding gene information.DB_nameTotal_unigenesAnnoted_unigenesPercent (%)NR29,21323,32379.84GO29,21316,11155.15COG29,21317,21258.92KEGG29,21314,95551.19SWISS29,21320,28969.45In_all_DB29,21310,22134.99AT_least_one_DB29,21323,35179.93Fig. 5Venn diagram illustrating the number of functionally annotated genes across multiple public databases.
Data Records
The raw sequencing data used in this study included Illumina genomic reads (SRR32550678)^55^, PacBio long reads (SRR32550677)^56^, RNA-seq reads (SRR32550675)^57^, and Hi-C data (SRR32550676)^58^ all of which have been uploaded to the NCBI database. This whole genome shotgun project has been deposited at DDBJ/ENA/GenBank under the accession JBMUMZ000000000^59^. The assembly and annotation information has been uploaded to Figshare^60^.
Technical Validation
Data filtering and quality control
The preliminary quality evaluation of raw sequencing data was conducted using FastQC v0.11.8, as raw reads often contain low-quality segments. To enhance the accuracy of downstream assembly, Trimmomatic v0.39 was employed to trim the raw data. This process involved several steps: removing splice sequences from the reads, discarding bases with non-AGCT characters at the 5′ end prior to trimming, and trimming reads with low sequencing quality (defined as a quality score below Q20). Additionally, reads with more than 10% ambiguous bases (N) were eliminated, and fragments shorter than 75 base pairs were discarded after adapter removal and quality trimming. The resulting high-quality reads were saved in FASTQ format for subsequent analysis.
Assembly validation
To ensure the precision and integrity of the assembled genome for subsequent functional annotation and cross-species genomic comparisons, a comprehensive quality assessment was conducted following the assembly process. The assembly quality was validated through a comprehensive approach comprising four methods: K-mer analysis, GC depth analysis, BUSCO assessment, and Merqury analysis. The application of 21-mer frequency analysis enabled the simultaneous determination of genomic parameters, including size, heterozygosity, and duplication rates, as well as the quality assessment of sequencing data. The distribution of GC content and sequencing coverage for the assembled sequences was examined through the GC depth distribution map. The BUSCO assessment was performed to evaluate the completeness and accuracy of the genome assembly by utilizing a set of highly conserved single-copy orthologous genes as references. Merqury is a genome assembly quality assessment tool that utilizes k-mer analysis to evaluate the accuracy (QV) and completeness of an assembly without depending on a reference genome.
The reference list from the paper itself. Each links out to its DOI / PubMed record.
- 1Nelson, J. S., Grande, T. C. & Wilson, M. V. H. Fishes of the World (fifth ed.). John Wiley & Sons edn http://lccn.loc.gov/2015037522 (2016).
- 2Asriyana, A., Irawati, N. & Halili, H. J. B. Length-weight relationships and ponderal index of three reef fish (Teleostei: Labridae) off the Tanjung Tiram coast, Southeast Sulawesi, Indonesia. Biodiversitas. 21 (2020).
- 3Liu, B. et al. Estimation of genomic characteristics by analyzing k-mer frequency in de novo genome projects. ar Xiv:Genomics. (2013).
- 4Yi-Bin, W. & Xingtan, Z. Chromosome scaffolding of diploid genomes using ALL Hi C. Bio-protocol 12 (2022).
- 5NCBI Gen Bankhttps://identifiers.org/ncbi/insdc.gca:GCA_902827115.2 (2-22).
- 6NCBI Gen Bankhttps://identifiers.org/ncbi/insdc.gca:GCA_009762535.1 (209).