Genome‐Wide Analyses of Phosphate Transporters in Wild Rice (Oryza brachyantha) Revealed Their Evolution and Regulatory Roles in Phosphate Homeostasis
Xusheng Zhao, Wai‐Shing Yung, Kejing Fan, Shengjie Chen, Hon‐Ming Lam

TL;DR
This study identifies a wild rice species with high phosphorus uptake efficiency and explores the evolution and function of its phosphate transporter genes.
Contribution
The study provides novel insights into the genetic diversity and regulatory roles of phosphate transporters in a wild rice species.
Findings
Oryza brachyantha was identified as a wild rice species with high phosphorus uptake efficiency.
31 ObPT genes were identified, with six OsPT orthologs lost during adaptation to the African savanna.
Dynamic gene expression patterns suggest efficient phosphorus reutilization in roots and leaves under Pi starvation.
Abstract
Recently, considerable progress has been made in understanding how cultivated rice adapts to phosphate (Pi) deficiency stress. However, little has been achieved in the genetic exploration of wild rice accessions, which are crucial for the development of new varieties adapted to Pi‐limited soils. In this study, we evaluated a collection of wild rice accessions for their phosphorus (P) absorption efficiencies using a hydroponic system, and identified Oryza brachyantha, a distant relative of the cultivated rice, as a promising candidate. Our investigation of phosphate transporters (PTs) in this wild species uncovered 31 ObPT genes across five families and analyzed their corresponding protein sequences. Phylogenetic and synteny analyses revealed that these ObPT proteins were highly conserved with their counterparts in cultivated rice ( Oryza sativa ), but six OsPT orthologs were lost from…
Genes, proteins, chemicals, diseases, species, mutations and cell lines named across the full text — each resolved to its canonical identifier and authoritative record.
Click any figure to enlarge with its caption.
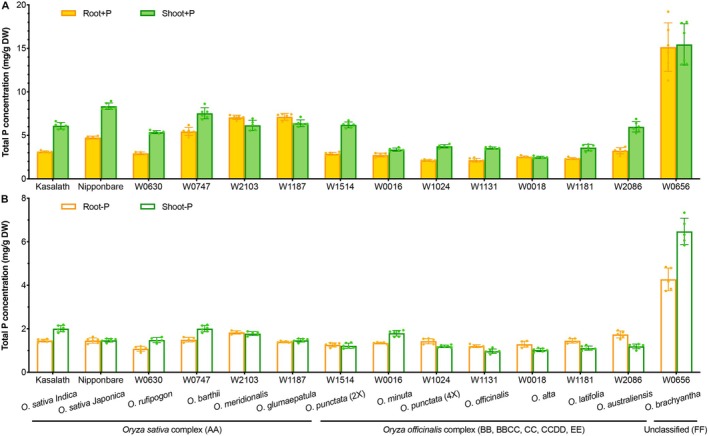 FIGURE 1
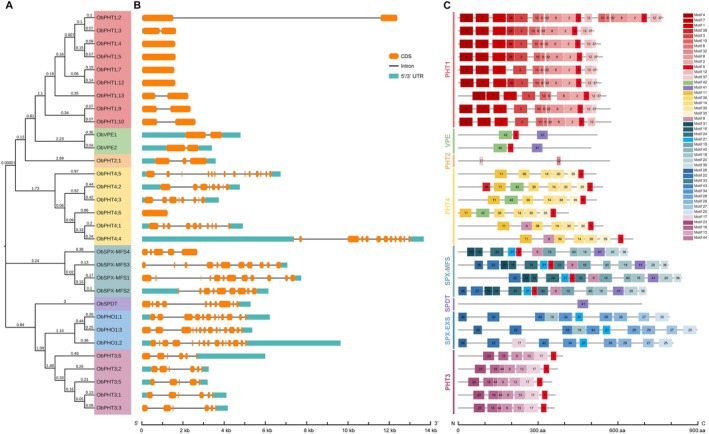 FIGURE 2
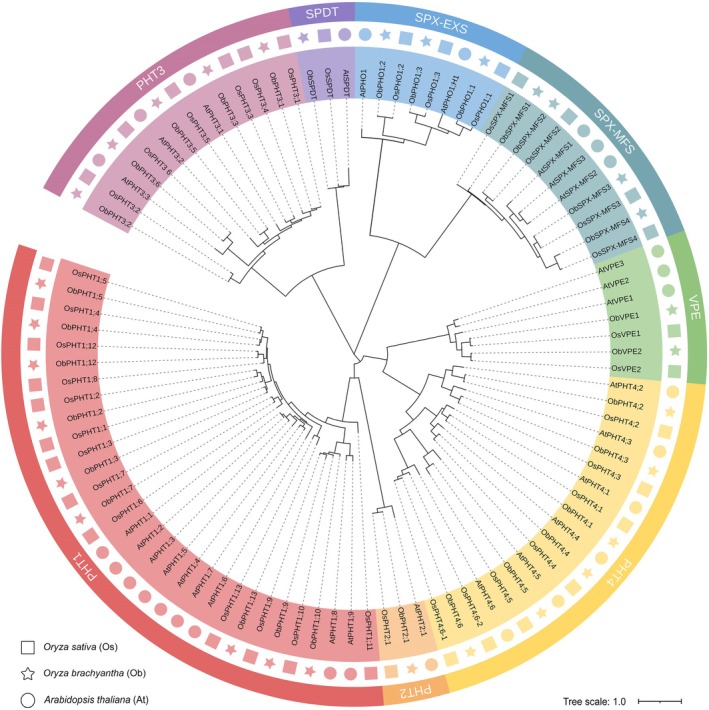 FIGURE 3
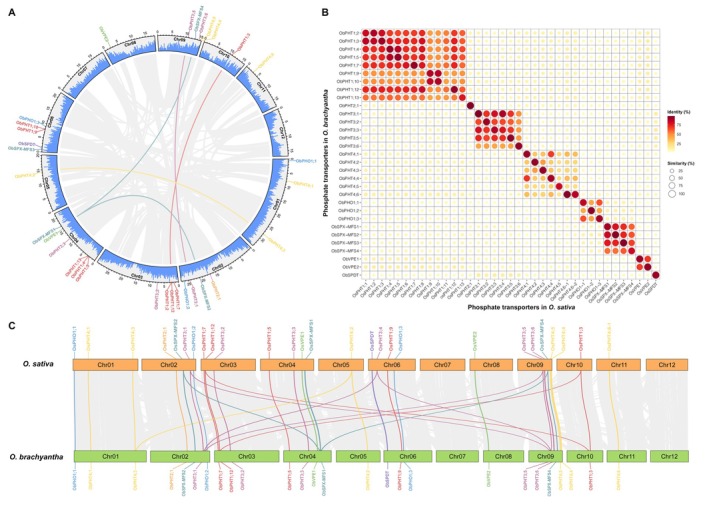 FIGURE 4
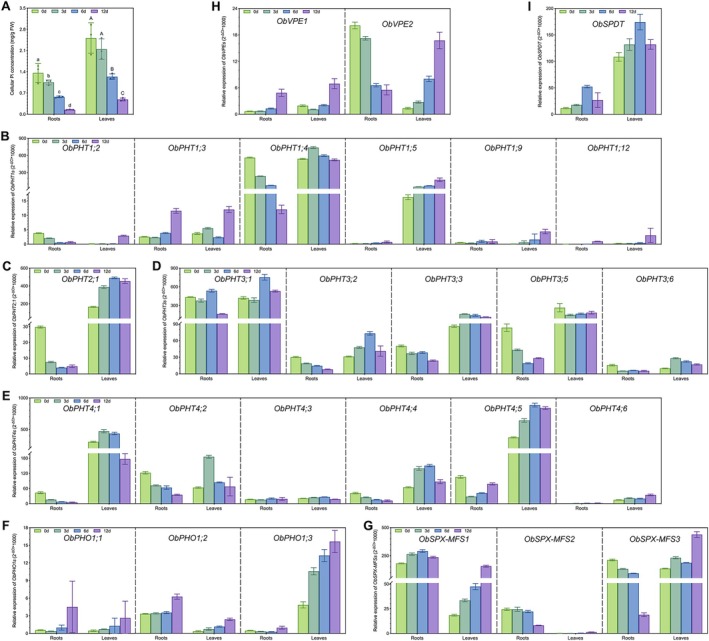 FIGURE 5
| Clade | Protein name | Transcript ID | Gene position | Protein length (aa) | Isoelectric point | MW (kDa) | No. of TMS |
|---|---|---|---|---|---|---|---|
| PHT1 | ObPHT1;2 | Ob03G000312.1 | Chr03:2362675‐2375057 | 769 | 8.93 | 84.7 | 18 |
| ObPHT1;3 | Ob10G000666.1 | Chr10:10611962‐10613608 | 510 | 8.94 | 55.4 | 12 | |
| ObPHT1;4 | Ob04G000209.1 | Chr04:2644524‐2646131 | 535 | 8.48 | 58.7 | 12 | |
| ObPHT1;5 | Ob04G000208.1 | Chr04:2626382‐2628010 | 542 | 8.48 | 59.3 | 12 | |
| ObPHT1;7 | Ob03G000231.1 | Chr03:1689833‐1691401 | 522 | 8.63 | 56.4 | 12 | |
| ObPHT1;9 | Ob06G000923.1 | Chr06:8123817‐8126181 | 571 | 8.77 | 70 | 12 | |
| ObPHT1;10 | Ob06G000924.1 | Chr06:8128902‐8131501 | 574 | 8.97 | 61.5 | 12 | |
| ObPHT1;12 | Ob03G000311.1 | Chr03:2357331‐2358944 | 537 | 8.8 | 58.4 | 12 | |
| ObPHT1;13 | Ob04G000211.1 | Chr04:2669743‐2671966 | 556 | 8.75 | 61.1 | 13 | |
| PHT2 | ObPHT2;1 | Ob02G001466.1 | Chr02:17078510‐17082085 | 569 | 9.57 | 59 | 13 |
| PHT3 | ObPHT3;1 | Ob02G002229.1 | Chr02:24589392‐24593491 | 365 | 9.3 | 38.6 | 8 |
| ObPHT3;2 | Ob03G000931.1 | Chr03:7359777‐7363015 | 373 | 8.77 | 39.9 | 6 | |
| ObPHT3;3 | Ob04G000851.1 | Chr04:11588533‐11592698 | 361 | 9.18 | 37.9 | 5 | |
| ObPHT3;5 | Ob09G000695.1 | Chr09:10745841‐10749027 | 351 | 8.87 | 37 | 3 | |
| ObPHT3;6 | Ob09G001116.1 | Chr09:14675729‐14681709 | 392 | 9.47 | 42.6 | 5 | |
| PHT4 | ObPHT4;1 | Ob01G000885.1 | Chr01:7711502‐7716397 | 544 | 8.85 | 58 | 11 |
| ObPHT4;2 | Ob05G001213.2 | Chr05:14519729‐14524477 | 532 | 9.49 | 55.9 | 12 | |
| ObPHT4;3 | Ob01G002592.1 | Chr01:28115344‐28119073 | 520 | 10.42 | 55.9 | 11 | |
| ObPHT4;4 | Ob09G001198.4 | Chr09:15346697‐15360363 | 656 | 9.26 | 72.3 | 11 | |
| ObPHT4;5 | Ob09G001126.2 | Chr09:14799973‐14806698 | 506 | 5.96 | 54.2 | 10 | |
| ObPHT4;6 | Ob11G000407.1 | Chr11:3146809‐3148053 | 414 | 9.71 | 44.9 | 11 | |
| SPX‐EXS | ObPHO1;1 | Ob01G000059.1 | Chr01:493343‐499546 | 793 | 9.24 | 91.1 | 5 |
| ObPHO1;2 | Ob02G002414.1 | Chr02:26404452‐26414085 | 806 | 9.52 | 90.6 | 7 | |
| ObPHO1;3 | Ob06G000976.1 | Chr06:8970708‐8976056 | 897 | 9.11 | 101.6 | 7 | |
| SPX‐MFS | ObSPX‐MFS1 | Ob04G001397.1 | Chr04:16692010‐16699734 | 838 | 6.18 | 93 | 11 |
| ObSPX‐MFS2 | Ob02G001835.1 | Chr02:20821203‐20827334 | 707 | 5.71 | 79 | 10 | |
| ObSPX‐MFS3 | Ob06G000145.2 | Chr06:950172‐957223 | 760 | 8.78 | 84.5 | 12 | |
| ObSPX‐MFS4 | Ob09G000977.1 | Chr09:13403693‐13406382 | 638 | 4.86 | 68.7 | 10 | |
| VPE | ObVPE1 | Ob04G001317.1 | Chr04:15768175‐15772954 | 522 | 8.7 | 56.2 | 12 |
| ObVPE2 | Ob08G000289.1 | Chr08:2243395‐2246789 | 499 | 7.69 | 53.5 | 12 | |
| SPDT | ObSPDT | Ob06G000218.1 | Chr06:1488456‐1493724 | 690 | 9.35 | 74.3 | 12 |
- —the Lo Kwee‐Seong Biomedical Research Fund
- —the Hong Kong Research Grants Council Area of Excellence Scheme
- —Innovation and Technology Commission10.13039/501100003452
Peer Reviews
No public reviews on file for this paper yet. If you reviewed it on a platform where reviews are public (OpenReview, ICLR, NeurIPS, ICML), you can paste yours below so the community can read it here.
Videos
No videos yet. Explain this paper in a talk, walkthrough, or lecture? Add one.
Taxonomy
TopicsPlant nutrient uptake and metabolism · Plant Micronutrient Interactions and Effects · Phosphorus and nutrient management
Introduction
1
Phosphorus (P) is an indispensable macronutrient for all living organisms, including plants, as it provides the integral backbone for the biosynthesis of nucleic acids, phospholipids, and the energy‐carrying molecule, ATP. Moreover, P is involved in important regulatory functions in metabolism and signal transduction through phosphorylation and protein activation (Raghothama 1999). Although P is abundant in the topsoil, it is commonly bound to soil particles or fixed in the form of P‐containing organic compounds, thereby limiting the bioavailability of P in the soil, especially for inorganic phosphate (Pi)—the major form of P assimilated by plant roots. Consequently, over half of the global arable land suffers from Pi deficiency, leading to compromised plant growth and reduced crop yields (Lynch 2011). This has prompted the extensive application of inefficient, non‐renewable, and polluting synthetic Pi fertilizers in agricultural practices to enhance crop productivity, especially in developing nations (Cordell et al. 2009). Therefore, we urgently need more sustainable alternative approaches to reducing the reliance of agriculture on Pi fertilizers while ensuring food security.
Recent advances have provided considerable insights into how both wild and cultivated plant species adapt to low‐Pi stress, which can be harnessed to breed or engineer crops with enhanced Pi acquisition or utilization efficiency (Dissanayaka et al. 2021). One strategy used by plants to liberate Pi from organic compounds in the soil is by secreting acid phosphatase and organic anions through the roots, as well as optimizing the root architecture to maximize the interactions with symbiotic microbes for the efficient Pi acquisition from the rhizosphere. Meanwhile, at the intercellular level, P is highly mobile within plants, and when a deficiency occurs, it may be translocated from old plant tissues to young and vigorously growing areas to enhance P utilization (Wang et al. 2010). These mechanisms are regulated by complex regulatory networks, involving Pi transporters (PTs) and other Pi starvation‐induced genes (PSIs).
Both low‐affinity and high‐affinity PTs in roots enable plants to absorb soluble Pi from the soil solution, where Pi is typically present at the micromolar level (Holford 1997; Lambers and Plaxton 2015; Lopez‐Arredondo et al. 2014). After entering the root symplast, Pi can be metabolized in the cytoplasm, or translocated by PTs into adjacent cells or subcellular compartments, where the vacuole acts as a temporary reservoir (Liu et al. 2014). These transporters are categorized into five families: H^+^‐coupled Phosphate Transporters (PHTs), SYG1/PHO81/XPR1‐ERD1/XPR1/SYG1 (SPX‐EXS/PHO), SPX‐Major Facility Superfamily (SPX‐MFS), Vacuolar Phosphate Efflux transporters (VPEs) and SULTR‐like Phosphorus Distribution Transporter (SPDT) (Wang, Chen, and Wu 2020; Xu et al. 2019). Based on the degrees of sequence identity and varied subcellular localizations, plant PHTs are further divided into the PHT1, PHT2, PHT3, and PHT4 subfamilies, whose members are localized to the plasma membrane, chloroplast, mitochondrion, and the Golgi membrane, respectively (Liu et al. 2011). As the largest and the most widely studied PT family, PHTs have been the primary focus of genome‐wide identification and characterization studies followed by detailed functional gene research (Ahmad et al. 2021; Lhamo et al. 2020; Liu et al. 2011; Wang, Xiao, et al. 2020; Yang et al. 2020). However, this approach has overlooked the relationships between PHTs and other PT families in phylogenetic and synteny analyses.
As one of the major staple foods worldwide, the production of rice ( Oryza sativa L.) needs to be further increased to ease the pressure from population growth and climate change. Like Arabidopsis, rice is a model plant that has been well studied in agricultural research. However, the genetic diversity of cultivated rice is limited compared to its wild relatives in the same genus. Over 20 wild species in the genus Oryza have been identified, exhibiting considerable genomic diversity, including varied genome sizes and the existence of AA, BB, CC, BBCC, CCDD, EE, FF, GG, KKLL, HHJJ, and HHKK genome types (Sanchez et al. 2013). In addition, these wild species are found in almost all tropical and subtropical regions, making them uniquely capable of surviving under a wide variety of environmental stresses and climate conditions. These widely distributed wild rice relatives constitute a huge genetic reservoir for crop improvement that can be exploited for breeding new rice varieties adapted to sub‐optimal Pi conditions. However, little effort has been made to conduct genetic research and germplasm exploitation in wild rice relatives, particularly in the context of P assimilation and re‐utilization.
In this study, we screened two cultivated rice subspecies and 12 wild rice species to assess their ability to accumulate P in root and shoot tissues. Among them, Oryza brachyantha displayed exceptional P accumulation under both normal and Pi‐depleted conditions, indicating a unique P use efficiency in this FF‐genome species. Unfortunately, there has been a lack of research on gene identification and functional validation since the reference genome of O. brachyantha was released a decade ago (Chen et al. 2013), so we conducted a genome‐wide identification and characterization of all putative PTs in O. brachyantha, to understand the molecular basis of its extraordinary P accumulation capacity and to elucidate the evolutionary history of PT genes in plants. Phylogenetic and synteny analyses revealed that all 31 putative ObPTs are highly conserved between cultivated rice and O. brachyantha, while 28.6% of the OsPHT orthologs were lost in the O. brachyantha genome during the adaptation by the latter to the African savanna. The temporal and spatial expression patterns of ObPT genes in roots and leaves were also determined under different Pi conditions. These findings offer insights into the Pi adaptation strategies employed by wild rice species, which will be useful for providing genetic resources for crop improvement.
Materials and Methods
2
Plant Materials and Growth Conditions
2.1
The Indica (Kasalath) and Japonica (Nipponbare) cultivars of rice ( Oryza sativa ) were used as controls in the screening experiment. All 12 accessions of wild rice species, including O. brachyantha (with one accession per species) were obtained from the National Institute of Genetics in Japan. Since wild rice seeds exhibit stronger dormancy than cultivated rice, the former were first scratched at the pericarp near the embryo to break the dormancy. Then the dehulled wild rice and intact cultivar seeds were germinated on PCR plates (with the bottom cut off and floating on MilliQ water) for 3 d in the dark at 30°C. Hydroponic experiments were performed using the Kimura B nutrient solution containing 540 μM MgSO_4_·7H_2_O, 360 μM (NH_4_)2_SO_4, 360 μM Ca(NO_3_)2·4H_2_O, 180 μM KNO_3_, 180 μM KH_2_PO_4_, 40 μM EDTA‐FeNa, 20 μM H_3_BO_3_, 12 μM MnCl_2_·4H_2_O, 0.8 μM ZnSO_4_·7H_2_O, 0.4 μM CuSO_4_·5H_2_O, and 0.04 μM (NH_4_)6_Mo_7_O_24·4H_2_O, with pH adjusted to 5.6 before use. For the Pi‐deficient treatment, 180 μM KH_2_PO_4_ was replaced by 90 μM K_2_SO_4_. Plant seedlings were grown in a growth chamber with a 14‐h light (600 μmol m^−2^ s^−1^, 30°C)/10‐h dark (25°C) photoperiod, and the relative humidity was maintained at approximately 70%. The nutrient solution was refreshed every 3 days.
Measurement of Total P and Soluble pi Concentrations
2.2
To evaluate the P accumulation ability and the P use efficiency of the cultivated and wild rice plants, the shoots and roots of five‐week‐old seedlings were sampled separately. After drying at 70°C in an oven for 72 h, plant samples were weighed and digested with concentrated nitric acid (60% [w/v]) at temperatures up to 180°C for 15 min in a microwave oven. The total P concentration was determined by an ICP‐OES (Perkin Elmer Optima 4300DV) following a previously described procedure (Khattak et al. 2015). The total P contents in roots and shoots were calculated by normalization to the corresponding dry weights.
To assess the P use status of O. brachyantha after Pi starvation, the roots and leaves of treated seedlings were collected separately to determine the soluble Pi concentration following a previously published procedure (Delhaize and Randall 1995; Deng et al. 2014; Gu et al. 2017), with modifications. Briefly, the weighed fresh tissues were homogenized with a mortar and pestle in liquid nitrogen. The inorganic phosphate (Pi) was extracted with 4 mL of 5% (v/v) sulfuric acid (5 M) solution. After centrifugation at 14,000× g, 200 μL of the supernatant was transferred and mixed with an 800‐μL aliquot of 1.5% (w/v) fresh ascorbic acid (pH 5.0) dissolved in the reaction buffer (2.8 M sulfuric acid, 10 g L^−1^ ammonium molybdate and 0.5 g L^−1^ antimony potassium tartrate). The mixture was incubated at 37°C for 30 min, and the absorbance at 880 nm was recorded by a spectrophotometer (SpectraMax Plus Absorbance Microplate Reader). The Pi concentration was calculated from a standard curve generated with varying concentrations of KH_2_PO_4_ and normalized by the fresh weight.
Identification and Phylogenetic Analysis of
ObPT Genes
2.3
The full‐length genomic sequences, coding sequences (CDSs) and protein sequences of all PTs in Arabidopsis thaliana , Oryza sativa spp. japonica, and Oryza brachyantha were retrieved from the Ensembl Plants database (http://plants.ensembl.org) after BLASTP searches using 28 known AtPT and 37 OsPT proteins against the O. brachyantha genome (v1.4b) (Chen et al. 2013). Using the MEGA 11 software, 96 amino acid sequences were aligned in total, and phylogenetic analyses were conducted using the maximum‐likelihood method with 1000 bootstrap replicates (Tamura et al. 2021). The rough phylogenetic tree was annotated and polished using the online tool iTOL v5 (https://itol.embl.de/) (Letunic and Bork 2021). The putative ObPTs were named based on the corresponding OsPTs with the closest phylogenetic relationships.
Characterization of
ObPT Genes and Associated Proteins
2.4
The exon‐intron structures of the putative ObPT genes were obtained using the GSDS online software (http://gsds.cbi.pku.edu.cn) (Hu et al. 2015). The physicochemical properties of the corresponding PT proteins, such as the theoretical isoelectric point (pI) and the molecular weight (MW), were calculated using the ProtParam tool on the ExPASy server (https://web.expasy.org/protparam/) (Gasteiger et al. 2005). The transmembrane segments (TMS) and subcellular localization of the ObPTs were predicted by the TMHMM Server (https://services.healthtech.dtu.dk/service.php?TMHMM‐2.0) (Krogh et al. 2001) and the Plant‐mPLoc server (http://www.csbio.sjtu.edu.cn/bioinf/plant‐multi/) (Chou and Shen 2010), respectively. The conserved motifs of ObPTs were analyzed by MEME (https://meme‐suite.org/meme /tools/meme) (Bailey et al. 2015) with default parameters and graphed by TBtools (Chen et al. 2020).
Chromosome Mapping and Syntenic Analysis
2.5
The length and gene density of each chromosome and the physical location of ObPT genes were retrieved from the genome annotation file of O. brachyantha (Chen et al. 2013). Subsequently, gene duplication events and collinearity relationships of ObPT genes within O. brachyantha and between O. brachyantha and O. sativa were analyzed using the One Step MCScanX tool in TBtools with E‐value < 1 × 10^−10^ (Chen et al. 2020). Then the information was visualized using an integrated diagram, which was drawn using the Advanced Circos tool in TBtools.
Quantitative Real‐Time PCR Analysis
2.6
Total RNA was isolated using the RNeasy Plant Mini Kit (Qiagen) according to the manufacturer's instructions. DNA removal and reverse transcription reactions are performed using the OneTaq RT‐PCR Kit (BioLabs). Real‐time PCR assays were performed using the QuantiNova SYBR Green RT‐PCR Kit (Qiagen) on a StepOnePlus Real‐Time PCR system according to the manufacturer's instructions (Applied Biosystem). Three biological replicates and four technical replicates were performed for each gene. The housekeeping gene EF1⍺ (OB03G15790) from O. brachyantha was used as the internal control for all analyses. The primers for ObEF1⍺ and ObPT genes are listed in Table S1.
Statistical Analysis
2.7
Statistics were performed using Student's t‐test. Differences were defined as statistically significant if p < 0.05.
Results
3
Performance of Wild Rice on P Uptake and Utilization
3.1
Efficient P accumulation and utilization in crop plants are crucial parameters for agricultural production, especially under Pi‐deficient conditions (Cong et al. 2020). To assess P uptake and use efficiency among cultivated rice and its wild relatives, we conducted a phenotypic screening of 13 species spanning the AA to FF genome types within the genus Oryza, on their P accumulation in root and shoot tissues under Pi‐replete (+P) and Pi‐depleted (−P) treatments. Among the species screened, O. brachyantha (accession W0656) exhibited the highest total P concentration in roots (15.15 mg g^−1^ DW) and shoots (15.46 mg g^−1^ DW) under the +P condition, while the total P in other species ranged from 2.13 to 8.35 mg g^−1^ DW (Figure 1A). After Pi‐starvation for 1 week, the total P concentration of each species decreased sharply, by 32.7%–80.4% in roots and 52.8%–84.6% in shoots, while O. brachyantha still maintained the highest P content in all tissues despite a decrease of 74.7% and 58.1% in roots and shoots, respectively (Figure 1B). These results suggest that this wild rice species may possess a unique P usage strategy, enabling it to accumulate and store higher levels of P in cells to sustain growth during a prolonged fluctuation in Pi levels in the environment.
Total phosphorus (P) content of rice ( Oryza sativa ) and its wild relatives under inorganic phosphate (Pi)‐replete and Pi‐deficient conditions. Four‐week‐old seedlings of two cultivated subspecies of O. sativa (Kasalath and Nipponbare) and 12 wild species of rice (with one accession per species) were grown in a Pi‐replete (+P, 180 μM Pi) solution and then exposed to (A) +P (B) Pi‐deplete (−P, 0 μM Pi) environments for a week. Values represent means ± SD of six biological replicates, with each replicate being represented by a dot in the plot. DW, dry weight; Wxxxx, wild rice accessions.
Identification and Characterization of Phosphate Transporters in Oryza brachyantha
3.2
In plants, Pi absorption and homeostasis highly depend on transport processes directly regulated by various PTs localized in cellular and subcellular membranes (Wang et al. 2017). To understand the molecular basis for the high P accumulation by O. brachyantha, we conducted a genome‐wide identification and characterization of all putative PTs in this wild rice species.
As shown in Table S2, a total of 31 ObPT genes were identified by blasting the protein sequences of known Arabidopsis AtPTs and O. sativa OsPTs against the O. brachyantha genome (Chen et al. 2013). These genes are distributed among the five PT families, including 21 ObPHTs (encompassing nine ObPHT1s, one ObPHT2, five ObPHT3s and six ObPHT4s), three ObSPX‐EXSs, four ObSPX‐MFSs, two ObVPEs, and one ObSPDT. The corresponding proteins contain from 351 (ObPHT3;5) to 897 (ObPHO1;3) amino acids (aa), with molecular weights (MW) between 37 and 101.6 kDa (Table 1 and Table S3). Their predicted isoelectric point (pI) values range from 4.86 to 10.42, with ObPHT1s typically having a pI around 8.75. According to the prediction of transmembrane helices using the HMMTOP tool in the Transport Classification Database (https://tcdb.org/progs/TMS.php) (Tusnady and Simon 2001), the number of transmembrane segments (TMS) in ObPT proteins varies from 3 to 18, suggesting all ObPTs are membrane‐bound, a necessary feature for facilitating Pi ion transport (Table 1).
The phylogenetic tree of ObPT proteins illustrates the evolutionary relationships of these transporters in O. brachyantha, where ObPHT3s are closest to the ObPHO1 family but not to the other ObPHT subfamilies (Figure 2A). Gene structure analyses indicated that four ObPHT1s and ObPHT4;6 lacked introns, while the coding sequences of other ObPT genes contained anywhere between one and 15 introns (Figure 2B). In addition to the similar exon‐intron structures of the encoding genes, ObPTs also share conserved motifs within the same clade (Figure 2C). For instance, PHT1s only contain one or two exons and share a similar amino acid sequence containing motifs 1–8, 10, and 12. These findings provided insights into the structural and functional characteristics of PTs in O. brachyantha.
Phylogenetic and gene structure analyses of the phosphate transporter (PT) proteins in Oryza brachyantha. (A) An unrooted phylogenetic tree of ObPT proteins. The amino acid sequences of ObPTs were aligned and used for the construction of the phylogenetic tree. The proteins were sorted into eight clades, each highlighted in a distinct color. (B) The coding sequence (CDS)‐intron structures of the ObPT genes were determined by the alignments of CDSs with the corresponding genomic sequences. Orange bars indicate CDS fractions, while black lines represent introns, and turquoise bars indicate 5′ or 3′ untranslated regions (UTRs). (C) Forty‐four conserved motifs were identified using the MEME tool and identified by different colors. The x‐axes below indicate the lengths of gene fractions and protein motifs, respectively.
Phylogenetic and Synteny Analyses of
ObPT Genes
3.3
To investigate any possible evolutionary relationship among the 28 Arabidopsis AtPTs, 37 cultivated rice OsPTs, and 31 wild rice ObPTs, we constructed a phylogenetic tree based on their protein sequences using the maximum‐likelihood method in MEGA 11 (Tamura et al. 2021). All ObPTs could be paired with corresponding PT members from O. sativa (Figure 3), indicating a close phylogenetic relationship between the PTs in cultivated rice and those in its wild relative in general. Therefore, the ObPTs were named according to their OsPT orthologs. However, four OsPHT1s (including OsPHT1;1, OsPHT1;6, OsPHT1;8 and OsPHT1;11), OsPHT3;4, and OsPHT4;6–2 have no homolog in O. brachyantha, suggesting that these PTs (16.2% of all OsPTs) were lost from the O. brachyantha genome during natural adaptations to African habitats. In other words, about 19.4% of OsPTs were duplicated in cultivated rice during artificial selection and breeding. When clustering these five PT families together, PHT3s were observed to be more closely related to SPDTs than to other PHT subfamilies, and PHT4s were the closest to VPEs (Figure 3).
Phylogenetic analyses of phosphate transporters (PTs) in Arabidopsis thaliana (At), Oryza sativa (Os; cultivated rice) and Oryza brachyantha (Ob; a wild rice species). The phylogenetic tree was constructed via maximum‐likelihood method with 1000 bootstraps in the MEGA 11 program (Tamura et al. 2021) and annotated using iTOL v5 (Letunic and Bork 2021). Circles, squares, and stars next to the gene names represent the PT genes of A. thaliana , O. sativa , and O. brachyantha, respectively. The eight clades of PT genes are represented by the same eight colors as in Figure 2. All the gene names and locus IDs are provided in Table S2.
To further characterize the ObPT genes, we mapped them to the O. brachyantha chromosomes based on their genomic locations using TBtools (Chen et al. 2020). Except for chromosomes 7 and 12, each chromosome contains at least one ObPT gene (Figure 4A). There are six ObPT genes on chromosome 4, five each on chromosomes 6 and 9, four each on chromosomes 2 and 3, and three on chromosome 1. There are also five duplicated ObPT gene pairs, the connecting lines of which are shown in four different colors to indicate their memberships in the ObPHT1, ObPHT3, ObPHT4, and ObSPX‐MFS gene groups (Figure 4A). The ratios of the non‐synonymous substitution rate to the synonymous substitution rate (Ka/Ks) range from 0.09 to 0.39, implying that these genes have undergone purifying selections to eliminate deleterious mutations (Table S4). We also compared the protein sequence identity and similarity of the PTs between O. sativa and O. brachyantha (Figure 4B and Table S5). The dot plot showed that each ObPT most closely resembles its OsPT ortholog in protein sequence, and the highest sequence identity values for each PT are concentrated within the comparison matrix of the same clade, confirming the above phylogenetic results.
The evolutionary relationships among phosphate transporters (PTs) within the O. brachyantha genome and between O. brachyantha and O. sativa . (A) Chromosomal locations and inter‐chromosomal relationships among PT genes within the O. brachyantha genome. The gray annulus was drawn in proportion to the lengths of the 12 chromosomes of O. brachyantha, and all ObPTs were plotted according to their physical distributions in the corresponding chromosomes. Scale bars represent the number of DNA bases in Mb and blue columns on the annulus indicate the gene density of each chromosome in frequency per 0.2 Mb. The chromosome numbers are labeled on the inside of each chromosome. Gray lines crisscrossing between different chromosomes indicate all syntenic blocks in the O. brachyantha genome, and the lines connecting syntenic/duplicated PT gene pairs are drawn using the same color scheme as in Figures 2 and 3, indicating the ObPHT1 (red), ObPHT3 (maroon), ObPHT4 (yellow) and ObSPX‐MFS (dark green) clades, respectively. Other PT genes are also labeled using the same color scheme used in Figure 2 to indicate their membership in the eight identified clades. (B) Sequence identity and similarity among all PT proteins between O. sativa (Os) and O. brachyantha (Ob). The percentage of amino acid sequence identity and similarity are indicated by circle color and size, respectively. (C) Collinearity analyses of PT genes between O. sativa (Os) and O. brachyantha (Ob). The gray lines represent all aligned blocks between the two species, and the syntenic gene pairs within each clade are indicated with the same colors corresponding to the scheme used in Figure 2.
Furthermore, we constructed a synteny map of PT families from the O. brachyantha and the O. sativa genomes to further understand the evolutionary mechanism of the PT families in wild rice (Figure 4C). The FF‐genome type species, O. brachyantha, is genetically distant from cultivated rice (which has the AA genome type), and only 70% of the protein‐coding genes of O. brachyantha are located in collinear positions to the O. sativa genome (Chen et al. 2013). Despite this genetic divergence, 28 out of 31 pairs of homologous PT genes between O. brachyantha and its cultivated relative were identified as direct syntenic pairs, indicating the remarkable conservation of PTs within the genus Oryza, with the conservation level exceeding the average genome‐wide collinear rate.
To explore the selection pressure on PT genes after gene duplication, we calculated and analyzed the Ka/Ks ratio of the orthologous PT genes between O. sativa and O. brachyantha (Table S6). Twenty‐eight pairs of orthologous PT genes between these two species were obtained by bidirectional Blastp. Their Ka/Ks values ranged from 0.0417 to 0.423, with an average of 0.1785. These values were much lower than 1, suggesting intense purifying selection pressure was experienced during the evolution of PT genes within the genus Oryza.
Expression Patterns of
ObPT Genes Under pi Starvation
3.4
Given that O. brachyantha has a remarkably higher total P content than other Oryza species tested in this study, we wanted to investigate in finer detail the responses of the ObPTs to progressive Pi depletion in the root and shoot. Four‐week‐old O. brachyantha plants were exposed to Pi starvation for 0, 3, 6, and 12 days, after which the root and leaf tissues were analyzed separately to determine their respective cellular Pi concentrations as well as the temporal and spatial expression patterns of all ObPT genes through qRT‐PCR.
Our results showed that Pi concentrations in O. brachyantha tissues dropped sharply throughout the 12‐day duration of Pi deficiency treatment (Figure 5A). Cellular Pi values in roots and leaves were reduced by 89.2% and 80.7%, respectively, from the average levels of 1.36 and 2.51 mg g^−1^ FW, respectively, at the beginning of the treatment. Together with the total P results, this shows that O. brachyantha may be able to re‐utilize its high P storage to maintain growth for a relatively long period in a Pi‐fluctuating environment.
Dynamic changes in the tissue‐specific expression levels of phosphate transporter (PT) genes in O. brachyantha during phosphate deprivation. (A) Concentrations of soluble inorganic phosphate (Pi) in roots and leaves under 0, 3, 6, and 12 d of Pi‐deficient conditions. FW, fresh weight. Different letters within the same tissue indicate significant differences (p < 0.05) according to Student's t‐test. (B–I) Relative expression analyses of ObPHT1s (B), ObPHT2 (C), ObPHT3s (D), ObPHT4s (E), ObPHO1s (F), ObSPX‐MFSs (G), ObVPEs (H) and ObSPDT (I) after different Pi‐starvation times. All data shown are means ± SD, each with three biological replicates.
Our qRT‐PCR results (Figure 5B–I) revealed the diverse expression patterns of 31 ObPT genes in response to Pi starvation in different tissues. Among them, four genes (ObPHT1;7, ObPHT1;10, ObPHT1;13 and ObSPX‐MFS4) were not detected, and three genes (ObPHT1;9, ObPHT1;12 and ObPHO1;1) were barely expressed in any tissue, suggesting that they may have limited roles in P homeostasis. On the other hand, we identified four genes that displayed tissue‐specific expression patterns, indicating their potential involvement in Pi acquisition, transport, or storage. For example, ObPHT1;5, ObPHT4;6, and ObPHO1;3 were minimally expressed in roots but highly induced in leaves under Pi starvation, while ObSPX‐MFS2 was barely expressed in leaves and repressed in roots after prolonged Pi starvation.
Moreover, we observed that some genes (ObPHT1;3, ObPHO1;2, ObSPX‐MFS1, ObVPE1 and ObSPDT) were induced by Pi starvation in both types of tissues, suggesting that they may play a universal role in Pi sensing, signaling, or mobilization. Interestingly, most of the remaining ObPT genes were downregulated in roots by Pi starvation but upregulated in leaves, suggesting their differential regulations and functions are tissue‐specific. Notably, among these genes, the homologs of ObSPX‐MFS3 and ObVPE2 in cultivated rice are responsible for Pi import to and export from the vacuole (Guo et al. 2022; Xu et al. 2019), implying a role in Pi storage and recycling in subcellular compartments. These results provide valuable insights into the distinct roles of different PT genes in P homeostasis within different tissues of O. brachyantha.
Discussion
4
P is an essential macronutrient for plant growth and development, but its availability in the soil is often limited. Fortunately, plants have evolved diverse strategies to cope with P deficiency, such as enhancing P acquisition from the rhizosphere, optimizing P utilization within the plant, and re‐mobilizing P from old to young tissues. Those underlying mechanisms have been extensively investigated in cultivated rice. However, the genetic diversity of domesticated rice is limited compared to its wild relatives in the same genus, and the genetic basis of wild rice adaptations to suboptimal P levels in the soil remains largely unknown. Therefore, we tested a set of wild rice accessions for P absorption efficiency using a hydroponic system. Among the two cultivated subspecies and 12 wild species of rice, O. brachyantha exhibited the highest P accumulation under both −P and +P conditions (Figure 1). This trait might confer O. brachyantha an adaptive advantage in its natural habitat in the African savanna and suggests a unique efficiency in P use in this wild species with a compact FF‐type genome. As a distant wild relative of cultivated rice in the same genus, O. brachyantha represents a valuable resource to explore novel genes for coping with Pi‐limited environments.
Through whole‐genome search using the protein sequences of known Arabidopsis and O. sativa PTs, we discovered a total of 31 PT genes in the O. brachyantha genome, including members of the PHT, SPX‐EXS, SPX‐MFS, VPE, and SPDT families. In the phylogenetic tree, all ObPTs were paired with the PTs from cultivated rice, indicating a shared evolutionary history within the genus Oryza (Figure 3). Comparisons between the protein sequences of PTs from O. sativa and O. brachyantha further supported the phylogenetic findings, with each ObPT displaying the highest sequence identity and similarity with its ortholog in domestic rice (Figure 4B). Furthermore, all the Ka/Ks values of homologous PT genes are less than 1, implying that intense purifying selection pressure played a role in maintaining the functionality of these PTs during evolution (Table S6).
However, four OsPHT1s, OsPHT3;4 and OsPHT4;6–2 have no homologs in O. brachyantha, suggesting a divergence in the PT gene content driven by environmental selection. This indicates that around 19.4% of PTs or 28.6% of PHTs underwent duplication in cultivated rice during artificial selection, which is consistent with the massive amplification of gene families observed in the domesticated rice genome (Gu et al. 2016; Wang et al. 2017, 2020). However, compared to the level of synteny between O. sativa and O. brachyantha at the genomic level, a higher proportion of ObPT genes have synteny relationships with their orthologs in cultivated rice (Figure 4C), suggesting PT proteins are important for survival and therefore are highly conserved during the evolution of the genus Oryza.
The expression levels of ObPHTs were higher than those of other ObPT families (Figure 5), indicating their importance for Pi homeostasis. However, it is intriguing to observe that PHT3s are genetically closer to other PT families than to other PHT subfamilies (Figure 2A and Figure 3). This distinct clustering pattern suggests a potentially close functional relationship between PHT3s and other PT, underscoring the need to examine all PT families together in the comprehensive genome‐wide identification and characterization analysis for other species.
Despite the phylogenetically close relationships between OsPTs and ObPTs, there are notable differences in the dynamics and tissue specificities in their expression patterns in response to Pi fluctuations. In cultivated rice, 10 PHT1s have been studied in detail, most of which are involved in Pi uptake and/or translocation. Among the reported PHT1s from cultivated rice, OsPHT1;1, OsPHT1;4, and OsPHT1;8 are abundantly expressed in different rice tissues and are involved in Pi uptake and allocation independent of Pi supply (Jia et al. 2011; Sun et al. 2012; Zhang et al. 2015). However, out of these four genes, only OsPHT1;4 has a homolog in O. brachyantha (ObPHT1;4), which was highly expressed in both roots and shoots, with its root expression decreasing under prolonged Pi‐deficient conditions (Figure 5B). Furthermore, whereas OsPHT1;2 demonstrates low root expression but high shoot expression (Ai et al. 2009; Liu et al. 2010), ObPHT1;2 was minimally expressed in both tissues (Figure 5B). Notably, OsPHT1;3, OsPHT1;6, OsPHT1;9, and OsPHT1;10 maintained low transcript levels in Pi‐sufficient environments but were markedly upregulated in response to Pi deprivation in all root tissues (Ai et al. 2009; Chang et al. 2019; Wang et al. 2014). However, in O. brachyantha, this expression pattern was predominantly mirrored by ObPHT1;3 only, with ObPHT1;9 displaying subdued expressions and ObPHT1;10 remaining undetectable in both tissues (Figure 5B). Additionally, OsPHT1;11/13 represent two symbiosis‐specific members essential for the establishment of symbiotic interactions between arbuscular mycorrhizal fungi and plant roots (Paszkowski et al. 2002; Yang et al. 2012), whereas only a single symbiosis‐specific homolog, ObPHT1;13, is present in O. brachyantha but remains unexpressed in roots. These findings imply a possible divergence in the functions of the orthologous PT pairs between O. sativa and O. brachyantha, despite their close genetic distances.
The expression dynamics of other ObPT genes under Pi starvation also revealed tissue‐specific and context‐dependent regulations. For example, ObPHO1;2 (Figure 5F), ObSPX‐MFS1 (Figure 5G), ObVPE1 (Figure 5H), and ObSPDT (Figure 5I) showed induction across both tissue types in response to Pi scarcity, implying their putative roles in Pi sensing, signaling, or mobilization. Interestingly, a majority of the remaining ObPTs were downregulated in roots but upregulated in leaves under Pi starvation, indicating their diverse functions in Pi homeostasis within different tissues. Taken together, these dynamic expression patterns support the scenario of the efficient re‐utilization of high P storage in roots and leaves for an extended period, potentially explaining its superior Pi utilization strategy. Further investigation of the functional roles of specific ObPTs and their potential applications in crop improvement will contribute to the development of more efficient and sustainable agricultural practices.
Conclusion
5
The distinct Pi uptake efficiency observed in O. brachyantha coupled with the conservation and diversification of PT genes highlights the intrinsic potential of this wild rice species as a valuable genetic resource for improving P utilization in crops. Moreover, expression profile analyses showed that different ObPTs displayed differential expression patterns under P scarcity, suggesting that they may have different roles or regulatory mechanisms in Pi homeostasis. This study provides a foundation for future breeding and engineering strategies to enhance Pi acquisition and P use efficiency in cultivated rice and other crops.
Author Contributions
Hon‐Ming Lam: conceptualization (lead), funding acquisition (lead), project administration (lead), supervision (lead), writing – review and editing (lead). Xusheng Zhao: data curation (lead), investigation (lead), methodology (lead), software (lead), visualization (lead), writing – original draft (lead). Wai‐Shing Yung: funding acquisition (supporting), project administration (supporting), supervision (supporting), writing – review and editing (supporting). Kejing Fan: conceptualization (supporting), supervision (supporting), writing – review and editing (supporting). Shengjie Chen: data curation (supporting), investigation (supporting), writing – original draft (supporting).
Conflicts of Interest
The authors declare no conflicts of interest.
Supporting information
Table S1. Information on the ObPT primers used in qRT‐PCR assays. Table S2. Gene names and locus IDs of all phosphate transporter genes used in phylogenetic analysis. Table S3. Detailed properties of phosphate transporters identified from the Oryza brachyantha genome. Table S4. Comparisons of the substitution rates among homologous phosphate transporter (PT) genes within the O. brachyantha genome. Table S5. Amino acid sequence identity and similarity between all the phosphate transporter (PT) proteins of O. sativa and those of O. brachyantha. Table S6. Comparisons of the substitution rates of homologous phosphate transporter (PT) genes between the O. brachyantha and O. sativa genomes.
The reference list from the paper itself. Each links out to its DOI / PubMed record.
- 1Ahmad, I. , A. Rawoof , K. Islam , J. Momo , and N. Ramchiary . 2021. “Identification and Expression Analysis of Phosphate Transporter Genes and Metabolites in Response to Phosphate Stress in Capsicum annuum .” Environmental and Experimental Botany 190: 104597. 10.1016/j.envexpbot.2021.104597. · doi ↗
- 2Ai, P. , S. Sun , J. Zhao , et al. 2009. “Two Rice Phosphate Transporters, Os Pht 1;2 and Os Pht 1;6, Have Different Functions and Kinetic Properties in Uptake and Translocation.” Plant Journal 57: 798–809. 10.1111/j.1365-313X.2008.03726.x.18980647 · doi ↗ · pubmed ↗
- 3Bailey, T. L. , J. Johnson , C. E. Grant , and W. S. Noble . 2015. “The MEME Suite.” Nucleic Acids Research 43: W 39–W 49. 10.1093/nar/gkv 416.25953851 PMC 4489269 · doi ↗ · pubmed ↗
- 4Chang, M. X. , M. Gu , Y. W. Xia , et al. 2019. “Os PHT 1;3 Mediates Uptake, Translocation, and Remobilization of Phosphate Under Extremely Low Phosphate Regimes.” Plant Physiology 179: 656–670. 10.1104/pp.18.01097.30567970 PMC 6426419 · doi ↗ · pubmed ↗
- 5Chen, C. , H. Chen , Y. Zhang , et al. 2020. “T Btools: An Integrative Toolkit Developed for Interactive Analyses of Big Biological Data.” Molecular Plant 13: 1194–1202. 10.1016/j.molp.2020.06.009.32585190 · doi ↗ · pubmed ↗
- 6Chen, J. , Q. Huang , D. Gao , et al. 2013. “Whole‐Genome Sequencing of Oryza Brachyantha Reveals Mechanisms Underlying Oryza Genome Evolution.” Nature Communications 4: 1595. 10.1038/ncomms 2596.PMC 361548023481403 · doi ↗ · pubmed ↗
- 7Chou, K. C. , and H. B. Shen . 2010. “Plant‐m P Loc: A Top‐Down Strategy to Augment the Power for Predicting Plant Protein Subcellular Localization.” P Lo S One 5: e 11335. 10.1371/journal.pone.0011335.20596258 PMC 2893129 · doi ↗ · pubmed ↗
- 8Cong, W. F. , L. D. B. Suriyagoda , and H. Lambers . 2020. “Tightening the Phosphorus Cycle Through Phosphorus‐Efficient Crop Genotypes.” Trends in Plant Science 25: 967–975. 10.1016/j.tplants.2020.04.013.32414603 · doi ↗ · pubmed ↗