Degree of Compliance of Hospital Emergency Departments With the Recommended Standards and Their Evolution During the SARS-CoV-2 Pandemic
Cristina Font-Cabrera, Jordi Adamuz, Maria Eulàlia Juvé-Udina, Miquel Sánchez, Almudena Mateos-Dávila, José Antonio Sarria-Guerrero, Andrea Pastor-Puigdomènech, Eva Maria Guix-Comellas

TL;DR
This study analyzed how well Spanish hospital emergency departments followed care time standards and how these changed during the SARS-CoV-2 pandemic.
Contribution
The study provides new insights into ED compliance with care time standards and their evolution during the pandemic in Spain.
Findings
ED lengths of stay varied significantly by triage level, with the longest times for Levels 1 and 2.
In 2021, all hospitals showed statistically significant increases in dwell times for triage Levels 2–5.
Longer waiting times at triage Levels 3, 4, and 5 were associated with higher mortality risk.
Abstract
Aim: To analyse the degree of compliance of the care times of hospital emergency departments (EDs) in Spain with the recommended standards and their evolution during the SARS-CoV-2 pandemic. Design and Methods: An observational, correlational, cross-sectional and retrospective study was carried out. All adult patients attended in the EDs of 8 Spanish public hospitals from 2018 to 2021 were consecutively included. The main variables were time spent in the ED, time to triage, waiting time until the start of care, triage level, classified according to the Spanish Triage System and year of care. Other sociodemographic variables were collected, in addition to discharge destination. For each triage level, a negative binomial regression model was performed, adjusted for year, hospital and waiting times. The analysis was performed with R 4.2.2 software. Results: A total of 2,282,555 patients…
Genes, proteins, chemicals, diseases, species, mutations and cell lines named across the full text — each resolved to its canonical identifier and authoritative record.
Click any figure to enlarge with its caption.
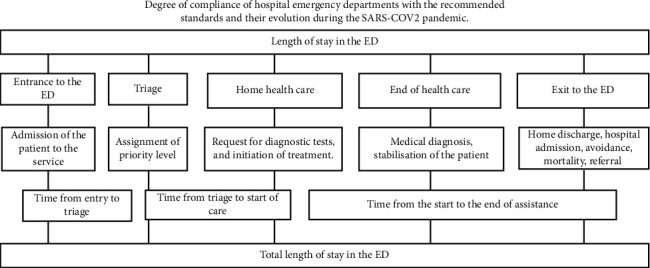 Figure 1
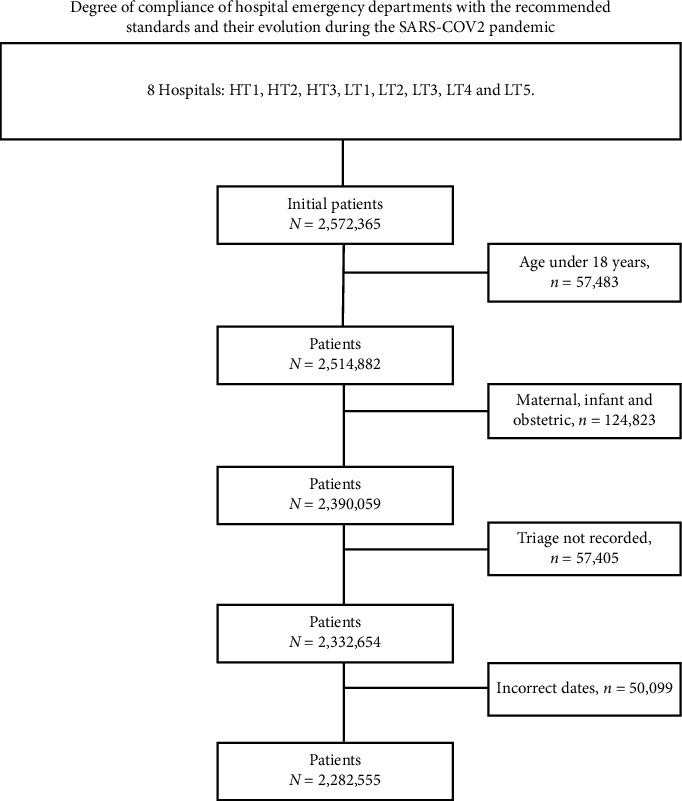 Figure 2
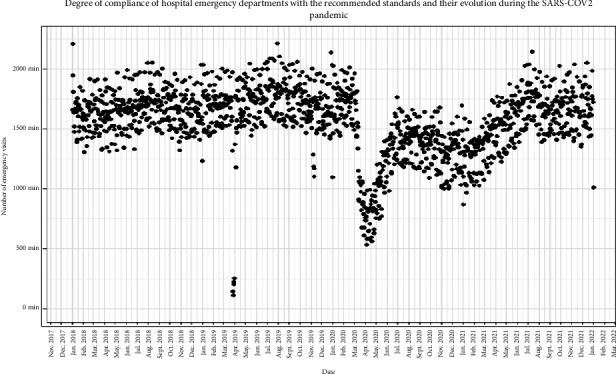 Figure 3
- —Official College of Nursing of Barcelona
- —Department of Research and University of the Government of Catalonia
Peer Reviews
No public reviews on file for this paper yet. If you reviewed it on a platform where reviews are public (OpenReview, ICLR, NeurIPS, ICML), you can paste yours below so the community can read it here.
Videos
No videos yet. Explain this paper in a talk, walkthrough, or lecture? Add one.
Taxonomy
TopicsEmergency and Acute Care Studies · Trauma and Emergency Care Studies · COVID-19 and healthcare impacts
1. Introduction
Hospital emergency departments (EDs) are one of the main gateways to the healthcare system and play a critical role, as they are often unable to guarantee an efficient and quality response to citizens. It is of concern that the majority of ED visits are considered nonurgent or inappropriate, classified as low complexity in different countries around the world [1, 2].
During the 1960s, with a marked increase in the number of patients in the ED, the need arose to distinguish between critically ill and less critically ill patients [3]. This situation prompted the global implementation of ED triage. Triage consists of a classification system that prioritises patients according to the severity of their illnesses or injuries, thus allowing more effective healthcare intervention in the shortest possible time [4, 5]. There are several validated scales for the classification of patients in the ED, such as the National Triage Scale for Australasian Emergency; the Canadian Emergency Department Triage Acuity Scale; the Manchester Triage System; the Severity Index and the Andorran Triage Model (MAT), which was adapted to the Spanish context as the Spanish Triage System (SET). This adaptation was developed by the Spanish Society of Emergency Medicine (Sociedad Española de Medicina de Urgencias y Emergencias) [6–8].
Triage is considered essential in ED management and is used as an indicator in the evaluation and validation of services [9]. Its main objective is to prioritise patients according to severity, and its precision and application in the first minutes of admission to the ED are crucial to avoid possible negative consequences for the patient's health [5]. In addition, waiting times are considered indicators of quality of care, and are defined as the time between arrival at the ED and care by the healthcare professional [10]. Long waiting periods and prolonged stay of patients in the ED are associated with increased morbidity and mortality, as they delay the start of appropriate treatment. This reduces the quality of care, leading to patient dissatisfaction and stress [11–13].
Therefore, the aim of the present study was to analyse the degree of compliance of Spanish hospital EDs with the recommended standards and their evolution during the SARS-CoV-2 pandemic.
2. Design and Methods
An observational, correlational, cross-sectional and retrospective study was conducted in the 8 public hospitals in Spain attached to the Catalan Health Institute (ICS). The ICS stands out as the country's leading public health institution, providing health services to almost six million people. At the hospital level, it manages 8 key hospitals within the public network. Its financing comes from the public funds of the National Health System, obtained through public taxes. Its care structure is organised into three large hospitals with advanced technology and five regional hospitals. This configuration makes it possible to effectively address healthcare needs, from the most complex to the simplest cases, providing comprehensive medical coverage for the population.
We consecutively included all users who attended the ED for a health problem from 2018 to 2021 (both included), attending a total of 2,572,365 visits. Patients under 18 years of age and women with obstetric pathology were excluded.
Health problems were grouped according to the MAT/SET programme into five categories of being: priority 1: resuscitation, priority 2: emergency, priority 3: urgency, priority 4: less urgent and priority 5: nonurgent [14]. For secondary variables, the eight ICS hospitals were considered, the first three being considered high complexity due to their accreditation to carry out more complex care procedures. The remaining hospitals are considered low complexity. The high complexity hospitals were identified as HT1, HT2 and HT3, while the low complexity hospitals were LT1, LT2, LT3, LT4 and LT5. In Spain, hospitals are classified into HT and LT hospitals according to their health resources, equipment and available services. HT hospitals offer basic services but are mainly characterised by providing specialised and complex treatments to patients. On the other hand, LT hospitals offer more basic health care. The different years 2018, 2019, 2020 and 2021 were taken into account. Several variables related to ED waiting times were analysed. The length of stay was considered from patient admission to the ED, including the admission process, triage, healthcare until discharge or hospital admission. In addition, other waiting times were evaluated, such as triage time, which was measured from the patient's arrival at the ED until the nursing staff carried out the initial assessment (triage). During this process, the nurse determined the patient's priority level according to the severity of the patient's situation. The start and end of care time was also analysed. The start of care was defined as the time from triage to the start of care. This changes according to the priority level assigned. Priority 1 requires immediate attention from healthcare staff; Priority 2 must be seen in less than 15 min; Priority 3 must not exceed 60 min waiting time; Priority 4 has a maximum waiting time of 120 min and Priority 5 can wait up to 240 min for care [2]. Finally, end of care is considered the time at which the patient is discharged, admitted, referred, evaded or exitus (Figure 1). Data were extracted retrospectively from the ED Minimum Basic Data Set (MBDS) registry.
In structured triage, operational objectives have been established to measure and guarantee the efficiency and quality of the process. In Spain, the Spanish Society of Emergency Medicine (SEMES) highlights triage as a primary indicator of quality of care. It establishes key performance indicators that are not standards but ideal goals: (a) ensure that ≤ 2% of patients leave without receiving medical attention after registration; (b) initiate triage within ≤ 10 min of arrival at the ED and (c) ensure that at least 90% receive care within 2 h of triage, reaching 100% within 4 h [15].
Categorical variables were described by the number of cases, the percentage of the total by category and the number of missing data. Continuous variables following a normal distribution were described by the number of cases, the mean, the standard deviation and the number of missing data. Continuous variables that did not follow a normal distribution were described by the number of cases, the median, the first and third quartiles and the number of missing data. Median times for each triage level across years and by hospital were plotted. Quantile regression models were performed for the 90th percentile, adjusting by year and hospital. Percentile estimators were presented together with the corresponding 95% confidence interval. The analysis was performed with R 4.2.2 software.
The study was carried out in accordance with the regulations and laws in force in our country, through the Organic Law on Data Protection and Guarantee of Digital Rights. In order to guarantee patient confidentiality, an anonymisation system managed by the technical secretariat of the ICS corporate centre was set up, removing all data that could be used to identify them. The research had the support of the Research Ethics Committee of the Bellvitge University Hospital under the code (PR085/20).
3. Results
A total of 2,572,365 patients were seen. Of these, 2,282,555 patients met the study inclusion criteria (Figure 2). A total of 51.4% (n = 1,173,233) were women, and the mean age was 55.4 years (SD = 20.7). By year, there were 603,897 visits in 2018, 618,766 in 2019, 48,728 in 2020, where it was observed that the SARS-CoV-2 pandemic caused the number of ED visits to decrease markedly and 572,608 in 2021, where there was a recovery of the pattern of ED patient visits to levels similar to the prepandemic period (Figure 3). Length of stay in the ED was notably prolonged at all triage levels. At priority level 1, 90% of the patients had a maximum length of stay of 21.6 h (mean = 5.1 h) in the ED. Similar results were obtained for priority levels 2 and 3 ([P90] = 26.3 h and 22.2 h and mean = 8.1 h and 5.9 h, respectively), while the ED stay times of patients with priority levels 4 and 5 were lower ([P90] = 8.1 h and 10.3 h and mean = 2.2 h in both) (Table 1). Length of stay in the ED was notoriously long at all triage levels. At priority level 1, 90% of the patients had a maximum length of stay of 21.6 h (mean = 5.1 h) in the ED. Similar results were obtained for priority levels 2 and 3 (90th percentile [P90] = 26.3 h and 22.2 h and mean = 8.1 h and 5.9 h, respectively), while the ED stay times of patients with priority levels 4 and 5 were lower (P90 = 8.1 h and 10.3 h and mean = 2.2 h in both) (Table 1).
3.1. Waiting Times to Triage and to Initiation of Care
Waiting time to triage was longer than 10 min at the 90th percentile at all priority levels although a clear trend was maintained: the higher the triage level, the shorter the waiting time (Level 1: P90 = 11 min and mean = 4 min; Level 2: P90 = 17 min and mean = 6 min; Level 3: P90 = 21 min and mean = 8 min; Level 4: P90 = 24 min and mean = 9 min and Level 5: P90 = 24 min and mean = 8 min).
Waiting time for initiation of care varied according to the priority level assigned to each patient (Level 1: P90 = 2 h and mean = 10 min; Levels 2 and 3: P90 = 3 h and mean = 21 and 35 min, respectively; and Levels 4 and 5: P90 = 2.5 h and mean = 35 and 30 min, respectively) (Table 1).
3.2. Length of Stay, Reasons for Discharge and Mortality
In high-complexity hospitals, longer lengths of stay were observed than that in low-complexity hospitals, at all priority levels (Table 2). Prolonged length of stay was associated with hospital admission, referral to other centres and a higher risk of mortality (Table 3).
Mortality and referrals were highest at the highest priority levels (1 and 2). It was observed that 60% of the patients categorised as Level 1 were admitted to hospital. Of these, 22% were discharged, 8.6% died and 8.5% were referred to other centres. As the severity level decreased, the frequency of discharge to home increased and the frequency of hospitalisation decreased. At triage Level 5, 81% of the patients were discharged, 7.8% were admitted to the ward, 0.07% died and 3.2% were referred to other facilities. In addition, a greater increase in patients leaving the ED was observed in the lower triage levels (4.36% for Level 4 and 6.61% for Level 5). In some of the higher severity levels, higher than recommended dropout rates were also detected (2.35% for Level 1; 1.74% for Level 2 and 2.96% for Level 3) (Table 3).
The reasons for staying in the ED differed according to the triage level. At Level 1, patients experienced long waits for critical care beds or for referral to other centres. In Levels 2, 3, 4 and 5, it was mainly due to hospital admission.
Analysing dwell time according to the different triage levels, significant differences were observed at all levels in 2021 compared with 2018. The time increased to 288 min at Level 1 (p < 0.001), 76 min at Level 2 (p < 0.001), 106 min at Level 3 (p < 0.001), 82 min at Level 4 (p < 0.001) and 163 min at Level 5 (p < 0.001). On the other hand, during 2020, coinciding with the pandemic, the increase to dwell time was only observed in the less urgent levels: Level 4 increased to 114 min (p < 0.001) and Level 5 to 134 min (p < 0.001).
In addition, significant differences in dwell time were detected between HT and LT hospitals, being longer in HTs. In triage 1, only one HT hospital showed a significant increase (p < 0.001). In triage 2 and 3, the largest increases in time were in HT centres (p < 0.001). In triage 4, increases were limited to only two HT hospitals (p < 0.001), while in triage 5, this time increased in two HT centres (p < 0.001) but decreased in the other hospitals (Table 4).
4. Discussion
The main factors influencing the length of stay in the ED in Catalonia are hospital admission and referral to other centres. In addition, length of stay is related to a higher risk of mortality. It is observed that the length of stay increases in highly complex hospitals and this is higher as the years go by. Although the number of ED visits decreased during the pandemic, the length of stay remained high due to the complexity of care for patients with COVID-19.
These data are consistent with previous studies such as that by Verma et al. [16], which found that prolonged ED stays were associated with increased in-hospital mortality, especially in elderly patients and those who spent more than 24 h in the ED. ED crowding and prolonged waiting times are a challenge in all countries around the world [17]. This overcapacity has negative consequences for patients, causing increased morbidity and mortality due to delays in care, affecting both MAT/SET categorised patients with high acuity levels and those with lower acuity levels [18, 19]. Patients categorised with higher levels of severity require rapid attention and intervention by the professional, while among patients with less urgency, waiting times are delayed, which can lead in some cases to them leaving the services without being visited as in the present study, where the average percentage of ED abandonment is 3.6%, much higher than the recommended 2% [20].
As ED length of stay increases, outcomes worsen, not only in the form of adverse patient outcomes but also with increased healthcare costs [19]. More critically ill patients tend to stay longer in the ED compared with those of lesser severity. This delay could be attributed to the fact that more critical patients often require hospital admission to critical, semicritical or ward beds, which are not always available [21, 22]. This low bed availability forces these patients to stay longer than necessary in the ED, contributing to the collapse of services [2]. It has been shown in the present study that, as the years go by, the length of stay is increasing. This increase may be attributed to various factors such as population ageing or the complexity of care [23].
Lengths of stay in the ED vary according to scientific evidence, ranging from 4 to 48 h [24–26]. There is no clear definition for all waiting times. Some authors define waiting time as the time from when the patient enters the ED door and ends when the patient is discharged or admitted to the hospital [18]. In contrast, others limit it to the time between arrival and first contact with a healthcare professional, be it a physician, advanced practice nurse or resident physician [21]. This definition is referred to as “door to triage”, which is the length of time one waits to be seen by the healthcare professional and is used to report on waiting times for patients in the ED [18]. According to the UK Department of Health, the total time from patient arrival in the ED to discharge should not exceed 4 h, known as the 4-h rule [27]. Excessive waiting times in the ED decrease patient safety and satisfaction, as well as increase mortality and the risk of admission to critical care units or other adverse reactions [28, 29].
One of the objectives of triage is that all patients are seen in less than 10 minutes (16); however, in routine clinical practice, as observed in our study, this time is often exceeded. In the study by Houston et al. [30], they found that patients waited longer than 10 min, while in the study by Hansen et al. [31], this time was 12 min or more. Kienbacher et al. [32] obtained a mean of 6 min, very similar to ours. It is crucial to highlight that in the most critically ill patients, any delay in the triage process can seriously impact their health [33]. Delays of up to 30 min in triage have been reported to negatively affect urgent interventions such as percutaneous coronary intervention [31].
One indicator of quality in EDs is the waiting time for care. It is stated that at least 90% of the patients should be seen within 2 h of triage [15]. In our study, this time was only met at priority Level 1. Patients who wait more than 2 h to be seen are more likely to leave the ED [31].
Our study has certain limitations. First, there may be a loss of information due to its retrospective design. There may have been reporting biases that may have influenced the interpretation of the study results although this may be corrected by the large volume of patients included. And finally, causal relationships between the different variables cannot be established as it is a descriptive study.
5. Conclusion
In Spain, EDs failed to attend patients within the recommended times, resulting in a low level of compliance with standards of care. The length of stay of patients in the ED was high as were the waiting times for triage and initiation of care, exceeding the optimal values. The patient abandonment rate in the ED was almost double the recommended rate. These times were even higher in HT hospitals. Such high patient lengths of stay in the ED were associated with higher mortality rates. The SARS-CoV-2 pandemic modified the pattern of visits, reducing the influx of patients but without reducing ED length of stay.
The reference list from the paper itself. Each links out to its DOI / PubMed record.
- 1Aghabarary M. Pourghaedi Z. Bijani M. Research N. Investigatingthe Professional Capability of Triagenurses in Theemergencydepartmentandits Determinants: a Multicentercross-Sectionalstudy in Iran BMC Emergency Medicine 2023231 p. 3810.1186/s 12873-023-00809-737005559 PMC 10068142 · doi ↗ · pubmed ↗
- 2Font-Cabrera C. Juvé-Udina M. E. Galimany-Masclans J. Implementation of Advanced Triage in the Emergency Department of High Complexity Public Hospital: Research Protocol Nursing Open 20231064101411010.1002/nop 2.162236719704 PMC 10170939 · doi ↗ · pubmed ↗
- 3Carlson K. Crowding in the Emergency Department Journal of Emergency Nursing 2016422979810.1016/j.jen.2016.02.0112-s 2.0-8496096502427002193 · doi ↗ · pubmed ↗
- 4Bijani M. Rakhshan M. Fararouei M. Torabizadeh C. Developmentandpsychometricassessment of Thetriagenurses’ Professional Capabilityquestionnaire in Theemergencydepartment BMC Nursing 2020191 p. 8210.1186/s 12912-020-00476-0PMC 746538932884445 · doi ↗ · pubmed ↗
- 5Bijani M. Khaleghi A. A. Challenges and Barriers Affectingthe Quality of Triage in Emergency Departments: A Qualitative Study Galen Medical Journal 20198 p. e 161910.31661/gmj.v 8i 0.1619 PMC 834413434466538 · doi ↗ · pubmed ↗
- 6Font-Cabrera C. Juvé-Udina M. E. Adamuz J. Diaz Membrives M. Fabrellas N. Guix-Comellas E. M. Activity, Triagelevelsandimpact of Thepandemic on Hospital Emergencydepartments: A Multicentrecross-Sectionalstudy Journal of Advanced Nursing 202410.1111/jan.16332 · doi ↗
- 7Hinson J. S. Martinez D. A. Schmitz P. S. K. Accuracy of emergencydepartmenttriageusingthe Emergency Severity Indexand Independent Predictors of Under-Triageand Over-triage in Brazil: a Retrospective Cohort Analysis International Journal of Emergency Medicine 2018111 p. 310.1186/s 12245-017-0161-82-s 2.0-85044376236 PMC 576857829335793 · doi ↗ · pubmed ↗
- 8Innes K. Jackson D. Plummer V. Elliott D. Emergencydepartmentwaitingroomnurserole: A Key Informant Perspective Australasian Emergency Nursing Journal 201720161110.1016/j.aenj.2016.12.0022-s 2.0-8500975655028108139 · doi ↗ · pubmed ↗