ToF-SIMS spectral data analysis of Paenibacillus sp. 300A biofilms and planktonic cells
Gabriel D. Parker, Andrew Plymale, Luke Hanley, Xiao-Ying Yu

TL;DR
This paper provides ToF-SIMS spectral data for Paenibacillus sp. 300A biofilms and planktonic cells, identifying key biological molecules for biofilm research.
Contribution
The study offers novel ToF-SIMS spectral reference data for Paenibacillus sp. 300A biofilms and planktonic cells.
Findings
ToF-SIMS identified biological molecules relevant to extracellular polymeric substances in 300A biofilms.
The dataset includes lipids, fatty acids, flavonoids, and quinolones detected with high mass accuracy.
Spectral data from 300A can aid in future biofilm surface and interface research.
Abstract
•Offered ToF-SIMS spectral analysis results of Paenibacillus sp. 300A.•Studied both planktonic cells and biofilms of 300A in ToF-SIMS.•Identified biological molecules relevant to extracellular polymeric substance.•Provide spectral reference data of 300A for biofilm research using SIMS. Offered ToF-SIMS spectral analysis results of Paenibacillus sp. 300A. Studied both planktonic cells and biofilms of 300A in ToF-SIMS. Identified biological molecules relevant to extracellular polymeric substance. Provide spectral reference data of 300A for biofilm research using SIMS. Analysis of bacterial biofilms is particularly challenging and important with diverse applications from systems biology to biotechnology. Among the variety of techniques that have been applied, time-of-flight secondary ion mass spectrometry (ToF-SIMS) has many promising features in studying the surface characteristics…
Genes, proteins, chemicals, diseases, species, mutations and cell lines named across the full text — each resolved to its canonical identifier and authoritative record.
Click any figure to enlarge with its caption.
 Figure 1
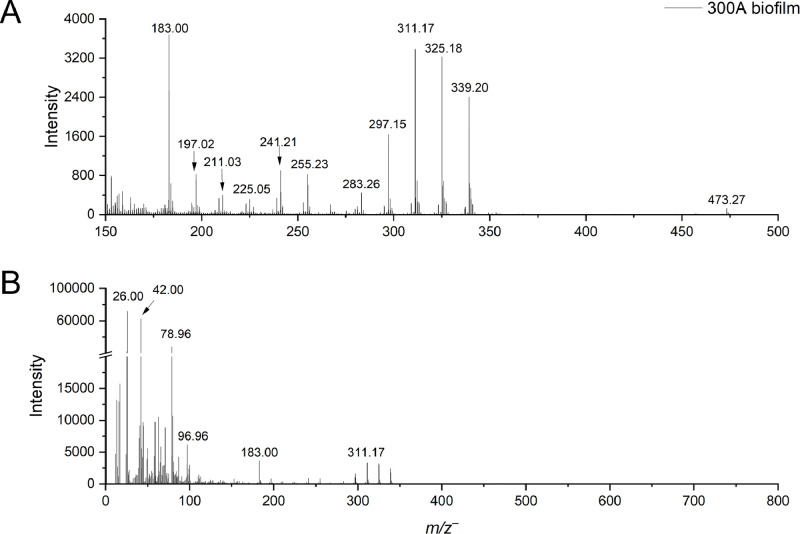 Figure 2
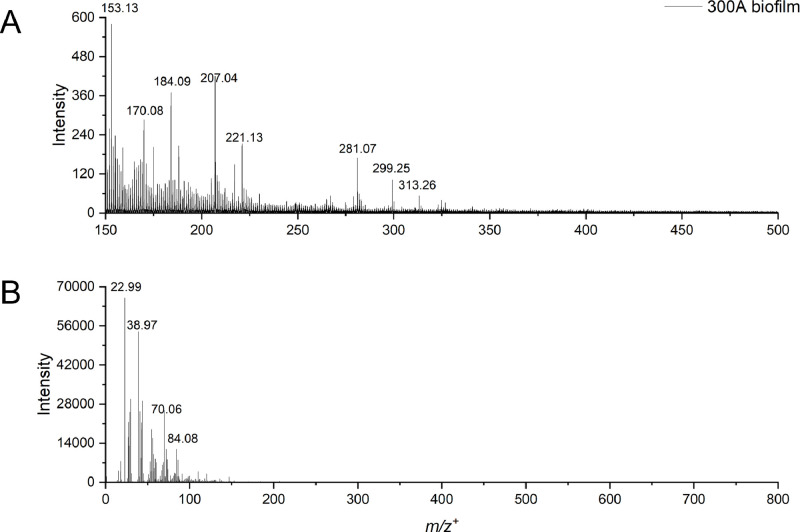 Figure 3
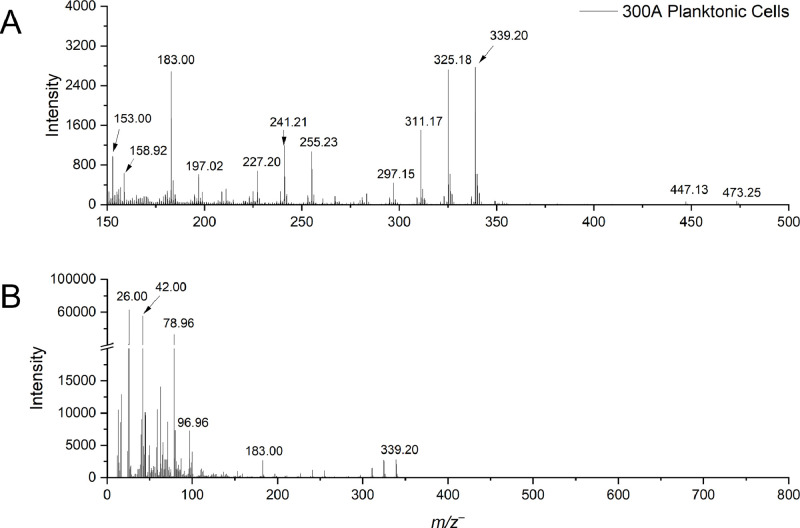 Figure 4
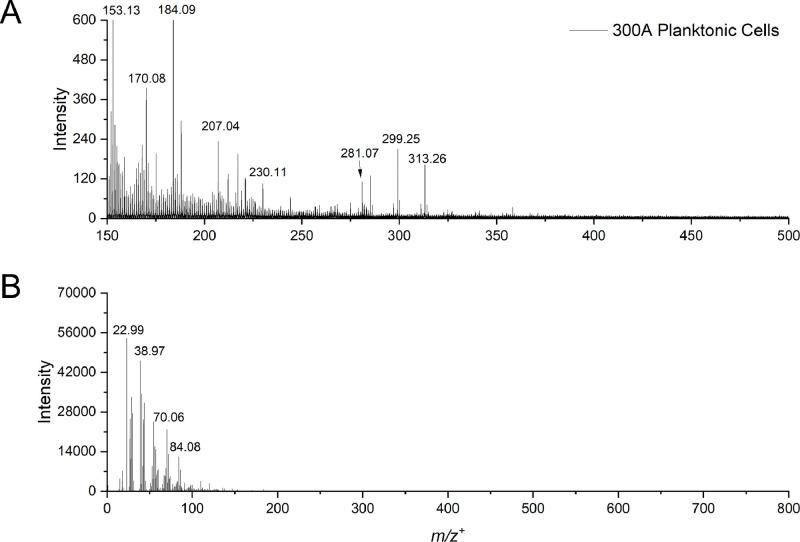 Figure 5
Peer Reviews
No public reviews on file for this paper yet. If you reviewed it on a platform where reviews are public (OpenReview, ICLR, NeurIPS, ICML), you can paste yours below so the community can read it here.
Videos
No videos yet. Explain this paper in a talk, walkthrough, or lecture? Add one.
Taxonomy
TopicsBacterial biofilms and quorum sensing · Ion-surface interactions and analysis · Biosensors and Analytical Detection
Specifications TableSubjectBiological SciencesSpecific subject areaBiochemistryType of dataTable; AnalyzedFigure; RawData collectionTime-of-flight secondary ion mass spectrometer IONTOF TOF-SIMS V was used to collect data in static mode. Static, time-of-flight secondary ion mass spectrometry (ToF-SIMS) spectra were obtained using an IONTOF TOF.SIMS V equipped with a 25 keV Bi_3_^+^ metal ion gun. The raster size for each region of interest was 500 × 500 µm^2^. The number of scans per spectrum is 60. Spectra requiring use of the electron flood gun were specified for each sample. Peak identifications are based on mass formula with a mass deviation of less than 65 ppm.Data source locationInstitution: Oak Ridge National LaboratoryCity/Town/Region: Oak Ridge, TNCountry: United States of AmericaData accessibilityAvailable via IEEE DataPort, DOI: 10.21227/h8vv-hg19Available via Zenodo: https://zenodo.org/records/15446699Related research articleNONE
Value of the Data
1
- •Understanding and identifying small molecule production that the bacterial strain possesses are crucial since there is no existing database for biofilms and components analysed by ToF-SIMS.
- •Paenibacillus sp. 300A comes from the subsurface of the 300 Area of the Hanford site, an area which is contaminated with uranium due to the past nuclear processing at that location [1]. This species is a Gram-positive, rod-shaped facultative anaerobe [1]. Other Paenibacillus rhizobacteria species are known for production of biologically relevant compounds, such as nonribosomally formed peptides, polyketides, antibiotics, phytohormones, lytic enzymes, other biocins, and a wide range of exopolysaccharides, which aid in plant growth and antimicrobial effects [2,3]. The authors are unaware of any published reference SIMS mass spectra for this strain.
- •Using specific bacteria strains to enhance bioremediation is desirable for industries, like agriculture, nuclear waste management, and healthcare. Identifying compounds that bacterial strains secrete can lead to advancement in diverse applications and support efforts towards building a community database for identification of small molecules inherent of extracellular polymeric substance (EPS) using ToF-SIMS.
- •This dataset provides identification of small organic molecules, amino acids, fatty acids, and lipids among other compounds for Paenibacillus sp. 300A*.* This data can be used as a control dataset for the specified organism and as a basis for identification of molecules detected in both positive and negative modes.
Background
2
Paenibacillus sp. 300A comes from the subsurface of the 300 Area of the Hanford site, an area which is contaminated with uranium due past nuclear processing at that location [1]. This species is a Gram-positive, rod-shaped facultative anaerobe [1]. Metals like iron, chromium, and uranium are used as electron acceptors for this bacterium via direct electron transfer or mediated electron transfer [4].
Currently there is no database that identifies small molecules or fragments of products of biofilms via ToF-SIMS for plant growth promotion rhizobacteria (PGPR) species. ToF-SIMS has been used to study biological systems, in particular because of its high mass resolving power and superior surface sensitivity of organics [5,6]. The main objective is to provide a summary of key peaks in both negative and positive ion mode from static ToF-SIMS analysis. ToF-SIMS spectra acquired from both the planktonic cells and corresponding biofilms are both reported. This article focuses mainly on the mid-mass region (m/z 150 – 500), which shows detection of metabolites, fatty acids, and fragments of lipids and polysaccharides from planktonic cells and biofilms of the PGPR strain.
Data Description
3
We focus on reporting the molecules with relevance to EPS [7,8]. Collected ToF-SIMS spectra show the mass range of 0-800 Da while highlighting the mass range 150-500 Da, as this region is of interest for metabolite, fatty acid, and lipid production among other molecules. Fig. 1 depicts the ToF-SIMS spectra of 300A biofilms captured in the negative mode. Table 1 shows possible peak identifications for the 300A biofilm in the negative mode. Fig. 2 depicts the spectra of 300A biofilm acquired in the positive mode. Table 2 possible peak identifications for the 300A biofilm in the positive mode. Fig. 3 shows the ToF-SIMS spectra of planktonic cells captured in the negative mode. Table 3 shows possible peak identifications for the 300A planktonic cells in the negative mode. Fig. 4 shows the ToF-SIMS spectra of planktonic cells captured in the positive mode. Table 4 shows possible peak identifications for the 300A planktonic cells in the positive mode. Each mode provides complementary information of the bacteria. We highlight molecules, such as amino acids, phosphates, sulfates, fatty acids, and lipids, which are important EPS components of the 300A bacterial systems. Supplementary Tables S1 – S4 show ToF-SIMS acquisition conditions used for the biofilm and planktonic cell samples and associated key peak identification of the 300A strain, respectively.Fig. 1. ToF-SIMS spectra of Paenibacillus sp. 300A biofilms in the negative ion mode highlighting (a) m/z^–^ 150-500 and (b) the total mass spectra m/z^–^ 0-800.Fig 1:Table 1. Possible peak identification of molecules of Paenibacillus sp. 300A biofilm in the negative ion mode.Table 1:m/z^−^obs.**m/z^−^theo.∆M, ppmSpeciesAssignmentReference72.009072.0091-1.6017 Amino acidPubChem CID 308060978.963378.959153.1954 PhosphitePubChem CID 10790887.008787.0088-0.7136 Alpha-keto acidRefMet ID: RM0134967100.0417100.040412.4833 Amino acidRefMetID: RM0132184121.0301121.02955.1156 Phenolic acidRefMet ID: RM0134993125.0356125.0357-0.5697 Nucleic acidRefMet ID: RM0040235142.0603142.05983.2031 Amino acid, Sodium adductPubChem CID 6453265152.9991152.99825.5450 Amino acid, Calcium adductRefMet ID: RM0136807183.0079183.00647.9735 Phosphate esterRefMet ID: RM0137078197.0237197.020715.3568 Amino acidRefMet ID: RM0136241211.0399211.0486-41.3290 Amino acidRefMet ID: RM0136351225.0538225.0643-46.7388 Amino acidRefMet ID: RM0138700241.2173241.21730.1676 Fatty acidRefMet ID: RM0153573255.2316255.2330-5.2741 Fatty acidRefMet ID: RM0153571267.1031267.098616.7497 DipeptideRefMet ID: RM0129807283.2626283.2643-5.6851 Fatty acidRefMet ID: RM0153574297.1567297.149623.8506 MetaboliteRefMet ID: RM0188879311.1741311.165328.4618 or MetaboliteRefMet ID: RM0126037 or RM0179668325.1898325.180927.3603 MetaboliteRefMet ID: RM0003142339.2054339.196625.9762 MetaboliteRefMet ID: RM0071119353.2198353.212221.4059 MetaboliteRefMet ID: RM0127981457.2295457.2317-4.8106 TripeptideRefMet ID: RM0139177473.2786473.27566.2903 GlycerolipidRefMet ID: RM0084428501.3124501.306910.9991 GlycerolipidRefMet ID: RM0020985Footnotes:m/z^–^theo.: theoretical mass to charge ratio in the negative ion mode.m/z^–^obs.: observed mass to charge ratio in the negative ion mode.ΔM: ΔM = 10^6^ × (m/z^–^obs.− m/z^–^theo.)/ m/z^–^theo. (expressed in ppm) [9,10].References are provided by PubChem or Metabolomics Workbench.Fig. 2. ToF-SIMS spectra of Paenibacillus sp. 300A biofilms in the positive ion mode highlighting (a) m/z^+^ 150-500 and (b) the total mass spectra m/z^+^ 0-800.Fig 2:Table 2. Possible peak identification of molecules of the Paenibacillus sp. 300A biofilm in the positive ion mode.Table 2:m/z^+^obs.**m/z^+^theo.∆M, ppmSpeciesAssignmentReference84.086184.080863.2974 HydropyridinesRefMet ID: RM0030080110.0808110.0839-27.9815 ImidizolePubChem CID11182587120.0892120.0893-1.3111 HydroxylaminesPubChem CID99287147.0830147.080417.7088 Cinnamic acidRefMet ID: RM0005622153.1341153.127443.5427 IsoprenoidsRefMet ID: RM0135325170.0846170.0937-54.0296 HeteroareneRefMet ID: RM0118125184.0917184.084240.7099 Cyclic dipeptideRefMet ID: RM0156123207.0455207.0499-21.5085 Tricarboxylic acidsRefMet ID: RM0137020217.1845217.179821.3755 Fatty acidRefMet ID: RM0153259221.1320221.127122.0846 Nucleic acidsRefMet ID: RM0136372230.1137230.1261-53.8338 Amino acidRefMet ID: RM0162202267.0085266.996146.2977 ThiazolesRefMet ID: RM0137098281.0765281.0899-47.6716 Amino acidRefMet ID: RM0136301299.2577299.2581-1.4070 Fatty acidRefMet ID: RM0134995313.2670313.2737-21.3388 Fatty acidRefMet ID: RM0152588537.4743537.4877-24.9653 GlycerolipidsRefMet ID: RM0075766Footnotes:m/z^+^theo.: theoretical mass to charge ratio in the negative ion mode.m/z^+^obs.: observed mass to charge ratio in the negative ion mode.ΔM: ΔM = 10^6^ × (m/z^+^obs.− m/z^+^theo.)/ m/z^+^theo. (expressed in ppm) [9,10].Fig. 3. Static ToF-SIMS spectra of Paenibacillus sp. 300A planktonic cells in the negative ion mode highlighting (a) m/z^–^ 150-500 and (b) the total mass spectra m/z^–^ 0-800.Fig 3:Table 3. Possible peak identification of molecules of the Paenibacillus sp. 300A planktonic cells in the negative ion mode.Table 3:m/z^–^obs.**m/z^–^theo.∆M, ppmSpeciesAssignmentReferences62.963562.9641-9.8208 HypophosphitePubChem CID 18314578.962378.959141.1654 PhosphitePubChem CID 10790896.973096.969634.6539 Phosphoric acidPubChem CID 1004100.0412100.04047.7802 Amino acidRefMetID: RM0132184113.0410113.035747.6865 Nucleic acidRefMetID: RM0135879125.0358125.03571.4286 Nucleic acidRefMet ID: RM0040235153.0021152.998225.3987 Nucleic acid, Calcium adductRefMet ID: RM0136807158.9269158.92549.7988 HypophosphatePubChem CID 16131857183.0074183.00645.4330 Phosphate esterRefMet ID: RM0137078197.0233197.020712.9779 Amino acidRefMet ID: RM0136241211.0402211.0486-39.8135 Amino acidRefMet ID: RM0136351227.2013227.2017-1.6694 Fatty acidRefMet ID: RM0153483241.2172241.2173-0.6117 Fatty acidRefMet ID: RM0153573255.2320255.2330-3.8522 Fatty acidRefMet ID: RM0153571267.1036267.10273.5758 DipeptideRefMet ID: RM0129807283.2610283.2643-11.4452 Fatty acidRefMet ID: RM0153574297.1550297.149618.0652 MetaboliteRefMet ID: RM0188879311.1717311.165320.7558 or MetaboliteRefMet ID: RM0126037 or RM0179668325.1889325.180924.6656 MetaboliteRefMet ID: RM0003142339.2049339.196624.6956 MetaboliteRefMet ID: RM0071119353.2112353.2122-2.9081 MetaboliteRefMet ID: RM0127981447.1363447.129714.8723 FlavonoidRefMet ID: RM0052995473.2794473.27567.9510 GlycerolipidRefMet ID: RM0084428Footnotes:m/z^–^theo.: theoretical mass to charge ratio in the negative ion mode.m/z^–^obs.: observed mass to charge ratio in the negative ion mode.ΔM: ΔM = 10^6^ × (m/z^–^obs.− m/z^–^theo.)/ m/z^–^theo. (expressed in ppm) [9,10].References are provided by PubChem or Metabolomics Workbench.Fig. 4. Static ToF-SIMS spectra of Paenibacillus sp. 300A planktonic cells in the positive ion mode highlighting (a) m/z^+^ 150-500 and (b) the total mass spectra m/z^+^ 0-800.Fig 4:Table 4. Possible peak identification of molecules of the Paenibacillus sp. 300A planktonic cells in the positive ion mode.Table 4:m/z^+^obs.m/z^+^theo.∆M, ppmSpeciesAssignmentReferences70.069670.065163.5526 PyrrolinesRefMet ID: RM003853472.085272.080861.8313 Pyrrolidine alkaloidsRefMet ID: RM003492284.085484.080854.9601 HydropyridinesRefMet ID: RM0030080100.0812100.075755.4188 PiperidinonesRefMet ID: RM0016041110.0796110.0839-38.5444 ImidizolePubChem CID11182587120.0884120.0893-7.8735 HydroxylaminesPubChem CID 99287136.0787136.073041.9345 MonosaccharidesRefMet ID: RM0049554147.0792147.076419.0584 DipeptidesRefMet ID: RM0044239153.1327153.127434.5528 IsoprenoidsRefMet ID: RM0135325170.0868170.0937-40.5900 HeteroareneRefMet ID: RM0118125175.1157175.1190-18.7478 Amino acidsRefMet ID: RM0135963184.0943184.0968-13.9091 PhenylethylaminesRefMet ID: RM0046981188.0989188.1070-42.7621 PhenylaminoPubChem CID 5289289207.0452207.0499-22.8705 Tricarboxylic acidsRefMet ID: RM0137020217.1807217.17984.0102 Fatty acidRefMet ID: RM0153259230.1131230.1261-56.3296 Amino acidRefMet ID: RM0162202244.1198244.109442.7400 IsoprenoidsRefMet ID: RM0137173259.1604259.1693-34.1450 Fatty alcoholsRefMet ID: RM0150671268.2560268.239760.9059 Fatty acidsRefMet ID: RM0152615281.0713281.0899-66.1710 Amino acidRefMet ID: RM0136301285.2355285.2424-24.1924 Fatty acidRefMet ID: RM0153311299.2507299.2581-24.7521 Fatty acidRefMet ID: RM0134995313.2638313.2737-31.6156 Fatty acidRefMet ID: RM0152588358.3448358.323060.8480 Sterol LipidsRefMet ID: RM0128098509.4379509.4564-36.3069 GlycerolipidsRefMet ID: RM0076179523.4458523.4721-50.3065 GlycerolipidsRefMet ID: RM0076191537.4592537.4877-53.0280 GlycerolipidsRefMet ID: RM0075766563.4324563.4670-61.4791 GlycerolipidsRefMet ID: RM0035447577.4530577.4827-51.3504 GlycerolipidsRefMet ID: RM0034829Footnotes:m/z^+^theo.: theoretical mass to charge ratio in the negative ion mode.m/z^+^obs.: observed mass to charge ratio in the negative ion mode.ΔM: ΔM = 10^6^ × (m/z^+^obs.− m/z^+^theo.)/ m/z^+^theo. (expressed in ppm) [9,10].
Experimental Design, Materials and Methods
4
The Paenibacillus bacteria strain was cultured on Tryptic Soy Broth (TSB) agar plates [11,12]. All agar plates were incubated at 30°C for 24 hours. After assessing cultures for contamination, one or two pure colonies were inoculated in 10 mL of TSB medium. Planktonic cells were grown to ∼0.6 optical density (OD_600_) [4,13]. Planktonic cells were then harvested by centrifugation for 5 min. at 5000 rpm. After centrifugation, the supernatant was discarded and replaced with 1 mL sterile deionized (DI) water to resuspend. This process was repeated three times, then 200 µL DI water was added for a final resuspension. The planktonic cells were then plated onto sterilized silicon (Si) wafers and air dried under laminar flow within a biosafety cabinet (BSC) [14]. Biofilms were cultured using static cells described previously [15]. Biofilms were grown for 5-6 days, and maturation was observed via optical microscope. Biofilms were then plated onto sterilized Si wafers and dried under laminar flow within a BSC. Si wafer controls were prepared by sonication of wafers in 30 mL ethanol, isopropanol, and acetone, respectively for 5 minutes. The wafers were then blown dry with nitrogen gas after each sonication bath. The cleaned Si wafers were then treated with UV-ozone (model No. 342, Jetlight Company Inc.) for one minute to render the surface hydrophilic [4,15].
Static ToF-SIMS spectra were obtained using an IONTOF TOF-SIMS V equipped with a 25 keV Bi_3_^+^ metal ion gun. The static limit is defined as < 10^13^ ions/cm^2^. Here we calculate the primary ion dose density to be 6.90 × 10^11^ ions/cm^2^. The spectral pixel resolution was 128 × 128. The pulse length was 25 ns and the static primary current was 27 nA. The spectral data was collected with 1 pulse/pixel. The raster size for each region of interest was 500 × 500 µm. Normally, a large area is used when the sample is relatively flat and uniform. The number of scans per spectra is 25. Spectra requiring use of the electron flood gun is specified for each sample. The measurement cycle time was 100 µs ensuring data collections past m/z 800. The figures shown here have possible identifications of molecules matching software (IONTOF SurfaceSpectra v7) suggested mass formula with a mass deviation of less than 65 ppm. The SIMS mass accuracy is defined as ∆M: = 10^6^ × (m/zobs − m/zthe)/ m/zthe (expressed in ppm), where m/zobs and m/zthe refer to the observed and theoretical mass to charge ratio of a specific peak in the negative or positive ion mode [9,10].
The identification procedure followed a multi-step process. The IONTOF database with IonTOF peak searching and mass matching functions are used in peak identification. External database searches were also performed to ascertain peak determination using PubChem, KEGG, and MetabolomicsWorkbench. The mass matching function calculates different combinations of periodic table elements to mass match a selected peak and it will provide a mass deviation and match score. These combinations range from organics to inorganics. Using the “peak search” function within SurfaceSpectra, with parameters of SNR 3.0, max background 0.8, and minimum counts 25, a peak list was generated giving the best mass matching formula for the given m/z value under each specific sample. The peak center mass is entered into external databases to identify biologically relevant possible matches. The bacterial system, isotopic ratio, and plausibility for each identified peak are considered for assignment.
Media controls were also analysed and given peak lists for comparison. Sample and media control peak lists were exported into Excel® where the sample values and media values were sorted based on mass values. Sample peak values within ± m/z 0.05 of media peak values were not included in the provided tables unless the peak has substantial intensity. This value of ± m/z 0.05 was chosen to compensate for slight variations between analysis of sample and media. The biofilm or planktonic sample had some overlapping spectral features to with media. If there were standout values above ± m/z 0.05, then they were treated as unique to the biofilm or planktonic cell sample. These removals left biological peaks not relating to media or other inorganic artifacts.
Peak assignment was further verified by literature search pertaining to possible biological molecules. Many databases were surveyed for molecular assessment such as PubChem, ChEBI, LipidMaps, MetabolomicsWorkbench, and KEGG. Assignment was based on the mass accuracy from the associated peak value to the corresponding value within the aforementioned databases. All identifications are molecular classes, such as fatty acid, lipid, metabolite, etc., only due to the large number of possibilities each m/z value presents, with the best match based on relative mass accuracy and possible biofilm biological functions. While mass matching is important in peak identification, it is not the only factor considered when assigning peaks. For example, m/z^–^ 311.1741 is identified as C_20_H_23_O_3_^–^, however, it also has the possibility to be C_12_H_21_N_7_O_3_^—^, C_15_H_25_N_3_O_4_^—^, or C_13_H_21_N_5_O_4_^—^. For meaningful peak assignment, we take into consideration factors such as the isotopic ratios, if present, the surrounding spectra and biological context, and the ionization possibility of the molecule. For example, while the mass values for C_12_H_21_N_7_O_3_^—^, C_15_H_25_N_3_O_4_^—^, and C_13_H_21_N_5_O_4_^—^ match closely with 311.1741, these molecules are peptides in their neutral state. On the other hand, C_20_H_23_O_3_^—^ is the anion of C_20_H_24_O_3_, which is a hydroxybenzoate enzyme molecule. When considering the charge of the molecule, there are three other possibilities which the mass 311.1741 could be labelled. It could be C_13_H_28_O_6_P^—^, C_17_H_27_O_3_S^—^, or C_19_H_23_N_2_O_2_^—^. C_13_H_28_O_6_P^—^ is a glycerophospholipid and could be a possibility given the nature of biofilms, C_17_H_27_O_3_S^—^ is a benzenoid benzenesulfonic acid which has a surfactant role, and C_19_H_23_N_2_O_2_^—^ is a cyclic dipeptide consisting of two arginine. When all things are considered, C_20_H_23_O_3_^—^ and C_13_H_28_O_6_P^—^ are the likely candidates based on available information and our understanding of the biofilms. The chemistry of the molecule is then considered. Due to limited reporting on C_13_H_28_O_6_P^—^, this molecule is not reliable to use in peak assignment. This is why we choose to report C_20_H_23_O_3_^—^ as the possible identification. Major species identified in the 300 A spectra are amino acids, fatty acids, lipids, and other relevant molecules. Our findings are in agreement with previous results [4,16]. More specific identification of molecules would need to be corroborated with tandem MS and/or other complimentary techniques [17]. The same process was applied to m/z values below 150, where more inorganic ions are present.
Data plotting was done using OriginPro 2023, where the data was extracted from the SIMS files and converted to ASCII files with bin equal to 1 to show raw data. Data files will be made accessible to the public using data archives. The data was calibrated before ASCII conversion. Calibration points for each of the biological samples was attempted to be made the same when possible. Calibration peaks used for the 300A strain were CH_2_^–^, CHO_2_^–^, C_2_H_2_NO_2_^–^ C_4_H_6_NO_2_^–^, C_15_H_29_O_2_^–^, and C_16_H_31_O_2_^–^ for the negative mode and CH_3_^+^, C_4_H_5_^+^, C_3_H_6_NO_2_^+^, C_8_H_10_NO^+^, C_9_H_14_NO_3_^+^, and C_9_H_16_N_3_O_4_^+^ for positive mode, respectively.
Limitations
None.
Ethics Statement
The authors confirm that they have read and follow the ethical requirements for publication in Data in Brief and confirm that the current work does not involve human subjects, animal experiments, or any data collected from social media platforms.
Credit Author Statement
Gabriel D. Parker: Data Curation, Formal Analysis, Investigation, Methodology, Validation, Original Draft Preparation, Writing – review & editing. Xiao-Ying Yu: Conceptualization, Funding Acquisition, Data Curation, Formal Analysis, Investigation, Methodology, Project Administration, Resources, Software, Supervision, Validation, Writing – review & editing. Luke Hanley: Resources, Supervision, Validation, Writing – review & editing. Andrew Plymale: Resources, Supervision, Validation, Writing – review & editing.
The reference list from the paper itself. Each links out to its DOI / PubMed record.
- 1Ahmed B.Cao B.Mc Lean J.S.Ica T.Dohnalkova A.Istanbullu O.Paksoy A.Fredrickson J.K.Beyenal H.Fe(III) reduction and U(VI) immobilization by Paenibacillus sp. strain 300A, isolated from Hanford 300A subsurface sediments Appl. Environ. Microbiol.782012800180092296190310.1128/AEM.01844-12PMC 3485948 · doi ↗ · pubmed ↗
- 2Grinev V.S.Tregubova K.V.Anis'kov A.A.Sigida E.N.Shirokov A.A.Fedonenko Y.P.Yegorenkova I.V.Isolation, structure, and potential biotechnological applications of the exopolysaccharide from Paenibacillus polymyxa 92Carbohydr. Polym.232202011578010.1016/j.carbpol.2019.11578031952589 · doi ↗ · pubmed ↗
- 3Vater J.Herfort S.Doellinger J.Weydmann M.Dietel K.Faetke S.Lasch P.Fusaricidins from Paenibacillus polymyxa M-1, a family of lipohexapeptides of unusual complexity-a mass spectrometric study J. Mass Spectrom.5220177152771490110.1002/jms.3891 · doi ↗ · pubmed ↗
- 4Ding Y.Zhou Y.Yao J.Szymanski C.Fredrickson J.Shi L.Cao B.Zhu Z.Yu X.Y.In situ molecular imaging of the biofilm and its matrix Anal. Chem.88201611244112522770990310.1021/acs.analchem.6b 03909 · doi ↗ · pubmed ↗
- 5G.D. Parker, L. Hanley, X.-Y. Yu, Mass spectral imaging to map plant–microbe interactions, Microorganisms, 11 (2023) 2045.10.3390/microorganisms 11082045 PMC 1045944537630605 · doi ↗ · pubmed ↗
- 6Fernandez-Remolar D.C.Gomez-Ortiz D.Malmberg P.Huang T.Shen Y.Angles A.Amils R.Preservation of underground microbial diversity in ancient subsurface deposits (>6 Ma) of the Rio Tinto basement Microorganisms 202193444267110.3390/microorganisms 9081592 PMC 8400296 · doi ↗ · pubmed ↗
- 7Seviour T.Derlon N.Dueholm M.S.Flemming H.C.Girbal-Neuhauser E.Horn H.Kjelleberg S.van Loosdrecht M.C.M.Lotti T.Malpei M.F.Nerenberg R.Neu T.R.Paul E.Yu H.Q.Lin Y.M.Extracellular polymeric substances of biofilms: suffering from an identity crisis Water Res.1512019173055777810.1016/j.watres.2018.11.020 · doi ↗ · pubmed ↗
- 8Gao L.Lu X.Liu H.Li J.Li W.Song R.Wang R.Zhang D.Zhu J.Mediation of extracellular polymeric substances in microbial reduction of hematite by Shewanella oneidensis MR-1Front. Microbiol.2019103098412810.3389/fmicb.2019.00575 PMC 6449630 · doi ↗ · pubmed ↗