Development and validation of a novel clinical-radiological-pathological scoring system for preoperative prediction of extraprostatic extension in prostate cancer: a multicenter retrospective study
Liqin Yang, Pengfei Jin, Ximing Wang, Zhiping Li, Huijing Xu, Yongsheng Zhang, Feng Cui

TL;DR
This study created a new scoring system combining clinical, radiological, and pathological data to predict prostate cancer spread before surgery.
Contribution
A novel multimodal scoring system for preoperative prediction of extraprostatic extension in prostate cancer is developed and validated.
Findings
The scoring system showed robust predictive accuracy with AUCs of 0.849, 0.830, and 0.847 in derivation and validation cohorts.
The system outperformed the NCI_EPE in two validation cohorts and provided higher net clinical benefit according to decision curve analysis.
Patients were stratified into four risk tiers with corresponding EPE probabilities of 9.9%, 26.0%, 52.0%, and 85.0%.
Abstract
To develop and validate a multimodal scoring system integrating clinical, radiological, and pathological variables to preoperatively predict extraprostatic extension (EPE) in prostate cancer (PCa). This retrospective study included 667 PCa patients divided into a derivation cohort and two validation cohorts. Evaluated parameters comprised prostate-specific antigen density (PSAD), curvilinear contact length (CCL), lesion longest diameter (LD), National Cancer Institute EPE grade (NCI_EPE), International Society of Urological Pathology grade (ISUP), and other relevant variables. Independent predictors were identified through univariate and multivariate regression analysis to construct a logistic model. Coefficients from this model were then weighted to establish a scoring system. The predictive performance of the NCI_EPE, logistic model, and scoring system was systematically evaluated…
Genes, proteins, chemicals, diseases, species, mutations and cell lines named across the full text — each resolved to its canonical identifier and authoritative record.
Click any figure to enlarge with its caption.
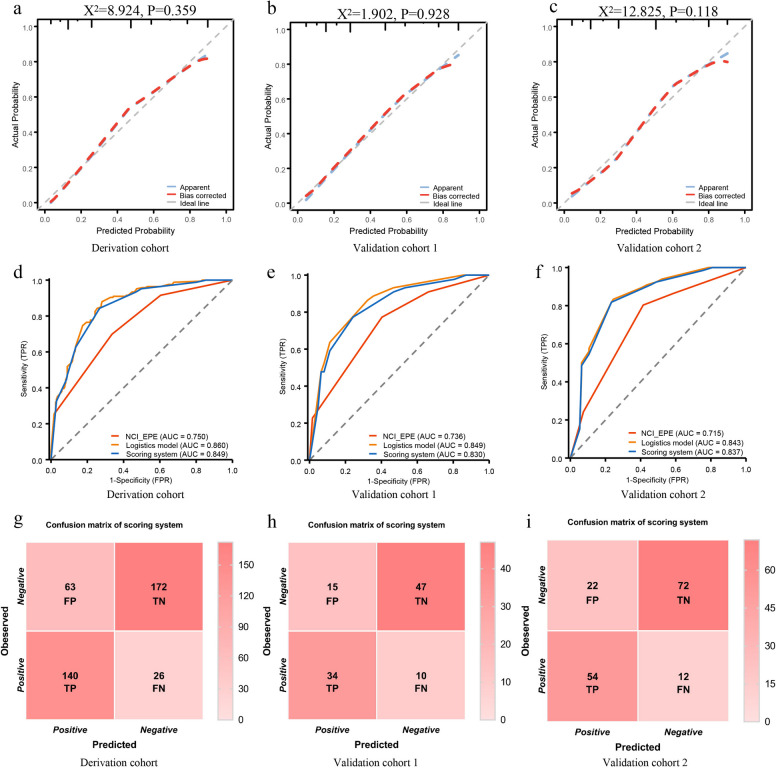 Figure 1
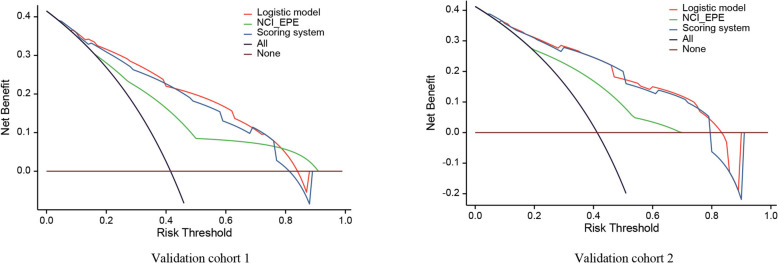 Figure 2
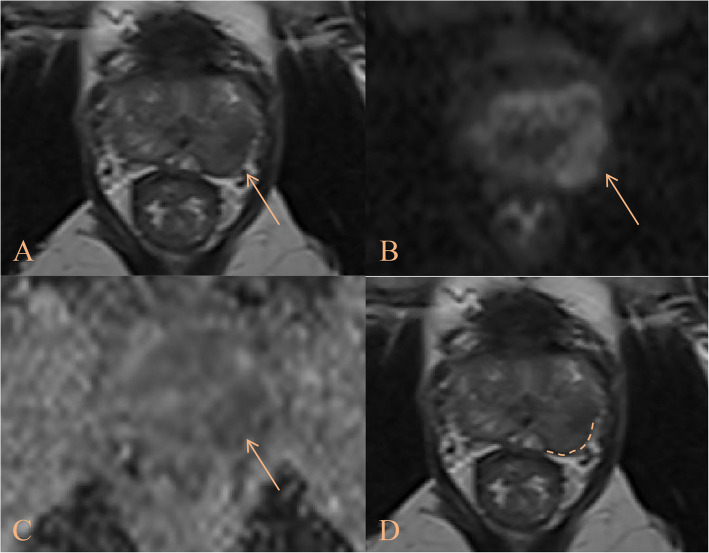 Figure 3
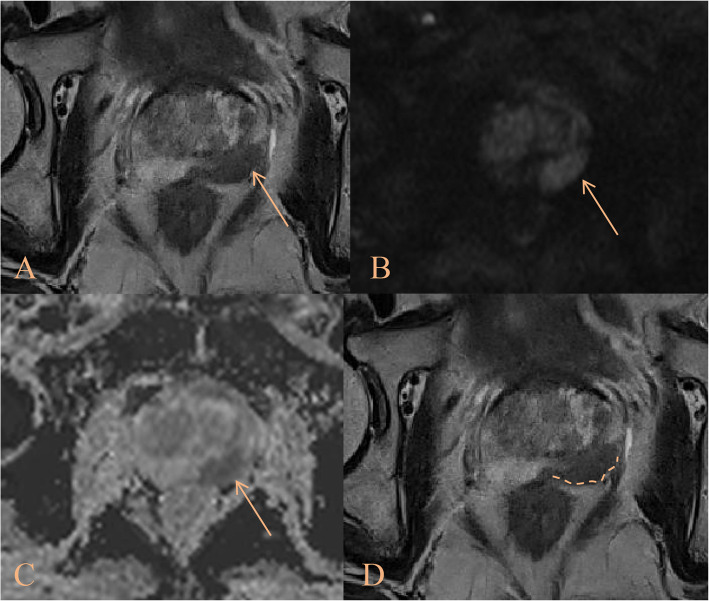 Figure 4
 Figure 5
- —https://doi.org/10.13039/501100017594Medical Science and Technology Project of Zhejiang Province
- —Traditional Chinese Medicine Science and Technology Project of Zhejiang Province
- —Medical Health Science and Technology Project of Hangzhou
Peer Reviews
No public reviews on file for this paper yet. If you reviewed it on a platform where reviews are public (OpenReview, ICLR, NeurIPS, ICML), you can paste yours below so the community can read it here.
Videos
No videos yet. Explain this paper in a talk, walkthrough, or lecture? Add one.
Taxonomy
TopicsProstate Cancer Diagnosis and Treatment · Prostate Cancer Treatment and Research · Urologic and reproductive health conditions
Introduction
Prostate cancer (PCa) ranks as the most commonly diagnosed malignancy in males across over half of all countries globally. In 2022 alone, it accounted for approximately 1.5 million new cases, with incidence rates continuing to rise annually [1]. The invasiveness of PCa directly influences clinical decision-making, including disease staging and surgical planning, which collectively determine patient prognosis. Extraprostatic extension (EPE), a pathological hallmark of locally advanced PCa, is strongly associated with adverse oncological outcomes, including positive surgical margins (PSM), biochemical recurrence (BCR), and elevated cancer-specific mortality [2]. Nerve-sparing radical prostatectomy (NSRP) offers a greater chance of retaining potency and urinary continence. However, NSRP is contraindicated in patients with PCa suspected of EPE positive, as it may elevate the risk of PSM or BCR, thereby adversely impacting prognosis [3]. Consequently, developing noninvasive and reliable preoperative tools to predict EPE is imperative for balancing oncological safety with functional preservation, enabling tailored surgical planning.
Previous studies have established prediction models for EPE, such as the Partin Scale, Cancer of the Prostate Risk Assessment (CAPRA) score, and Memorial Sloan Kettering Cancer Center (MSKCC) nomogram, primarily based on clinical variables [4–6]. However, these models demonstrated moderate predictive accuracy (AUC: 0.609–0.805) and inconsistent correlation with final pathological outcomes, limiting their clinical utility [7]. Magnetic Resonance Imaging (MRI) plays a pivotal role in PCa diagnosis and has shown superior performance over clinically derived models for predicting EPE [8, 9]. The National Cancer Institute EPE grade (NCI_EPE) proposed by Mehralivand et al. was introduced to improve MRI-based EPE detection, employing standardized quantitative imaging parameters [10]. Despite these advancements, the predictive accuracy of subjective MRI interpretation remains constrained by variability in image quality, heterogeneous EPE imaging features, and inter-observer discrepancies in radiological expertise [11, 12]. Despite these efforts, studies combining radiological or radiomics features with clinical parameters to improve EPE prediction accuracy have predominantly employed single-center validation, and their complexity limits clinical adoption [13–16]. To address these limitations, this multicenter study aims to develop and validate a clinically practical scoring system integrating clinical, radiological, and pathological variables for preoperative predicting EPE.
Materials and methods
Study population
This retrospective study, approved by the Institutional Ethics Committee in accordance with the Declaration of Helsinki, waived the requirement for written informed consent.
We enrolled 1459 patients with pathological confirmed PCa who underwent radical prostatectomy (RP) between January 2021 and December 2024 across three institutions (Institution 1: n = 670, Institution 2: n = 329, Institution 3: n = 460). Exclusion criteria were: (1) Incomplete pathological reports precluding definitive EPE assessment (Institution 1: n = 126, Institution 2: n = 98, Institution 3: n = 132); (2) History of prior interventions (e.g., biopsy, surgery, or androgen deprivation therapy) preceding MRI (Institution 1: n = 55, Institution 2: n = 31, Institution 3: n = 48); (3) Poor-quality MRI images (e.g., susceptibility artifacts, motion degradation) compromising radiological interpretation (Institution 1: n = 88, Institution 2: n = 94, Institution 3: n = 120).
Finally, a total of 401 PCa patients from Institution 1 were designated as the derivation cohort for the development of scoring system. External validation was performed using two independent cohorts: validation cohort 1 (n = 106, Institution 2) and validation cohort 2 (n = 160, Institution 3), to assess the robustness and generalizability of the scoring system.
Clinical and pathological variables
Clinical variables [age and the preoperative prostate-specific antigen (PSA)] were independently abstracted from medical records by researchers blinded to imaging data. Prostate-specific antigen density (PSAD) was calculated as serum PSA divided by prostate volume (PV). Consistent with established evidence demonstrating MRI's superior correlation with surgical specimen volumes and transrectal ultrasound (TRUS)'s tendency to underestimate PV [17], we utilized MRI-derived volumetry for all PV measurements.
Pathological assessment utilized the International Society of Urological Pathology (ISUP) grades from preoperative biopsies. All participants underwent standardized 10–12 core TRUS-guided systematic biopsies (SB) performed by an interventional ultrasonographer (5–8 years' experience). For patients with PI-RADS ≥ 3 lesions, supplementary TRUS-MRI fusion or cognitive fusion-targeted biopsies of index lesions were obtained. All specimens were processed according to ISUP standardized guidelines.
MRI acquisition protocol
All institutions performed 3.0 T MRI using phased-array body coils (Institution 1: Philips Achieva; Institution 2: Philips Ingenia; Institution 3: GE Healthcare, Discovery 750 W), adhering to Prostate Imaging Reporting and Data System version 2.1 (PI-RADS v2.1) protocols [18]. Patients received 20 mg of intravenous hyoscine butylbromide (Buscopan®) 1–2 min prior to scanning to suppress bowel peristalsis and they were instructed to empty their bladder naturally 1 h before the examination. Standardized sequences included T2-weighted imaging (T2WI), high b-value diffusion-weighted imaging (DWI) with apparent diffusion coefficient (ADC) maps, and axial dynamic contrast-enhanced (DCE) imaging. For DCE, a Gd-based contrast agent was administered intravenously at 0.1 mmol/kg body weight, with an injection rate of 2–3 mL/s and temporal resolution of 10–15 s. MRI sequence parameters are detailed in Supplementary Table S1.
Image analysis
Two experienced radiologists [Reader 1 (L.Q.Y.) and Reader 2 (P.F.J.): 3 and 5 years of prostate MRI experience, respectively] independently assessed PI-RADS v2.1 scores and NCI_EPE grade [10, 18], blinded to pathological results. Discordant interpretations were resolved by a third senior radiologist (10 years of prostate MRI expertise, X.M.W), with final determinations reached through consensus. All radiologists were underwent joint training using NCI_EPE, PI-RADS, and lesion measurements before the assessment.
All measurements about lesions were obtained based on the index lesion. Evidence suggested secondary lesion-targeted biopsies provide limited additional diagnostic value when index lesion-targeted biopsies and SB had already performed [19]. Although PCa exhibits multifocality, the index lesion is the core factor driving disease progression. In addition, clinical treatment decisions (e.g., surgical planning) also prioritize the index lesion as the driver of adverse pathology. The study therefore focused the analysis exclusively on index lesions, excluding secondary lesions. To standardize identification, the index lesion was defined as the dominant nodule with either the highest PI-RADS score or largest diameter.
We obtained the following parameters from MRI images: PV, calculated via the ellipsoid formula (π/6 × anteroposterior × transverse × longitudinal diameters on T2WI images); location, classified as peripheral zone (PZ), transition zone (TZ), or PZ + TZ; longest diameter (LD); shortest diameter (SD); lesion volume (LV), manually segmented using ITK-SNAP (v3.4.0; www.itk-snap.org); ADC_mean, quantified from ADC maps; capsular contact length (CCL), defined as the maximal curvilinear tumor-capsule interface, measured using Bessel curve reconstruction on axial T2WI.
The NCI_EPE stratify extracapsular involvement into four grades based on MRI findings [10]: Grade 0: no capsular contact or CCL < 15 mm; Grade 1: CCL ≥ 15 mm or capsular irregularity/bulge; Grade 2: CCL ≥ 15 mm and capsular irregularity/bulge; Grade 3: Unequivocal evidence of capsular disruption with tumor extension into periprostatic fat or direct invasion of adjacent structures.
Categorical variables in the final analysis were based on consensus interpretations, while continuous variables were represented as mean values derived from both readers’ measurements to mitigate inter-reader variability.
Radiological-pathological correlation
Pathological evaluation of RP specimens by a dedicated genitourinary pathologist served as the reference standard for EPE diagnosis. EPE status was extracted from surgical pathology reports. To ensure precise spatial correlation between MRI-identified lesions and pathology, a senior urologist experienced in PCa diagnosis supervised the alignment of radiological and pathological findings. Only MRI-visible lesions with confirmed pathological correspondence were retained for analysis. EPE was pathologically defined as tumor extension beyond the prostate capsule, which was considered as pT3. Conversely, those without EPE were pT2.
Statistical analysis
Analyses were performed using R software (v4.1.0). Continuous variables were expressed as mean ± standard deviation or median (interquartile range [IQR]), with comparisons made via independent T-tests or Mann–Whitney U tests, contingent on normality assessed by the Shapiro–Wilk test. Categorical variables were reported as frequencies (percentages) and analyzed using chi-square tests.
In the derivation cohort, variables with statistically significance between pT2 and pT3 were dichotomized using receiver operating characteristic (ROC)-derived optimal thresholds or clinical consensus. These variables were retained for univariate and multivariate logistic regression analyses after confirming no multicollinearity. Independent predictors identified through this analysis were used to construct the logistic model, and their regression coefficients (β) were subsequently weighted to establish the scoring system: each variable’s score = β/β_min_ × 2, where β_min_ represents the smallest coefficient among retained variables [20, 21]. Total scores were calculated by summing individual weighted scores.
The area under the curve (AUC), sensitivity, specificity, positive predictive value (PPV), negative predictive value (NPV), and accuracy of the NCI_EPE grade, logistic model, and scoring system were calculated. Comparisons were conducted using the DeLong test for AUC differences and the P values of multiple testing among the three groups were adjusted using the Bonferroni correction. Hosmer–Lemeshow test was employed to assess the agreement between the scoring system and pathological results. Decision curve analysis (DCA) evaluated net clinical benefit across probability thresholds. P < 0.05 considered statistically significant.
Results
Baseline characteristics
This study enrolled 667 patients with PCa, stratified into a derivation cohort (n = 401) and two validation cohorts (n = 106 and n = 160). pT3 incidences were comparable across cohorts: 41.4% (166/401) in the derivation cohort, 41.5% (44/106) in validation cohort 1, and 41.3% (66/160) in validation cohort 2. No significant intercohort differences were observed in age, ADC_mean, PSA, PV, PSAD, position, LV, LD, SD, CCL, CCL/LD, NCI_EPE, PI-RADS, or ISUP (all P > 0.05, Table 1). Table 1. The general data of patients in the derivation and validation cohortsCharacteristicsDerivation cohortValidation cohort 1Validation cohort 2P valuen401106160label, n (%)0.999 pT2235 (58.6%)62 (58.5%)94 (58.8%) pT3166 (41.4%)44 (41.5%)66 (41.3%)Age (year), median (IQR)71 (66, 74)70.5 (66, 74)71 (65, 75)0.943ADC_Mean, median (IQR)0.86 (0.68, 1.03)0.81 (0.62, 1.06)0.88 (0.72, 1.06)0.427Position, n (%)0.727 PZ212 (52.9%)52 (49.1%)82 (51.3%) TZ129 (32.2%)41 (38.7%)52 (32.5%)PZ + TZ60 (15.0%)13 (12.3%)26 (16.3%)SD (mm), median (IQR)10.40 (7.70, 14.60)10.75 (8.20, 16.63)11.15 (7.90, 15.40)0.531NCI_EPE, n (%)0.060 0107 (26.7%)25 (23.6%)48 (30.0%) 199 (24.7%)22 (20.8%)20 (12.5%) 2149 (37.2%)48 (45.3%)69 (43.1%) 346 (11.5%)11 (10.4%)23 (14.4%)PSA (ng/ml), median (IQR)13.88 (8.62, 26.30)13.70 (8.15, 30.43)14.40 (9.31, 26.40)0.927PV (ml), median (IQR)38.47 (28.45, 54.49)35.81 (26.49, 53.95)38.80 (27.71, 58.85)0.496PSAD (ng/ml/cm^3^), median (IQR)0.35 (0.20, 0.78)0.375 (0.20, 0.805)0.335 (0.21, 0.81)0.948CCL (mm), median (IQR)21.80 (9.80, 36.70)24.65 (12.45, 34.80)23.50 (9.48, 29.43)0.188LD (mm), median (IQR)17.50 (12.40, 25.80)18.65 (14.73, 26.03)17.50 (12.00, 27.33)0.410CCL/LD, median (IQR)1.23 (0.70, 1.69)1.26 (0.91, 1.67)1.10 (0.64, 1.57)0.106LV (ml), median (IQR)1.53 (0.66, 4.45)1.78 (0.85, 4.30)1.58 (0.71, 4.61)0.509PI-RADS, n (%)0.669 249 (12.2%)14 (13.2%)23 (14.4%) 334 (8.5%)9 (8.5%)13 (8.1%) 493 (23.2%)16 (15.1%)31 (19.4%) 5225 (56.1%)67 (63.2%)93 (58.1%)ISUP, n (%)0.596 137 (9.2%)10 (9.4%)19 (11.9%) 293 (23.2%)32 (30.2%)43 (26.9%) 3108 (26.9%)26 (24.5%)48 (30.0%) 479 (19.7%)17 (16.0%)23 (14.4%) 584 (20.9%)21 (19.8%)27 (16.9%)PSA Prostate specific antigen, PV Prostate volume, PSAD Prostate specific antigen density, PZ Peripheral zone, TZ Transition zone, LV Lesion volume, LD Longest diameter, SD Shortest diameter, CCL Curvilinear contact length, NCI_EPE National Cancer Institute extraprostatic extension, PI-RADS Prostate Imaging Report and Data System version, ADC Apparent Diffusion Coefficient, ISUP International Society of Urological Pathology
Development of the scoring system
The inter-group analysis in the derivation cohort (Table 2) showed that there were statistically significant differences between pT2 and pT3 in terms of position, SD, LD, CCL, CCL/LD, PSA, PSAD, LV, NCI_EPE, PI-RADS, and ISUP (P < 0.05). Among them, PSA, CCL and LD were excluded in the subsequent analyses due to the multicollinearity with PSAD and CCL/LD. Then, the retained variables were dichotomized via ROC curve analysis (Supplementary Table S2). PSAD was categorized using a clinically cutoff (≥ 0.20 ng/mL/cm^3^). Table 2. The general data of patients in the derivation cohortCharacteristicspT2pT3P valuen235 (58.6%)166 (41.4%)Age (year), median (IQR)71 (66, 74)71 (66, 75)0.622ADC_Mean, median (IQR)0.85 (0.65, 1.07)0.87 (0.71, 1.01)0.793Position, n (%) < 0.001 PZ125 (53.2%)87 (52.4%) TZ96 (40.9%)33 (19.9%)PZ + TZ14 (6.0%)46 (27.7%)SD (mm), median (IQR)9.1 (7.0, 12.7)12.35 (9.15, 20.5) < 0.001NCI_EPE, n (%) < 0.001 093 (39.6%)14 (8.4%) 163 (26.8%)36 (21.7%) 275 (31.9%)74 (44.6%) 34 (1.7%)42 (25.3%)PSA (ng/ml), median (IQR)10.75 (7.43, 17.95)22.85 (12.01, 42.00) < 0.001PV (ml), median (IQR)39.35 (28.97, 56.80)36.43 (26.92, 50.72)0.051PSAD (ng/ml/cm^3^), median (IQR)0.26 (0.17, 0.44)0.66 (0.34, 1.26) < 0.001CCL (mm), median (IQR)16.20 (5.35, 26.20)33.65 (19.50, 57.96) < 0.001LD (mm), median (IQR)14.7 (10.95, 20.65)23.30 (16.13, 32.50) < 0.001CCL/LD, median (IQR)1.08 (0.36, 1.42)1.53 (1.09, 1.93) < 0.001LV (ml), median (IQR)1.04 (0.44, 2.91)3.06 (1.11, 7.82) < 0.001PI-RADS, n (%) < 0.001 245 (19.1%)4 (2.4%) 329 (12.3%)5 (3.0%) 458 (24.7%)35 (21.1%) 5103 (43.8%)122 (73.5%)ISUP, n (%) < 0.001 132 (13.6%)5 (3.0%) 275 (31.9%)18 (10.8%) 377 (32.8%)31 (18.7%) 427 (11.5%)52 (31.3%) 524 (10.2%)60 (36.1%)PSA Prostate specific antigen, PV Prostate volume, PSAD Prostate specific antigen density, PZ Peripheral zone, TZ Transition zone, LV Lesion volume, LD Longest diameter, SD Shortest diameter, CCL Curvilinear contact length, NCI_EPE National Cancer Institute extraprostatic extension, PI-RADS Prostate Imaging Report and Data System version, ADC Apparent Diffusion Coefficient, ISUP International Society of Urological Pathology
Univariate and multivariate logistic regression analyses (Table 3) identified NCI_EPE (≥ 2), PSAD (≥ 0.20), CCL/LD (> 1.34), and ISUP (≥ 4) as independent predictors of EPE, forming the logistic model. Each independent predictor was assigned a weighted score using the formula: ß/ß_min_ × 2. Scores were allocated as follows: NCI_EPE (≥ 2) = 2 (ß = 1.031), PSAD (≥ 0.20) = 3 (ß = 1.261), CCL/LD (> 1.34) = 2 (ß = 0.946), and ISUP (≥ 4) = 5 (ß = 2.183). The total score of the scoring system ranged from 0 to 12, with incremental values reflecting escalating EPE risk. Table 3. The univariate and multivariate analyses in the derivation cohort and weighted pointsCharacteristicsTotal (N)Univariate analysisMultivariate analysisOdds Ratio (95% CI)P valueßOdds Ratio (95% CI)P valueWeighted scoreNCI_EPE401 < 2206ReferenceReference ≥ 21954.581 (2.986–7.029)** < 0.0011.0312.803 (1.512–5.195)0.0012LV (ml)401 < 1.89240ReferenceReference ≥ 1.891612.735 (1.809–4.135) < 0.0010.683 (0.375–1.245)0.213PSAD (ng/ml/cm^3^)401 < 0.2091ReferenceReference ≥ 0.203104.028 (2.273–7.140)< 0.0011.2613.528 (1.759–7.076)< 0.0013CCL/LD401 < 1.34227ReferenceReference ≥ 1.341744.547 (2.971–6.961) < 0.0010.9462.576 (1.472–4.509)< 0.0012PI-RADS401 < 5176ReferenceReference ≥ 52253.553 (2.311–5.464) < 0.0011.563 (0.846–2.890)0.154SD (mm)401 < 8.95152ReferenceReference ≥ 8.952493.341 (2.139–5.220) < 0.0011.498 (0.805–2.790)0.202ISUP401 < 4238ReferenceReference ≥ 41637.483 (4.776–11.724)< 0.0012.1838.870 (5.160–15.247)< 0.001**5NCI_EPE National Cancer Institute extraprostatic extension, LV Lesion volume, PSAD Prostate specific antigen density, CCL Curvilinear contact length, LD Longest diameter, PI-RADS Prostate Imaging Report and Data System version, SD Shortest diameter, ISUP International Society of Urological Pathology, CI Confidence interval, ß correlation coefficient. Data in bold indicates P < 0.05
Predictive performance comparison
The Hosmer–Lemeshow test demonstrated good calibration of the scoring system with pathological EPE outcomes across all cohorts (P = 0.348 [derivation], 0.928 [validation 1], and 0.118 [validation 2]; Fig. 1: a-c). Optimal thresholds for discriminating EPE risk were consistent across cohorts: ≥ 2 for the NCI_EPE, ≥ 0.36 probability for the logistic model, and ≥ 6 points for the scoring system.Fig. 1a-c The calibration curve for the evaluation of EPE between the scoring system and the pathological results in the derivation cohort, validation cohort 1 and validation cohort 2. d-f The comparison of the performance among NCI_EPE, logistic model and scoring system in the derivation cohort, validation cohort 1 and validation cohort 2. g-i The confusion matrix distribution diagram of the prediction of EPE by scoring system in the derivation cohort, validation cohort 1 and validation cohort 2. EPE: Extraprostatic extension, NCI_EPE: National Cancer Institute extraprostatic extension, AUC: areas under the curve,TP: true positive, TN: true negative, FP: false positive, FN: false negative
The NCI_EPE demonstrated suboptimal performance across all cohorts, with AUC values ranging only from 0.715 to 0.750. In the derivation cohort, specificity and PPV for NCI_EPE were low (specificity of 0.663 and PPV of 0.595). However, both the logistic model and scoring system significantly improved these metrics (specificity: 0.719 and 0.732; PPV: 0.689 and 0.690, respectively). Similar trends were observed in the validation cohorts, where the NCI_EPE exhibited limited specificity and PPV, while the logistic model and scoring system achieved marked enhancements. The logistic model and scoring system showed comparable predictive performance (Derivation cohort: 0.860 vs. 0.849, P = 0.228, Validation cohort 1: 0.849 vs. 0.830, P = 0.711, Validation cohort 2: 0.843 vs. 0.837, P = 0.738), significantly outperforming the NCI_EPE (Derivation cohort: 0.860 and 0.849 vs. 0.750, both P < 0.003, Validation cohort 1: 0.849 and 0.830 vs. 0.736, P = 0.024 and 0.138, Validation cohort 2: 0.843 and 0.837 vs. 0.715, P < 0.003 and P = 0.003). Comprehensive results were illustrated in Fig. 1, d–f and summarized in Table 4. Table 4. The comparison of the performance among NCI_EPE grade, logistic model and scoring system in the derivation and validation cohortsGroupsDerivation cohortValidation cohort 1Validation cohort 2SchemesNCI_EPELogistic modelScoring systemNCI_EPELogistic modelScoring systemNCI_EPELogistic modelScoring systemcut-off ≥ 2 ≥ 0.36 ≥ 6 ≥ 2 ≥ 0.36 ≥ 6 ≥ 2 ≥ 0.36 ≥ 6Sensitivity0.6990.8800.8430.7730.8640.7730.8030.8330.818Specificity0.6630.7190.7320.5970.6770.7580.5850.7550.766Accuracy0.6780.7860.7780.670.7550.7640.6750.7880.788PPV0.5950.6890.6900.5760.6550.6940.5760.7050.711NPV0.7570.8940.8690.7870.8750.8250.8090.8660.857AUC(95% CI)0.750(0.704-0.795)0.860(0.824-0.896)0.849(0.812-0.886)0.736(0.647-0.825)0.849(0.777-0.921)0.830(0.752-0.908)0.715(0.640-0.791)0.843(0.782-0.904)0.837(0.774-0.899)P value^^** < 0.003**^a^0.228^b^** < 0.003**^c^0.024^a^0.711^b^0.138^c^** < 0.003**^a^0.738^b^0.003^c^Data in bold indicates P < 0.05NCI_EPE* National Cancer Institute extraprostatic extension, AUC Areas under the curve, CI Confidence interval, PPV Positive predictive value, NPV Negative predictive value^*^the P values were adjusted using the Bonferroni correction^a^The differences in AUC between NCI_EPE grade and logistic model^b^The differences in AUC between logistic model and Scoring system^c^The differences in AUC between NCI_EPE grade and Scoring system
The scoring system achieved recall rates of 0.843 (140/166), 0.773 (34/44), and 0.818 (54/66) in the derivation cohort, validation cohort 1, and validation cohort 2, respectively. Precision were 0.690 (140/203), 0.694 (34/49), and 0.711 (54/76) across these cohorts, indicating a minimal likelihood of false-negative results (Fig. 1, g-i). DCA further demonstrated that the scoring system provided net clinical benefits equivalent to the logistic model in both validation cohorts, with both tools outperforming the NCI_EPE across a wide probability threshold range (Fig. 2).Fig. 2. The decision curve analysis among the NCI_EPE, logistic model and scoring system in the validation cohort 1 and validation cohort 2. NCI_EPE: National Cancer Institute extraprostatic extension
Risk stratification
The scoring system stratified patients into four risk tiers based on total scores, corresponding to escalating incidences of pT3: low (0–3 points), intermediate-low (4–6 points), intermediate-high (7–9 points), and high risk (10–12 points). The mean prediction probabilities for these tiers were 9.9%, 26.0%, 52.0%, and 85.0%, respectively, closely matching the observed pT3 incidences across all cohorts (Table 5). Table 5. Estimated and observed risks for pT3 according to the scoring systemRisk Group(Total Points)Total (N)^^Estimated risk for pT3Observed risk for pT3Derivation cohortValidation cohort 1Validation cohort 2Low Risk 0–32119.9%6.3% (8/126)9.4% (3/32)9.4% (5/53)Intermediate-low Risk 4–612826.0%25.0% (18/72)28.0% (7/25)22.6% (7/31)Intermediate-high Risk 7–917252.0%60.6% (66/109)54.2% (13/24)59.0% (23/39)High Risk 10–1215685.0%78.7% (74/94)84.0% (21/25)83.8% (31/37)EPE Extraprostatic extension^^Values are the median of the estimated risk for each group
Among 266 cases classified as NCI_EPE grade 2 across all cohorts, the scoring system upgraded 181 cases to higher-risk categories, of which 115 were pathologically confirmed as pT3. Conversely, 85 non-upgraded cases included 65 pT2 instances (Supplementary Table S3). This reclassification demonstrated significant risk stratification beyond the NCI_EPE (P < 0.001), effectively distinguishing occult high-risk lesions (Figs. 3 and 4).Fig. 3. The patient was a 69-year-old male. The A-C images consisted of T2-weighted imaging, diffusion weighted imaging, and apparent diffusion coefficient maps, respectively, with the tumor indicated by the yellow arrow. The D image represented a T2WI image with focal labeling processing, where the curvilinear contact length (CCL) was highlighted by the dashed line. Clinical, radiological and pathological data were as follows: PSA 12.55, PSAD 0.33, CCL 18.5, CCL/LD 1.04, NCI_EPE grade 2, IUSP 2. According to the scoring system, the final value was 5 points, which was divided into intermediate-low tier, and the final pathological result was pT2Fig. 4The patient was a 69-year-old male. The A-C images consisted of T2-weighted imaging, diffusion weighted imaging, and apparent diffusion coefficient maps, respectively, with the tumor indicated by the yellow arrow. The D image represented a T2WI image with focal labeling processing, where the curvilinear contact length (CCL) was highlighted by the dashed line. Clinical, radiological and pathological data were as follows: PSA 29.53, PSAD 0.91, CCL 28.2, CCL/LD 1.48, NCI_EPE grade 2, ISUP_GG 4. According to the scoring system, the final value was 7 points, which was divided into intermediate-high tier, and the final pathological result was pT3
Based on the risk stratification of scoring system, pT3 incidences across subgroups were shown in Fig. 5. Patients were categorized as low-risk (≤ 6 points) or high-risk (≥ 7 points). For low-risk patients considered for NSRP, undertreatment percentages were 13.1% (26/198), 17.5% (10/57), and 14.3% (12/84) in the derivation cohort and validation cohorts, respectively. Conversely, overtreatment percentages in high-risk patients were 31.0% (63/203), 30.6% (15/49), and 28.9% (22/76).Fig. 5. The incidence of EPE in the four risk prediction subgroups for the derivation cohort, validation cohort 1 and validation cohort 2
Discussion
Accurate preoperative assessment of EPE is critical for evaluating PCa invasiveness and guiding optimal surgical strategies. In this study, we developed a multimodal scoring system integrating four key predictors: NCI_EPE grade, PSAD, CCL/LD, and ISUP grade—collectively capturing clinical, radiological, and pathological characteristics. The scoring system demonstrated superior predictive performance across all cohorts, achieving AUCs of 0.830–0.849 compared to the NCI_EPE (AUC: 0.715–0.750). Notably, it improved specificity and PPV, significantly reducing false-positive rates that could lead to overtreatment. Moreover, the scoring system stratified patients into four distinct risk tiers—low, intermediate-low, intermediate-high, and high—demonstrating robust discriminatory capacity between subgroups and a strong positive correlation between total scores and EPE incidence. This reliable and user-friendly scoring system holds promise for precise clinical diagnosis and treatment for personalized PCa management.
While scoring systems in other fields have been extensively explored [22–25], our study firstly introduced a novel clinical-radiological-pathological scoring system for preoperative prediction of EPE in PCa. Unlike prior models, this scoring system uniquely incorporated the NCI_EPE—a standardized MRI-based grading system for extracapsular involvement—as a foundational element, synergizing it with clinicopathological variables (PSAD, ISUP, and CCL/LD) to enhance preoperative risk stratification. Recently, the NCI_EPE grade has become as a widely recognized tool with significant clinical applicability in predicting EPE [10]. The NCI_EPE grade have demonstrated moderate diagnostic performance in prior studies, with AUC values ranging from 0.70 to 0.85. However, its clinical utility is constrained by the interobserver variability in interpreting subtle MRI features (e.g., capsular irregularity or bulge vs. definitive EPE), and the heterogeneous imaging manifestations of EPE, which often lack clear anatomical demarcation. These factors contribute to inconsistent diagnostic accuracy, particularly in equivocal cases where microscopic invasion eludes radiographic detection [26–28]. The NCI_EPE demonstrated limited predictive accuracy in our cohorts, with AUCs of 0.750 (derivation), 0.736 (validation cohort 1), and 0.715 (validation cohort 2). Despite this, we assigned NCI_EPE grade ≥ 2 a score of 2 points within the multimodal scoring system to retain its contributory value.
The CCL/LD, another radiological variable introduced in this study, refined the established role of CCL as an independent predictor of EPE. While prior reports extensively confirmed the predictive value of CCL in EPE [29, 30], our ratio normalized CCL by LD, effectively controlling for tumor size-related confounding. This standardization accounted for the inherent correlation between larger lesions and increased CCL, reducing overestimation of EPE risk in volumetrically dominant tumors lacking true invasiveness. CCL/LD could enhance the diagnostic specificity, particularly in lesions where absolute CCL may misleadingly suggest EPE. In our scoring system, CCL/LD was ultimately assigned 2 points. Furthermore, analysis of patients with NCI_EPE grade 2 revealed that non-radiological variables (e.g., PSAD, ISUP) significantly enhanced risk stratification, underscoring the necessity of integrating clinical and pathological variables to predict EPE.
PSAD serves as a biomarker of tumor aggressiveness in PCa. Multivariate analysis confirmed PSAD as an independent predictor of EPE (OR = 3.528; P < 0.001), with supplementary diagnostic value in MRI-negative or equivocal cases where conventional imaging criteria proved indeterminate. Our cohort-derived PSAD threshold of 0.20 ng/ml/cm^3^ demonstrated optimal performance in high-risk scenarios. This aligned with the previous studies advocating integration of PSAD into multiparametric prediction tools (e.g., MSKCC nomogram) to offset single-marker limitations and improve risk stratification accuracy [6, 31]. Consistent with this rationale, PSAD was assigned 3 points in our scoring system, reflecting its independent association with EPE. PSAD serves as a biomarker of tumor biological activity, whereas the ISUP grade provides critical histopathological stratification of PCa aggressiveness. The ISUP directly correlates with tumor malignancy, strongly linked to pathological hallmarks including stromal destruction, perineural invasion, and EPE. Established evidence indicated EPE incidence approaches 40–60% in patients with ISUP grades 4–5 [32], solidifying its role as a foundational parameter for preoperative risk stratification. Reflecting this prognostic significance, our scoring system assigned ISUP the highest weight (5 points; β = 2.183, P < 0.001) among all variables, underscoring its dominant association with EPE risk. Considering these findings, all four independent risk factors ultimately incorporated into our study have been corroborated by various investigations, further affirming the reliability and comprehensiveness of the scoring system.
The proposed scoring system was directly derived from the logistic model. ROC curve analysis confirmed strong concordance between the scoring system and logistic model in EPE prediction, with excellent calibration across all derivation and validation cohorts. Importantly, the scoring system maintains diagnostic accuracy while offering enhanced clinical practicality: physicians could straightforward estimate the probability of EPE by summing variable-specific points from four routinely available parameters (NCI_EPE, PSAD, ISUP, and CCL/LD), avoiding the computational complexity of the logistic model. Furthermore, the scoring system also demonstrated resilience to institutional differences in MRI protocols or patient demographics (AUC: 0.830 and 0.837 [validation cohort 1 and 2] vs 0.849 [derivation cohort], P > 0.05), with comparable performance observed in all cohorts. The final risk prediction stratification of the scoring system is also essential. The scoring system categorizes patients into four distinct risk tiers: low risk (0–3 points), intermediate-low risk (4–6), intermediate-high risk (7–9) and high risk (10–12). The mean prediction probabilities for these four tiers were closely matching the observed pT3 incidences across all cohorts. By translating complex regression outputs into ordinal risk categories, this scoring system simplifies preoperative counseling: high-risk patients (≥ 7 points) may warrant wide-margin resection to minimize residual disease, whereas low-risk cases (≤ 6 points) remain eligible for NSRP approaches to preserve functional outcomes. Such stratification standardizes EPE risk communication facilitates accurate pre-operative evaluation of EPE thereby promoting individualized and precise diagnosis and treatment for PCa patients.
Our multimodal scoring system exclusively utilized MRI data, potentially overlooking the complementary value from other imaging modalities. Notably, substantial evidence associated TRUS-detected hypoechoic lesions with the detection of clinically significant PCa (csPCa) [33]. Recent study further indicated that hypoechoic lesions with microcalcifications enhanceed csPCa identification, where microcalcifications correlate with higher-grade disease. Additionally, several studies had shown that cribriform morphology in PCa was predictive of poor prognosis [34]. TRUS outperforms MRI in microcalcification visualization and offers superior accuracy and convenience for 3D volumetric measurements. Given these advantages, TRUS-derived features may improve the EPE prediction. Future research should evaluate whether incorporating TRUS data could improve predictive accuracy.
This study is subject to certain limitations. One aspect, it was a retrospective design, which may introduce inherent selection bias. The uneven distribution of the derivation and validation cohorts across three risk subgroups may potentially introduce bias and limits causal inference, thus it is recommended to develop and validate the scoring system using prospective multicenter validation to confirm generalizability across diverse populations and imaging protocols. On the other hand, it is important to acknowledged that certain scoring factors included in current scoring system rely on the subjective predictions, leading to potential variations among different readers. To address this issue, future researches could explore the integration of AI-driven standardization of imaging parameters (e.g., automated PV measurement, NCI_EPE evaluation or CCL/LD quantification) to minimize observer-dependent variability.
Conclusion
In summary, this study advanced preoperative EPE risk assessment by integrating clinical, radiological, and pathological variables into a multimodal scoring system. The tool significantly outperformed the NCI_EPE grade while stratifying patients into four distinct risk tiers (low, intermediate-low, intermediate-high, high), enabling personalized treatment decisions through risk-adapted surgical planning.
Supplementary Information
Supplementary Material 1
The reference list from the paper itself. Each links out to its DOI / PubMed record.
- 1Simon BD, Merriman KM, Harmon SA et al. Automated detection and grading of extraprostatic extension of prostate cancer at MRI via cascaded deep learning and random forest classification. Acad Radiol. 2024;25:S 1076–6332(24)00220–4. 10.1016/j.acra.2024.04.011.10.1016/j.acra.2024.04.011PMC 1149041138670874 · doi ↗ · pubmed ↗
- 2Moon HW, Kim DH, Kim J, et al. A preoperative scoring system for predicting the extraprostatic extension of prostate cancer following radical prostatectomy using magnetic resonance imaging and clinical factors. 2024;49:2683–92. 10.1007/s 00261-024-04345-1.10.1007/s 00261-024-04345-138755453 · doi ↗ · pubmed ↗
- 3Garcia-Reyes K, Nguyen HG, Zagoria RJ et al. Impact of lesion visibility on transrectal ultrasound on the prediction of clinically significant prostate cancer (Gleason Score 3 + 4 or Greater) with transrectal ultrasound-magnetic resonance imaging fusion biopsy. J Urol. 2108;199:699–705. 10.1016/j.juro.2017.09.075.10.1016/j.juro.2017.09.07528941918 · doi ↗ · pubmed ↗