FGA, a new target of histone acetylation, inhibits apoptosis of granulosa cells in follicles
Yongcai Chen, Ming Fang, Wenmiao Duan, Tiantian Yang, Haidan Fan, Meng Lv, Liuhong Zhang, Yao Jiang, Shuo Li, Nian Li, Jiaqi Li, Xiaolong Yuan

TL;DR
FGA, a protein involved in histone acetylation, helps protect granulosa cells from apoptosis and supports follicular development in mammals.
Contribution
FGA is identified as a novel target of histone acetylation in regulating granulosa cell survival and follicular development.
Findings
FGA promotes granulosa cell proliferation and cycle progression by upregulating PCNA and CCNE1.
FGA inhibits apoptosis by suppressing Caspase3 and Caspase9 expression in granulosa cells.
Knockdown of HDAC2 reduces FGA transcription and chromatin accessibility at its promoter.
Abstract
Granulosa cells (GCs) are the main supporting cells for follicles, and histone acetylation has been reported to regulate follicular development. However, the mechanism of histone acetylation regulating follicular development is still unclear in GCs. In this study, we found that FGA, fibrinogen alpha chain, mediated the survival and fate of GCs. Knockdowns of HDAC1 and HDAC3 significantly inhibited the mRNA level of FGA, while knockdown of HDAC2 notably decreased the protein level of FGA. Moreover, knockdown of HDAC2 repressed the chromatin accessibility and the enrichment level of H3K9ac at -1350/-1454 bp of FGA. In addition, FGA promoted GCs proliferation and cycle progression by up-regulating the expressions of PCNA and CCNE1, whereas it inhibited apoptosis by suppressing the expression of Caspase3. In vitro, FGA was likely to promote follicular development of pigs. In mice, FGA…
Genes, proteins, chemicals, diseases, species, mutations and cell lines named across the full text — each resolved to its canonical identifier and authoritative record.
Click any figure to enlarge with its caption.
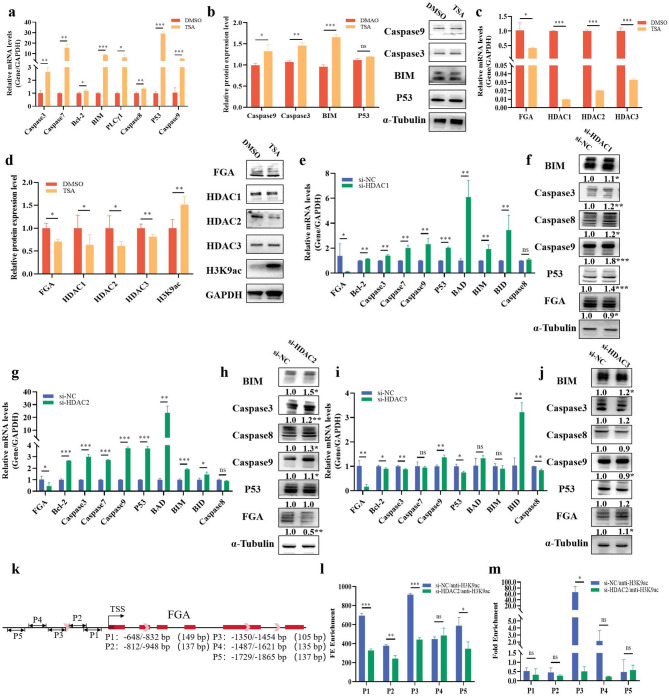 Figure 1
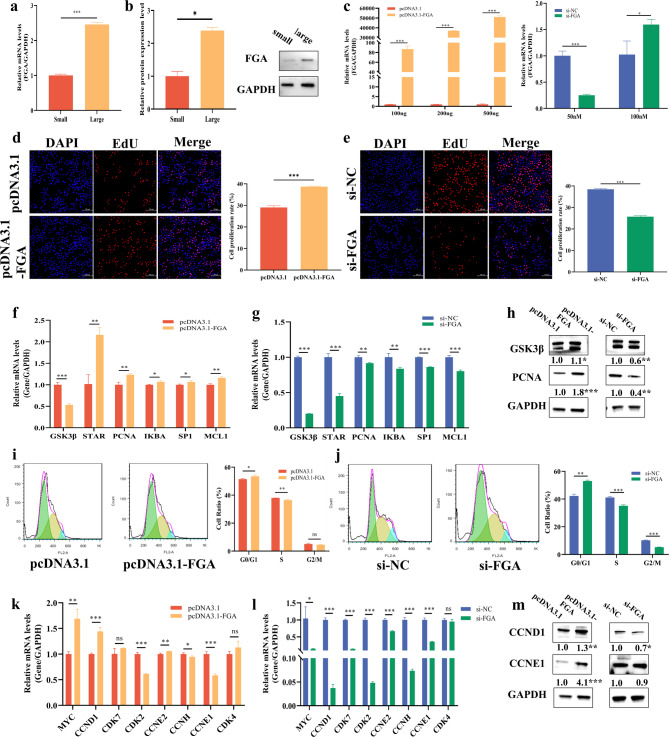 Figure 2
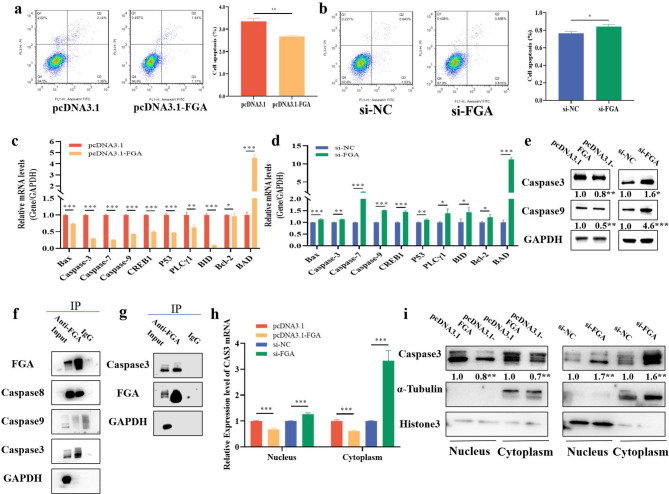 Figure 3
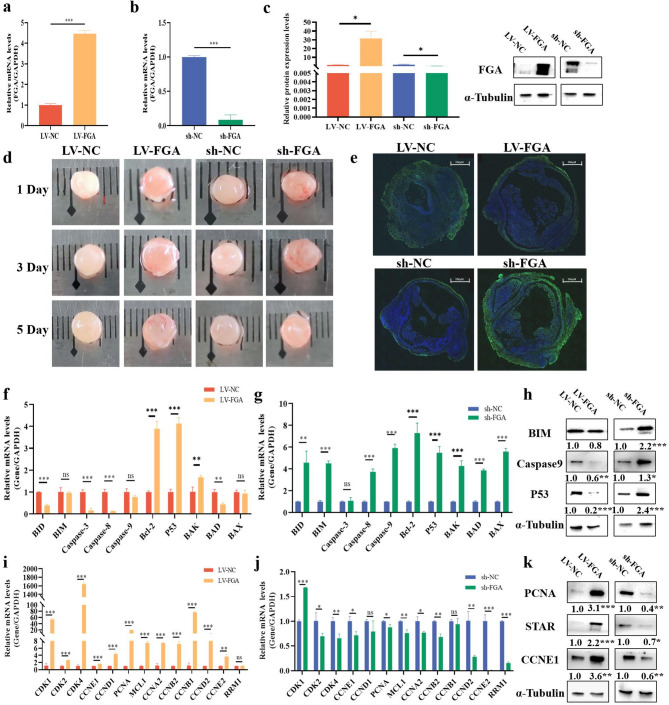 Figure 4
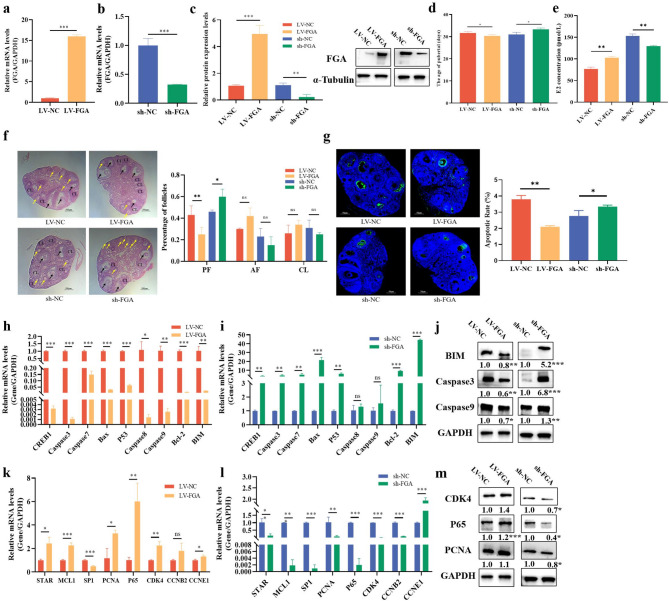 Figure 5
- —Science and Technology Program of Guangzhou
- —Guangdong Basic and Applied Basic Research Foundation
- —http://dx.doi.org/10.13039/501100010038Earmarked Fund for China Agriculture Research System
- —Modern Agricultural Industrial Technology System lnnovation Team of Guangdong Province
- —National Center of Technology Innovation for Pigs
- —Breed Industry Innovation Park of Guangdong Xiaoerhua Pig
- —Science and Technology Program of Guangdong province, China
Peer Reviews
No public reviews on file for this paper yet. If you reviewed it on a platform where reviews are public (OpenReview, ICLR, NeurIPS, ICML), you can paste yours below so the community can read it here.
Videos
No videos yet. Explain this paper in a talk, walkthrough, or lecture? Add one.
Taxonomy
TopicsReproductive Biology and Fertility · Ovarian function and disorders · Kruppel-like factors research
Introduction
Granulosa cells (GCs), playing an important role in follicular development, is essential for follicular growth and maintenance [1]. It has been reported that the developmental status of GCs promotes follicular activation and subsequently impacts sexual maturation in mice [2]. Excessive apoptosis of GCs in mammalian follicles results in disrupted follicular maturation and ovulatory dysfunction [3]. Previous study has showed that SMAD4 activates the transcription of CYP19A1 to suppress GCs apoptosis and follicular atresia in pigs [4]. E2 regulates relative mRNA abundance of ERβ isoforms in human GCs, altering ERβ protein levels to promote GCs apoptosis and follicular atresia [5]. Moreover, histone deacetylases have been reported to mediate follicular development by regulating gene expression. Knockdown of HDAC1 inhibits the transcription of SFFD, leading to the apoptosis of GCs, which in turn impairs follicular development and delays sexual maturation in pigs [6]. Trichostatin A (TSA), a histone deacetylase inhibitor, that attenuates NLRP3 to induce follicular damage by downregulating HDAC1 and HDAC2 [7], and then promotes ovulation by upregulating the expression of FSHβ in mice [8]. Although the above studies suggest that histone deacetylases play an important role in follicular development, the specific mechanisms by which they regulate GCs apoptosis remain to be further explored.
Fibrinogen is a key protein in coagulation mechanisms that regulates cell-matrix interactions vascular adhesion [9], as well as the proliferation of GCs during follicular remodeling [10]. It has been widely reported that fibrinogen is useful in the construction of artificial ovaries [11], with inhibiting apoptosis of GCs and promoting follicular angiogenesis in mouse [12]. Through its interaction with hyaluronic acid and tissue-type plasminogen activator, fibrinogen indirectly regulates ovulation [13]. These findings indicate that fibrinogen is closely associated with GCs growth, which is critical for follicular development and sexual maturation. Fibrinogen alpha chain (FGA) is one of the three polypeptide chains (alpha, beta and gamma) [14] that composes fibrinogen, and it has a variety of cellular and physiological functions [15]. Studies on FGA and GCs are limited, and the underlying mechanisms that FGA promotes follicular development and sexual maturation has not been clarified.
In this study, we found that TSA significantly inhibited FGA and apoptosis genes like Caspase3 and Caspase9. Next, we explored how histone acetylation regulated FGA transcription and how FGA mediated the apoptosis of GCs to influence follicular development and sexual maturation. These works may provide new insights into the mechanisms of follicular development and mammalian sexual maturation.
Materials and methods
Cell culture
The human ovarian GCs (KGN) (hereinafter referred to as the “GCs”) used in this study were purchased from Wuhan Pricella Biotechnology Co., Ltd. GCs were cultured with Dulbecco’s modified Eagle’s medium (DMEM, Hyclone, Logan, UT, USA) with 10% FBS (Hyclone, Logan, UT, USA) and incubated at 37 ℃ under 5% CO_2_.
Transient transfection
Transfection was performed when the GCs at high confluence (> 80%). GCs were transfected with transient transfections of plasmids and oligonucleotides using Lipofectamine™ 3000 Reagent (Thermo Scientific, Waltham, USA), when the cell confluence reaches 70–80%. The oligonucleotides were synthesized by Guangzhou Ruibo (Guangzhou, China) and the sequences are shown in Table 1. The RT-qPCR, Western Blot, EdU and flow cytometry assays were performed at 48 h after cell transfection.
Table 1. List of oligonucleotides used in this studyNameSequences(5’-3’)si-HDAC1AGGCGGTGGTTACACCATTsi-HDAC2AACCGACAACAGACTGATAsi-HDAC3GTGGTTATACTGTCCGAAAsi-FGAGCTGCAGGATGAAAGGGTT
Animal experiment
Three-week-old C57BL/6 J mice (26 females) from the Laboratory Animal Center of Southern Medical University (Guangzhou, China) were assigned to 4 groups: LV-NC (n = 5), LV-FGA (n = 8), sh-NC (n = 5), and sh-FGA (n = 8) group, randomly. The mice were acclimatized and fed for one week at the Laboratory Animal Center of South China Agricultural University, and were injected with the lentivirus of FGA by intraperitoneal injection once a week for three weeks, weighed daily and observed for estrus and recorded. The lentivirus was purchased from Guangzhou Dongze (Guangzhou, China). The mice were euthanized at 42 days of age.
Isolation and culture of porcine follicles
Porcine ovarian tissues collected from a slaughterhouse in Guangzhou were preserved in pre-cooled PBS (containing 1% penicillin-streptomycin) and quickly brought back to the laboratory, washed with PBS until the liquid was clear and free of blood and water, and then transferred to the sterile laboratory, where follicles of 3–5 mm were isolated (excess connective tissue was removed) under the ultra-clean table, washed twice with DMEM/F12 (Biosharp, Beijing, China) medium. 16 follicles were divided into four groups: LV-FGA (n = 4), LV-NC (n = 4), sh-NC (n = 4), and sh-FGA (n = 4). Each follicle was individually placed into a well of the 24-well plates containing follicle culture medium and incubated at 38.5 °C with 5% CO_2_ for culture. After 24 h, lentiviral treatment of the follicles were performed and photographed for observation on days 1, 3 and 5, respectively.
Reverse transcription-quantitative PCR
Total RNA from tissues and cells was extracted following the instructions provided in the RNAfast200 Total RNA Extraction Kit manual (Feijie, Shanghai, China). The purity and integrity of total RNA were detected using UV spectrophotometer (Thermo Fisher Scientific, Waltham, MA, USA). And the extracted RNA was reversely transcribed into cDNA with the PrimeScript RT master MIX (TaKaRa, Tokyo, Japan). Hieff^®^ qPCR SYBR Green Master Mix (2×) (YEASEN, Shanghai, China) and CFX96 Touch Real-Time PCR system (Bio-Rad, Berkeley, CA, USA) was used to quantify the relative expression levels of gene mRNAs. Using the mRNA expression level of GAPDH as internal reference, the relative expression levels of genes were calculated with the 2^−ΔΔCΤ^ method. All primers for RT-qPCR are listed in Tables 2, 3 and 4.
Table 2. Primers used for qPCR in humansGene namePrimer sequences (5’-3’)Product size (bp)FGAF: TAGCTGAATTCCCTTCCCGTGR: CTTCCCCAAAGGAGAAGTGTGG218 bpHDAC1F: GCTCCATCCGTCCAGATAACATR: GCCACAGAACCACCAGTAGACAA127 bpHDAC2F: TTACCTCATGCACCTGGTGTCCR: GACCTCCTTCTCCTTCATCCTCA175 bpHDAC3F: CGGTGTCCTTCCACAAATACGR: CTGGTCATCAATGCCATCCC125 bpCaspase3F: GGAAGCGAATCAATGGACTCTGGR: GCATCGACATCTGTACCAGACC146 bpCaspase7F: CGGAACAGACAAAGATGCCGAGR: AGGCGGCATTTGTATGGTCCTC143 bpPLCγ1F: CATCACGCACTACCAGCAGGTGR: GACGCGCATTAGCATGTGCTCA151 bpBcl-2F: ATCGCCCTGTGGATGACTGAGTR: GCCAGGAGAAATCAAACAGAGGC127 bpBIMF: CAAGAGTTGCGGCGTATTGGAGR: ACACCAGGCGGACAATGTAACG136 bpCaspase8F: GCTGACTTTCTGCTGGGGATR: GACATCGCTCTCTCAGGCTC112 bpP53F: CCTCAGCATCTTATCCGAGTGGR: TGGATGGTGGTACAGTCAGAGC128 bpCaspase9F: GTTTGAGGACCTTCGACCAGCTR: CAACGTACCAGGAGCCACTCTT129 bpBADF: CCAACCTCTGGGCAGCACAGCR: TTTGCCGCATCTGCGTTGCTGT126 bpBIDF: TGGGACACTGTGAACCAGGAGTR: GAGGAAGCCAAACACCAGTAGG125 bpBAXF: TCAGGATGCGTCCACCAAGAAGR: TGTGTCCACGGCGGCAATCATC103 bpCREB1F: GACCACTGATGGACAGCAGATCR: GAGGATGCCATAACAACTCCAGG135 bpGSK3βF: CCGACTAACACCACTGGAAGCTR: AGGATGGTAGCCAGAGGTGGAT150 bpSTARF: TACGTGGCTACTCAGCATCGACR: TCAACACCTGGCTTCAGAGGCA142 bpPCNAF: CAAGTAATGTCGATAAAGAGGAGGR: GTGTCACCGTTGAAGAGAGTGG126 bpIKBAF: TCCACTCCATCCTGAAGGCTACR: CAAGGACACCAAAAGCTCCACG101 bpSP1F: ACGCTTCACACGTTCGGATGAGR: TGACAGGTGGTCACTCCTCATG112 bpMCL1F: CCAAGAAAGCTGCATCGAACCATR: CAGCACATTCCTGATGCCACCT151 bpMYCF: CCTGGTGCTCCATGAGGAGACR: CAGACTCTGACCTTTTGCCAGG128 bpCCND1F: TCTACACCGACAACTCCATCCGR: TCTGGCATTTTGGAGAGGAAGTG133 bpCDK7F: GCACACCAACTGAGGAACAGTGR: AAGTCGTCTCCTGCTGCACTGA115 bpCDK2F: ATGGATGCCTCTGCTCTCACTGR: CCCGATGAGAATGGCAGAAAGC97 bpCCNE2F: CTTACGTCACTGATGGTGCTTGCR: CTTGGAGAAAGAGATTTAGCCAGG126 bpCCNHF: CGATGTCATTCTGCTGAGCTTGCR: TCTACCAGGTCGTCATCAGTCC128 bpCCNE1F: TGTGTCCTGGATGTTGACTGCCR: CTCTATGTCGCACCACTGATACC123 bpCDK4F: CCATCAGCACAGTTCGTGAGGTR: TCAGTTCGGGATGTGGCACAGA103 bpGAPDHF: ATGGGGAAGGTGAAGGTCGGR: CCTGGAAGATGGTGATGGGATT181 bp
Table 3. Primers used for qPCR in pigsGene namePrimer sequences (5’-3’)Product size (bp)FGAF: AAGAGCGAGGTCCACACAAGR: CACCGCAGTCAGAACCATCT205 bpCaspase3F: GGATTGAGACGGACAGTGGGR: CCGTCCTTTGAATTTCGCCA124 bpCaspase8F: CTCTGCCTACAGGGTCATGCR: AGGATGGCCCTCTTCTCCAT162 bpCaspase9F: AACTTCTGCCATGAGTCGGGR: CTGGCCTTGGCAGTCAGG128 bpP53F: ACGCTTCGAGATGTTCCGAGR: TTTTATGGCGGGAGGGAGAC137 bpBAXF: GACAGGGGCCCTTTTGCTTCR: CCGCCACTCGGAAAAAGACT227 bpBAKF: CTCGTCCACATCAGAGGAGCR: CTAGGTTCTAGGGGCAGGGT147 bpBIMF: GAGCGGCAAGCTTCCATGAGR: AAGAAAACAGCATTACCCTCCTTG130 bpBcl-2F: GGATAACGGAGGCTGGGATGR: CACTTATGGCCCAGATAGGCA150 bpMCL1F: GAAGGCGTTAGAGACCCTGCR: TGCCCCAGTTTGTTACTCCG167 bpBADF: AGTCGCCACTGCTCTTACCCR: TCTTGAAGGAACCCTGGAAATC172 bpPCNAF: GCAGAGCATGGACTCGTCTCR: TTGGACATGCTGGTGAGGTT120 bpCDK1F: AAGTGTGGCCAGAAGTGGAGR: CCAGAAATTCGCTTGGCAGG157 bpCDK2F: TTTGCTGAGATGGTGACCCGR: GCTGAAATCCGCTTGTTGGG254 bpCDK4F: GGCCCTCAAGAGCGTAAGAGR: GTCTCTCGATCAGTTCGGGC165 bpCCNA2F: AACTTCAGCTTGTGGGCACTR: AACGAGGTGCTCCATTCTCA140 bpCCNB1F: AGATCGCAGCAGGAGCTTTTR: CCTCGATTCACCACGACGAT151 bpCCNB2F: AGCCACCCAGGTAGCTAAGAR: GAGAAGGACCCTTTGGAGCC143 bpCCND1F: TTCATTTCCAACCCGCCCTCR: AGAAGGGCTTCGATCTGCTC182 bpCCND2F: AAGAGACCATTCCGCTGACGR: TTCTCATTGGGCTGAGGCAG45 bpCCNE1F: GATGCGAAGGAACCTGACACR: AGGAACAGGGGTTTTCACAGG187 bpCCNE2F: TGACGGTCATCTCCTGGCTAR: CAGCAGCCGCCAGTATTCTA177 bpRRM1F: CTTCAATGCTGGCACCAACCR: TGTTTCCACCCTGATCCACG260 bpGAPDHF: TGAAGGTCGGAGTGAACGGATR: CCATTTGATGTTGGCGGGAT251 bp
Table 4. Primers used for qPCR in miceGene namePrimer sequences (5’-3’)Productsize (bp)FGAF: AAACATTGAGGACCCCAGCTCR: AGTGTCGATACCTCTCGTTGG190 bpCREB1F: CACAGACCACTGATGGACAGCAR: AGGACGCCATAACAACTCCAGG138 bpCaspase7F: CCGTCCACAATGACTGCTCTTGR: CCCGTAAATCAGGTCCTCTTCC131 bpCaspase3F: GGAGTCTGACTGGAAAGCCGAAR: CTTCTGGCAAGCCATCTCCTCA113 bpCaspase8F: CACACTTGGGAGCCAGCGAAAAR: AGCCGTCTCATGCTGGCAGTAT115 bpCaspase9F: GCTGTGTCAAGTTTGCCTACCCR: CCAGAATGCCATCCAAGGTCTC124 bpBAXF: AGGATGCGTCCACCAAGAAGCTR: TCCGTGTCCACGTCAGCAATCA103 bpP53F: TCCTCAAGAGTGATGAAGGTGGCR: ACGGTGGATGTAGTTCTTCCGC110 bpBcl-2F: CCTGTGGATGACTGAGTACCTGR: AGCCAGGAGAAATCAAACAGAGG123 bpBIMF: GGAGATACGGATTGCACAGGAGR: CTCCATACCAGACGGAAGATAAAG156 bpSTARF: GTGCTTCATCCACTGGCTGGAAR: GTCTGCGATAGGACCTGGTTGA113 bpMCL1F: AGCTTCATCGAACCATTAGCAGAAR: CCTTCTAGGTCCTGTACGTGGA125 bpSP1F: CTCCAGACCATTAACCTCAGTGCR: CACCACCAGATCCATGAAGACC133 bpPCNAF: CAAGTGGAGAGCTTGGCAATGGR: GCAAACGTTAGGTGAACAGGCTC112 bpP65F: TCCTGTTCGAGTCTCCATGCAGR: GGTCTCATAGGTCCTTTTGCGC150 bpCDK4F: CATACCTGGACAAAGCACCTCCR: GAATGTTCTCTGGCTTCAGGTCC135 bpCCNB2F: GCACTACCATCCTTCTCAGGTGR: TGTGCTGCATGACTTCCAGGAC137 bpCCNE1F: AAGCCCTCTGACCATTGTGTCCR: CTAAGCAGCCAACATCCAGGAC155 bpGAPDHF: CCGTATCGGACGCCTGGTTA126 bpR: CCGTGGGTAGAGTCATACTGGAAC
EdU cell proliferation assay
The cell proliferation assay was performed by the Cell-LightTM EdU Apollo 567 In Vitro Kit (RiboBio, Guangdong, China). The GCs were treated with 50 µM EdU solution at 37 °C for 2 h, washed twice with PBS, and then fixed with 80% acetone for 30 min. The GCs were washed twice with PBS and permeated with 0.5% Triton X-100 for 10 min, and then incubated with 1× Apollo for 30 min. The GCs were incubated with Hoechst for 30 min. Three independent replicates were set up for each treatment group, and three fields of view from each replicate were randomly selected for observation by inverted Nikon ECLIPSE Ti2 fluorescence microscope (Nikon, Tokyo, Japan). Cell proliferation rate was calculated as the number of EdU-stained cells (red) compared with the number of Hoechst-stained cells (blue).
Flow cytometry assay
The apoptosis rate of cells was detected by Annexin V-FITC Apoptosis Detection Kit (BioVision, Milpitas, CA, USA). The cells were collected and washed twice with PBS, and 500 µL 1× AnnexinV Buffer was added to gently suspend the cells. Subsequently, 5 µL Annexin V-FITC and 5 µL PI staining solution were added to cells, and gently mixed. The cells incubated with Annexin V-FITC and PI staining solution for 15 min in darkness. The cell cycle distribution of GCs was detected by Cell Cycle Detection Kit (KeyGEN, Jiangsu, China). The cells were collected and washed with PBS. 500 µL PI/RNase Staining Buffer was added into each tube of cells sample. Cells were re-suspended slowly and incubated with PI/RNase Staining Buffer for 15 min at 37 °C in darkness. Finally, cell apoptosis rate and cycle distribution were analyzed via flow cytometry (BD, USA) and Flowjo software.
Western blot assay and antibodies
Cells and tissues were lysed using RIPA (Bestbio, Shanghai, China) containing 1% Protease Inhibitors (Biosharp, Beijing, China) to obtain protein samples. The total protein concentration was measured using the BCA Protein Assay Kit (Biosharp, Beijing, China). Protein separation was performed by electrophoresis using Future PAGETM protein precast gels. The separated proteins were transferred to a polyvinylidene fluoride (PVDF) membrane using the eBlot™ L1 membrane converter (GenScript, Nanjing, China). The PVDF membranes were blocked with 5% skim milk powder for 2 h, followed by incubation with the primary antibody solution at 4 °C for 12–16 h. The primary antibodies used were anti-FGA (20645-1-AP, Proteintech, 1:1000), anti-GSK-3β (4198-1-AP, Proteintech, 1:1000), anti-MCL1 (38113, Signalway, 1:1000), anti-PCNA (60097-1-Ig, Proteintech, 1:10,000), anti-STAR (bs-20387R, Bioss, 1:1000), anti-BIM (21280-1, Signalway, 1:1000), anti-CCNE1 (AF4713, Affinity, 1:1000), anti-CCNE1 (AF4713, Affinity, 1:1000), anti-CCND1 (AF0931, Affinity, 1:1000), anti-Caspase3 (AF6311, Affinity, 1:1000), anti-Caspase8 (AF6442, Affinity, 1:1000), anti-Caspase9 (AF6348, Affinity, 1:1000), anti-α-Tubulin (10068-1-Ap, Proteintech, 1:1000), anti-GAPDH (YN5585, Immunoway, 1:5000), anti-P53 (10442-1-AP, Proteintech, 1:1000), anti-CDK4 (DF6102, Affinity, 1:1000) and anti-P65 (10745-1-AP, Proteintech, 1:1000). The horseradish peroxidase-conjugated goat anti-rabbit immunoglobulin G (IgG) (ab205718, abcam, 1:5000) and goat anti-mouse IgG (L3032-1, Signalway, 1:20,000) were used as the secondary antibodies. The PVDF membranes were incubated in the secondary antibody dilution for 1.5–2 h at room temperature. ECL development solution was added dropwise to the PVDF membrane, and on-line development was performed using a fully automated chemiluminescence image analysis system.
HE staining
The number of follicles and corpus lutea were detected by HE Staining (Servicebio, Wuhan, China). The largest cross section cut along the suspensory ligament of the mouse ovary was stained with hematoxylin-eosin, and images were observed and acquired under a Nikon ECLIPSE Ti2 microscope (Nikon, Tokyo, Japan).
Enzyme-linked immunosorbent assay
The concentration of E2 in mouse serum was detected using Mouse E2 ELISA Kit (JM-02849 M2) produced by Jingmei Biotechnology Co (Jiangsu, China). For detailed operation, please refer to the instruction manual of the kit. 100 µL of standards of different concentrations and 100 µL of samples were added into the wells of the ELISA plate. Then 100 µL of horseradish peroxidase-modified detection antibody was added to each well and incubated at 37 ℃ for 1 h. 50 µL of enzyme conjugate working solution and TMB substrate solution were added to each well and incubated at 37℃ for 30 min under light protection. Finally, absorbance at 450 nm was measured using a microplate reader.
Tunel assay
Detection of ovarian follicular apoptosis were uesd by fluorescent Tunel assay (Servicebio, Wuhan, China) on paraffin sections. Mouse ovaries and pig follicles were prepared into paraffin sections. After dehydration, the paraffin sections were repaired with proteinase K (Servicebio, Wuhan, China). The sections were incubated in the dark with Tunel solution for 1 h, processed with anti fluorescein quencher, and observed under a Nikon ECLIPSE Ti2 fluorescence microscope (Nikon, Tokyo, Japan). Image j (NIH, USA) was used for digitization and statistical analysis.
Chromatin Immunoprecipitation
The ChIP assay was performed according to the MIKX Chromatin Immunoprecipitation (ChIP) Kit (MIKX, Shenzhen, China) instructions. Cells were transfected with NC or si-HDAC2, then subjected to cross-linking, chromatin isolation, lysis, and digestion, followed by immunoprecipitation, IP elution, DNA purification, and recovery. Finally, ChIP-qPCR was performed to assess the role of H3K9ac on the transcriptional regulation of the FGA promoter region. Table 5 lists all primers for ChIP-qPCR.
Table 5. Primers used for ChIP-qPCRRegion namePrimer sequences (5’-3’)Product size (bp)FGA-ChIP-P1F: CACCATTCTACACTTTTCTTCCGTG149 bpR: GCATCATTGCACTCCAGCCTFGA-ChIP-P2F: CAGGCTGGAGTGCAATGATGC137 bpR: AATACTGCTTAGCTGGTCGTGGTFGA-ChIP-P3F: TCTTCATAAAAGCATGGGGTAGC105 bpR: TTCCCTGCTCTATGTTCTTGGACFGA-ChIP-P4F: TTTGTTCCTGGGGCTGCTG135 bpR: AGGGTTGGGTGATCTGGCTTAFGA-ChIP-P5F: TACCCTCCTATGCTCCTCTTTTCA137 bpR: GCTCAATTCCCCTCAGCTTGT
Chromatin accessibility
Performed according to the Epigen TEK EpiQuik™Chromatin Accessibility Assay Kit (Epigentek, USA), cells were transfected with NC or si-HDAC2. Subsequently, buffer and solution preparation, cell processing, cell lysis, chromatin extraction, chromatin digestion, DNA purification, RT-qPCR of samples, and data analysis.
Co-immunoprecipitation
Performed according to the instruction manual of ACE rProtein A/G Magnetic IP/Co-IP Kit (ACE, Nanjing, China) for the procedure. We started with cell lysis, followed by magnetic bead rinsing, immunoprecipitation, another round of magnetic bead rinsing, and elution.
Nuclear-cytoplasmic fractionation
Briefly, the cells were washed with PBS and then lysed by adding Lysis Buffer J, followed by incubation on ice for 5 mins. The lysate was transferred to an enzyme-free centrifuge tube and centrifuged for 10 min. The supernatant contained the cytoplasm, and the pellet contained the nucleus, which was stored at -80 °C before subsequent processing.
Statistical analysis
Statistical analysis was performed using GraphPad Prism (GraphPad Software, USA). At least 3 biological replicates were included for each experimental group. The Shapiro-Wilk test was using to determine the normal distribution, and the Student’s t-test was utilized to compare the significant differences between two groups. All data are shown as mean value ± standard deviation (SD). The P value < 0.05 and P value < 0.01 were judged as the statistical significance.
Results
Histone acetylation inhibits FGA to promote apoptosis in GCs
TSA, a histone deacetylase inhibitor, inhibits the activities of HDACs by increasing histone acetylation levels, which in turn regulates gene expression [16]. Previously, we treated GCs with TSA and found that the ACTG1 expression was dose-dependent on the concentration of TSA [17], Based on this, 0.5 µM TSA was chosen for the following experiments in this study. To further explore the specific functions of HDACs in the histone acetylation levels of follicles, GCs were cultured as the cellular model. We found that TSA increased the mRNA and protein levels of cell apoptosis-related genes (e.g., Cysteine aspartate-specific protease family [Caspase3] and [Caspase9], Tumor suppressor protein p53 [P53]) (Fig. 1a, b). TSA promoted the expressions of pro-apoptosis related genes to promote apoptosis of GCs. We then explored whether TSA would alter the level of H3K9ac to inhibit FGA expression. The results showed that TSA significantly inhibited the mRNA expression of FGA and HDAC1/2/3 (Fig. 1c). The same result was observed at the protein level, with a significantly increase in the modification level of H3K9ac (Fig. 1d). We explored whether HDACs have an effect on apoptosis of GCs, and the results showed that both knockdown of HDAC1 (si-HDAC1) (Fig. 1e, f) and HDAC2 (si-HDAC2) (Fig. 1g, h) were significantly more effective than knockdown of HDAC3 (si-HDAC3) (Fig. 1i, j) in promoting apoptosis pathway genes at both mRNA and protein levels. Knockdown of HDAC1-3 all notably inhibited the mRNA level of FGA (Fig. 1e, g, i). The protein level of FGA was noticeably inhibited by si-HDAC1 (Fig. 1f) and si-HDAC2 (Fig. 1h), with si-HDAC2 showing the highest inhibition efficiency. In contrast, si-HDAC3 (Fig. 1j) significantly promoted the protein level of FGA. Based on these results, si-HDAC2 was selected for the following experiments. To explore the HDAC2-mediated-mechanism for the transcriptions of FGA, the H3K9ac level of FGA promoter, including P1 (-648 to -832 bp), P2 (-812 to -984 bp), P3 (-1350 to -1454 bp), P4 (-1487 to -1621 bp) and P5 (-1729 to -1865 bp) (Fig. 1k), were detected after the treatment of si-HDAC2 in cells. Previous study has shown that H3K9ac regulates gene expression by affecting promoter transcription [18]. The results showed that H3K9ac reduced chromatin accessibility in the P1, P2, P3, and P5 promoter regions of FGA (Fig. 1l), along with a significant decrease in H3K9ac enrichment in the P3 region (Fig. 1m). These results suggested that TSA repressed the expression of FGA through si-HDAC2-mediated H3K9ac levels and chromatin accessibility in the − 1350/-1454 bp region.
Fig. 1. Histone acetylation inhibits FGA to promote apoptosis in GCs. Changes in mRNA (a) and protein levels (b) in apoptosis signaling pathways after TSA treatment. Changes in mRNA (c) and protein (d) levels of FGA, HDACs, and H3K9ac after TSA treatment. The changes in mRNA and protein levels of apoptosis pathway genes and FGA after si-HDAC1 (e, f), si-HDAC2 (g, h) or si-HDAC3 (i, j) treatment. segmentation design of FGA promoter region (k). The level of accessibility modification (l) and enrichment (m) of H3K9ac on FGA promoter (P1, P2, P3, P4 and P5) in cells treated with si-HDAC2 was detected by chromosome accessibility and ChIP-qPCR. In all panels, the statistical significance of differences between means were assessed using Student’s t-test (* P < 0.05; ** P < 0.01; ns, no significant difference)
FGA promotes GCs proliferation by accelerating cell cycle progression
We found that the expression of FGA increased with the expansion of follicular size (Fig. 2a, b) during the follicular growth. To further explore the specific functions of FGA in the proliferation of follicles, we constructed the overexpression vector and small interfering RNA of FGA (si-FGA) (Fig. 2c). The overexpression of FGA significantly promoted the proliferation of GCs (Fig. 2d), while the si-FGA significantly inhibited the proliferation of GCs (Fig. 2e). The overexpression of FGA significantly increased the mRNA expression of cell proliferation related genes (e.g., Steroidogenic Acute Regulatory Protein [STAR], Proliferating Cell Nuclear Antigen [PCNA], and Specificity Protein 1 [SP1]) (Fig. 2f), while si-FGA showed opposite results (Fig. 2g). We also found that the overexpression of FGA increased the protein levels of GSK3β and PCNA, but si-FGA showed opposite effects (Fig. 2h). Meanwhile, we observed a significant increase in the number of GCs in the G0/G1-phase and a significant decrease in the number of GCs in the S-phase after overexpression of FGA (Fig. 2i). Conversely, si-FGA significantly inhibited the number of GCs entering the S-phases and G2/M-phases (Fig. 2j). The overexpression of FGA significantly increased the mRNA expression of cell cycle-related genes (e.g., Myelocytomatosis [MYC], G1/S-Specific Cyclin-D1 [CCND1]) (Fig. 2k), while si-FGA showed opposite effects (Fig. 2l). We also found that the overexpression of FGA increased the protein levels of CCND1 and CCNE1, but si-FGA showed opposite results (Fig. 2m). Based on the above results, we concluded that FGA promoted GCs proliferation by accelerating cell cycle progression.
Fig. 2FGA promotes proliferation of ovarian GCs by accelerating cell cycle progression. The mRNA (a) and protein (b) levels of FGA in small (< 3 mm) and large (> 5 mm) follicles. The overexpression and interference efficiency of FGA (c). The effects of overexpression of FGA (d) and si-FGA (e) on the proliferation of cells. The effects of overexpression of FGA (f) and si-FGA (g) on the mRNA levels of genes related to cell proliferation. The effects of overexpression of FGA and si-FGA on the protein levels of genes related to cell proliferation (h). The effects of overexpression of FGA (d) and si-FGA (e) on the cell cycle. The effects of overexpression of FGA (k) and si-FGA (l) on the mRNA levels of genes related to cell cycle. The effects of overexpression of FGA and si-FGA on the protein levels of genes related to cell cycle (m). In all panels, the statistical significance of differences between means were assessed using Student’s t-test (* P < 0.05; ** P < 0.01; ns, no significant difference)
FGA inhibits GCs apoptosis by suppressing expression of Caspase3
We next investigated the effects of FGA on the apoptosis to further determine whether FGA inhibited apoptosis in GCs. The apoptosis rate of GCs was significantly decreased by overexpression of FGA treatment compared to control (Fig. 3a), whereas si-FGA significantly increased the apoptosis rate of GCs (Fig. 3b). The overexpression of FGA significantly decreased the mRNA expression of cell apoptosis genes (e.g., BCL2 Associated X Protein [BAX], Cysteine aspartate-specific protease family, [Caspase7] and [Caspase9], P53) (Fig. 3c), while si-FGA showed opposite effects (Fig. 3d). We also found that the overexpression of FGA decreased the protein levels of Caspase3 and Caspase9, and si-FGA showed opposite effects (Fig. 3e). According to the findings of TSA inhibited the expression of FGA and apoptosis-related genes (Fig. 1), we tested whether FGA inhibited apoptosis by binding to apoptosis-related proteins. Results showed that FGA protein bind to Caspase8, Caspase9, and Caspase3 (Fig. 3f). Subsequently, the reverse validation confirmed that Caspase3 was significantly bound to FGA protein (Fig. 3g). In the nucleoplasmic separation assay, the mRNA and protein levles of Caspase3 were significantly decreased in the nucleus and cytoplasm of GCs after the overexpression of FGA, but si-FGA showed opposite effects (Fig. 3h, i). In summary, FGA inhibited GCs apoptosis by suppressing the expression of pro-apoptotic protein Caspase3.
Fig. 3FGA interacts with Caspase3 to inhibit apoptosis. The effects of overexpression of FGA (a) and si-FGA (b) on the apoptosis of cells. The effects of overexpression of FGA (c) and si-FGA (d) on the mRNA levels of genes related to cell apoptosis. The effects of overexpression of FGA and si-FGA on the protein levels of genes related to cell apoptosis (e). CoIP detected that FGA binds to apoptosis-related proteins (f). CoIP reversed validation of apoptosis-related gene protein binding (g). Caspase3 in the nucleus and cytoplasm at the mRNA (h) and protein level (i). In all panels, the statistical significance of differences between means were assessed using Student’s t-test (* P < 0.05; ** P < 0.01; ns, no significant difference)
FGA promotes the growth of porcine follicles
To investigate whether FGA inhibits the apoptosis of GCs and thus promotes follicular growth, the pigs follicles were permeated with the lentiviral-mediated FGA overexpression (LV-FGA) (Fig. 4a) or lentiviral-mediated FGA knockdown (sh-FGA) (Fig. 4b). LV-FGA promotion and sh-FGA knockdown effects were verified at the protein level (Fig. 4c). Follicles were infected with lentivirus on days 1, 3, and 5 (Fig. 4d). The apoptosis of GCs in follicles was likely decreased by LV-FGA, while sh-FGA subverted appearances (Fig. 4e). Moreover, LV-FGA significantly decreased the mRNA expression of cell apoptosis genes (e.g., BIM, Caspase3, and Caspase9) (Fig. 4f), but significantly elevated in follicles permeated sh-FGA (Fig. 4g). LV-FGA significantly decreased the protein levels of BIM, Caspase9, and P53, while sh-FGA showed opposite effects (Fig. 4h). Besides, LV-FGA significantly increased the mRNA expression of cell proliferation and cycle genes (e.g., CDK1, CDK2, and PCNA) (Fig. 4i), but sh-FGA significantly decreased them in follicles (Fig. 4j). Besides, LV-FGA significantly increased the protein levels of PCNA, STAR and CCNE1, but sh-FGA showed opposite effects (Fig. 4k).
Fig. 4FGA promotes the growth of porcine follicles. Efficiency of lentivirus-mediated FGA overexpression (LV-FGA) (a) or FGA knockdown (sh-FGA) (b) on the mRNA level. LV-FGA and sh-FGA efficiency on the protein levels (c). The effects of LV-FGA and sh-FGA on days 1, 3, 5 of porcine follicles (d). TUNEL staining of LV-FGA and sh-FGA treated follicles was performed to assess the apoptotic rates of GCs (e). The nuclei stained by DAPI were blue and the positive apoptotic nuclei were green. The scale bar was 200 μm. The effects of LV-FGA (f) and sh-FGA (g) on the mRNA levels of genes of cell apoptosis. The effects of LV-FGA and sh-FGA on the protein (h) levels of genes of cell apoptosis. The effects of LV-FGA (i) and and sh-FGA (j) on the mRNA levels of genes of cell proliferation and cycle. The effects of LV-FGA and sh-FGA on the protein levels of genes of cell proliferation and cycle (k). In all panels, the statistical significance of differences between means was assessed using Student’s t-test (* P < 0.05; ** P < 0.01; ns, no significant difference)
FGA promotes the follicular growth in mice
Based on the above results, FGA inhibited apoptosis of GCs and thus promoted follicular development. We next infected lentiviral-mediated LV-FGA and sh-FGA into the ovaries of 3-week-old C57BL/6 mice (Fig. 5a, b,c). The results showed that LV-FGA advanced the day of pubertal initiation, while sh-FGA delayed the day of pubertal initiation of mice (Fig. 5d). Moreover, the level of estradiol (E2) in mice serum was significantly upregulated by LV-FGA, while sh-FGA inhibited the level of E2 in mice serum (Fig. 5e). Compared to the control group, the ovaries of mice with LV-FGA showed fewer pre-antral follicles, but more antral follicles and corpora lutea, while sh-FGA showed opposite effects (Fig. 5f). These results suggested that FGA promoted ovulation of mice. Compared to the control group, LV-FGA significantly decreased the apoptotic rate of GCs in the mice ovaries, and sh-FGA significantly increased the apoptotic rate of GCs in mice ovaries (Fig. 5g). LV-FGA significantly decreased the mRNA expressions of cell apoptosis genes (e.g., BIM, Caspase3, and Caspase9) (Fig. 5h), while sh-FGA showed opposite effects (Fig. 5i). LV-FGA decreased the protein levels of BIM, Caspase3 and Caspase9, and sh-FGA showed opposite effects (Fig. 5j). The LV-FGA significantly increased the mRNA expressions of cell proliferation and cycle genes (e.g., STAR, CDK4, CCNE1, and SP1) (Fig. 5k), while sh-FGA showed opposite effects (Fig. 5l). LV-FGA increased the protein levels of CDK4, P65, and PCNA, but sh-FGA showed opposite effects (Fig. 5m). These results showed that FGA inhibited apoptosis, promoted proliferation and E2 secretion in ovarian GCs, and supported ovarian follicle growth and development, thereby advancing the day of pubertal initiation in mice.
Fig. 5FGA promotes the follicular growth in mice. Efficiency of lentivirus-mediated FGA overexpression (LV-FGA) (a) or FGA knockdown (sh-FGA) (b) on the mRNA level. LV-FGA and sh-FGA efficiency on the protein levels (c). The effects of LV-FGA and sh-FGA on the day of pubertal (d) and E2 (e) levels in mice. The HE (f) and TUNEL staining (g) of mouse ovary treated by LV-FGA and sh-FGA. CL represents corpus luteum, black arrows represent antral follicle and yellow arrows represent pre-antral follicles. The scale bar is 500 μm. The effects of LV-FGA (h) and sh-FGA (i) on the mRNA levels of cell apoptosis. The effects of LV-FGA and sh-FGA on the protein (j) levels of cell apoptosis. The effects of LV-FGA (k) and sh-FGA (l) on the mRNA levels of cell proliferation and cycle. The effects of LV-FGA and sh-FGA on the protein levels of cell proliferation and cycle (m). In all panels, the statistical significance of differences between means was assessed using Student’s t-test (* P < 0.05; ** P < 0.01; ns, no significant difference)
Discussion
Aberrant epigenetic modifications lead to follicular dysfunction, while histone modifications regulate normal gene expressions during follicular development [19]. Histone acetylations, as a common way of histone modifications, have been reported to be involved in follicular development. One previous study reported that histone acetylation regulated the expression of aromatase genes and E2 production in buffalo GCs [16], and sexually mature females showed higher E2 concentrations than sexually immature [20]. How histone acetylation promotes follicular development and sexual maturity is not yet understood. TSA is one of the most widely used histone deacetylase inhibitors [21] and has been reported to increase cellular acetylation levels [22]. Our previous study found that TSA increased the level of H3K4ac to promote TRLA transcription in GCs of pigs [17]. In this study, GCs were treated with TSA (Fig. 1a, b) or si-HDACs (Fig. 1e - j). The results showed apoptotic genes including Caspase3, Caspase9, and P53 were significantly up-regulated at both mRNA and protein levels, which were consistent with previous studies that TSA promoted the apoptosis of GCs in Cervus nippon [23], and HDAC inhibitors promoted cell apoptosis [24]. The protein expression of FGA following si-HDAC3 treatment showed an opposite trend compared to the mRNA levels (Fig. 1i, j), while the protein expression of FGA following si-HDAC1 treatment (Fig. 1e, f) was less significant than that observed with si-HDAC2 (Fig. 1g, h). To explore the mechanism by which HDAC2 inhibited the expression of FGA, we analyzed histone acetylation of FGA promoter, and found that chromatin accessibility was significantly reduced in the − 648/-832 bp and − 1350/1454 bp of the FGA (Fig. 1l), and the level of H3K9ac enrichment at -1350/-1454 bp was significantly suppressed (Fig. 1m). H3K9ac is the marker of transcriptional activation and is regulated by HDAC2 [25]. Si-HDAC2 reverses corticosterone-induced H3K9ac levels of TGFβR1 [26]. However, site-specific mutagenesis and CRISPR-dCas9-based acetylation techniques might provide higher precision for investigating the direct involvement of H3K9ac in FGA promoter regions. For example, a targeted demethylation strategy reduced the methylation level of ZNF154 promoter, consequently upregulating ZNF154 expression [27]. Additionally, it was shown that the point mutation FOXO1 of vectors validated their binding to the CD36 promoter region and STEAP4 promoter region, thereby affecting the transcriptional activity of these genes [28]. Our results suggested that H3K9ac targetd - 1350/-1454 bp region to regulate FGA’s transcription.
FGA is a small molecule of fibrinogen that participates in cell proliferation and apoptosis by regulating cell-matrix interactions [29, 30]. We found that FGA promoted GC proliferation (Fig. 2d, e) and accelerated its cycle (Fig. 2i, j) with corresponding increasing in mRNA and protein levels of PCNA, CCND1, and CCNE1. GCs are essential for follicular development, and abnormal proliferation or apoptosis of GCs leads to ovarian insufficiency [31–33]. Based on the effects of si-HDAC2 on inhibiting FGA and promoting apoptotic genes such as Caspase3 and Caspase9 (Fig. 1g, h), we further investigated the regulatory mechanism of FGA in apoptosis in GCs. Our results showed that FGA inhibited the apoptosis of GCs (Fig. 3a, b) by downregulating the mRNA and protein expressions of Caspase3 and Caspase9. Reduced expression of Caspase3 slows down the decline of ovarian reserve function in mice [34]. Additionally, we discovered that FGA bound to Caspase3 (Fig. 3f, g) to suppress GCs apoptosis, and expression of Caspase3 was inhibited by FGA in both nucleus and cytoplasm (Fig. 3h, i). Overall, FGA inhibit apoptosis in GCs by suppressing Caspase3. Other study has shown that FGA regulates cell migration, apoptosis, and other related biological functions through the activation of the PI3K/Akt signaling pathway by integrin α5β1 [14]. Additionally, inhibition of FGA expression attenuates mitochondrial ROS production and thrombus formation in zebrafish [35].
GCs play an important role in follicular development, and excessive apoptosis delays sexual maturation in mammals [1]. The expression of FGA increased with follicular development (Fig. 2a, b), indicating its involvement in follicular growth. The GCs of small follicles are more proliferative and promote follicular growth, whereas the GCs of large follicles are less proliferative and more functional [36]. As the follicle develops, FGA promotes angiogenesis, estrogen production and other related functions. Lentivirus was used to overexpress or knockdown the FGA in porcine follicles. In the porcine follicular tissue of FGA knockdown lentivirus interference, the mRNA levels of Bcl-2, P53 and BAK did not show a decrease. This may be due to tissue-specific [37] interference with the lentiviral system, resulting in certain genes not being affected by the knockdown effect. In future experimental designs, the use of a CRISPR-dCas9 system may help mitigate this phenomenon more effectively. In mice, FGA increased the number of antral follicles and corpus lutea (Fig. 5f) and similarly inhibited the level of apoptosis in GCs (Fig. 5g). The main characteristic of sexual maturation is a sharp increase in estrogen or E2 levels [38]. The ovary promotes the expression of steroid hormone synthase through the hypothalamic-pituitary-gonadal axis, which facilitates E2 production and follicular development of GCs [39]. FGA promoted the day of pubertal initiation (Fig. 5d) in mice and the secretion of E2 (Fig. 5e). These showed that FGA helped to promote sexual maturation in mammals. Meanwhile, changes in mRNA and protein levels of apoptosis and proliferation-related genes in follicles and ovaries also indicated that FGA promoted follicular development. FGA improves fertility by inhibiting apoptosis of GCs and promoting follicular development. In clinical fertility treatment, the regulation of FGA might promote ovulation by improving follicular development and enhancing the quality of oocyte.
Conclusion
Briefly, the si-HDAC2-mediated decrease in H3K9ac levels inhibits FGA’s transcription. Moreover, FGA binds to Caspase3 to inhibit apoptosis in GCs, promote GCs proliferation and enhance E2’s secretion, thereby promoting follicular development and sexual maturation. Overall, our findings suggest that FGA may improve fertility by inhibiting apoptosis of GCs and promoting follicular development, and these results may provide theoretical support for the development of FGA-targeted drugs and related strategies to improve follicular development.
The reference list from the paper itself. Each links out to its DOI / PubMed record.
- 1He M, Zhang T, Yang Y, Wang C. Mechanisms of oocyte maturation and related epigenetic regulation. Front Cell Dev Biol. 2021;9.10.3389/fcell.2021.654028 PMC 802592733842483 · doi ↗ · pubmed ↗
- 2Y Z. M A, R K, K I. Bmf is a possible mediator in histone deacetylase inhibitors FK 228 and CBHA-induced apoptosis. Cell Death Differ. 2006;13.10.1038/sj.cdd.440168615947789 · doi ↗ · pubmed ↗
- 3Lai Q, Du W, Wu J, Wang X, Li X, Qu X et al. H 3K 9ac and HDAC 2 activity are involved in the expression of monocarboxylate transporter 1 in oligodendrocyte. Front Mol Neurosci. 2017;10.10.3389/fnmol.2017.00376 PMC 569444729184483 · doi ↗ · pubmed ↗
- 4Tetramethylpyrazine Protects Endothelial Injury and Antithrombosis via Antioxidant and Antiapoptosis in HUVE Cs. and Zebrafish - Zhang– 2022 - Oxidative Medicine and Cellular Longevity - Wiley Online Library. [cited 2025 Jun 12]. Available from: https://onlinelibrary.wiley.com 10.1155/2022/223236510.1155/2022/2232365 PMC 931399935898617 · doi ↗ · pubmed ↗
- 5Landry T, Shookster D, Huang H. Tissue-Specific approaches reveal diverse metabolic functions of Rho-Kinase 1. Front Endocrinol. 2021;11.10.3389/fendo.2020.622581 PMC 790193233633690 · doi ↗ · pubmed ↗
- 6Kim HJJ, Zagzoog A, Black T, Baccetto SL, Laprairie RB. Chapter Two - Molecular and cellular mechanisms underlying brain region-specific endocannabinoid system modulation by estradiol across the rodent estrus cycle. In: Shukla AK, editor. Prog Mol Biol Transl Sci. Academic Press; 2023:27–45.10.1016/bs.pmbts.2022.06.01036707154 · doi ↗ · pubmed ↗