De novo Genome Assembly and Annotation of 12 Fungi Associated with Fruit Tree Decline Syndrome in ON, Canada
Muhammad Sulman, Evgeny Ilyukhin, Oscar Villanueva, Hai D. T. Nguyen, Shawkat Ali, Walid Ellouze

TL;DR
This paper reports the first genome assemblies of fungi linked to fruit tree decline in Ontario, Canada, offering insights into the causes and potential solutions.
Contribution
The study provides the first publicly available genome assemblies for three fungal species associated with fruit tree decline.
Findings
Genomes of 12 fungi linked to fruit tree decline were sequenced and annotated.
Three ascomycete species genomes are now publicly available for the first time.
High-quality reference genomes for six fungal species were generated.
Abstract
Apple and stone fruit trees are vital components of Ontario’s agricultural landscape. However, since 2016, these trees have been facing alarming mortality rates, exhibiting symptoms collectively referred to as Fruit Tree Decline (FTD) and Rapid Apple Decline (RAD). Despite its widespread occurrence, the exact cause of FTD and RAD remains elusive, with various pathogenic fungi and viruses implicated, along with abiotic stressors such as drought, winter injury and nutrient deficiency. In this study, we sequenced, assembled and annotated the genomes of 12 fungi associated with FTD and RAD syndromes in Ontario, Canada. We present the first and only publicly available assemblies for three ascomycete species including Diplodia intermedia, Diatrype stigma, and Nothophoma quercina. Additionally, we present high-quality reference genome sequences for Diplodia seriata, Didymella pomorum and…
Genes, proteins, chemicals, diseases, species, mutations and cell lines named across the full text — each resolved to its canonical identifier and authoritative record.
Click any figure to enlarge with its caption.
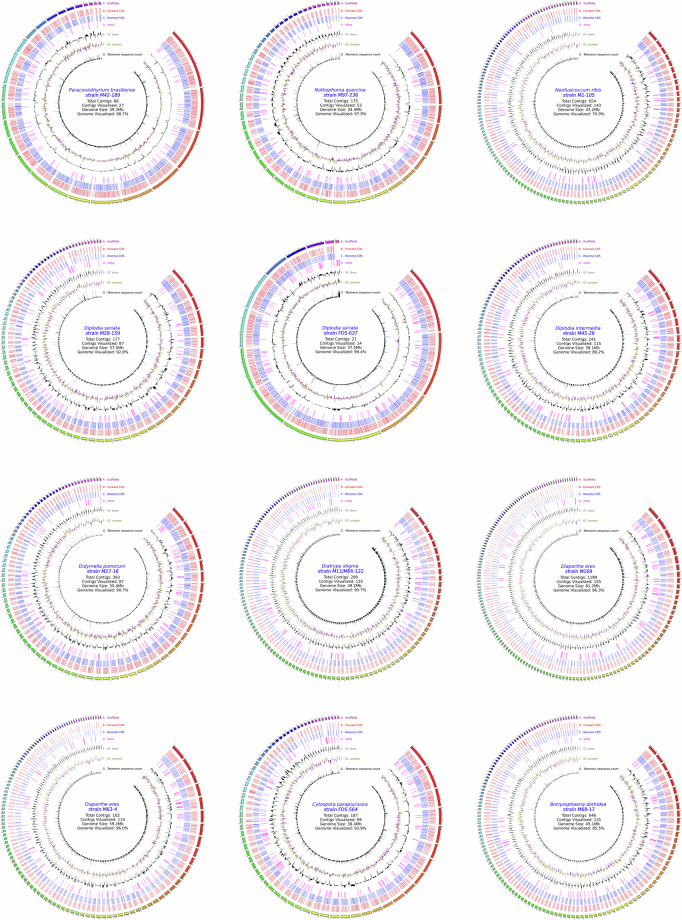 Figure 1
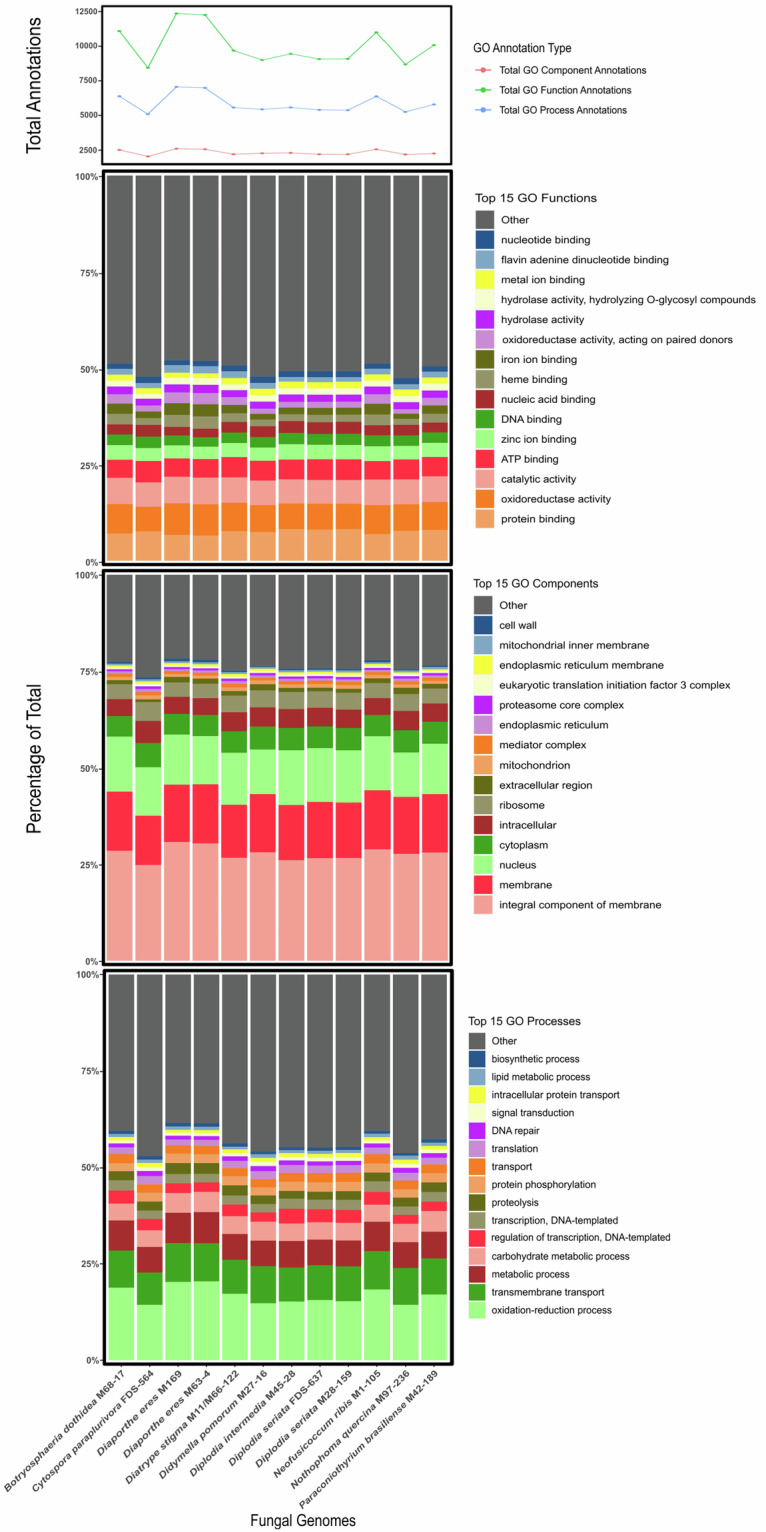 Figure 2
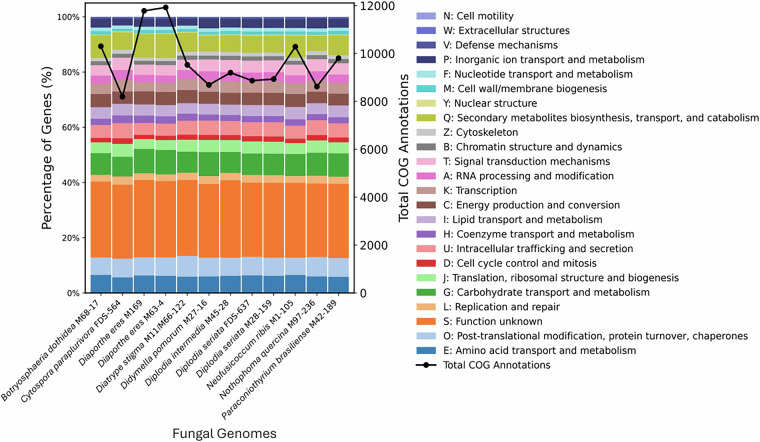 Figure 3
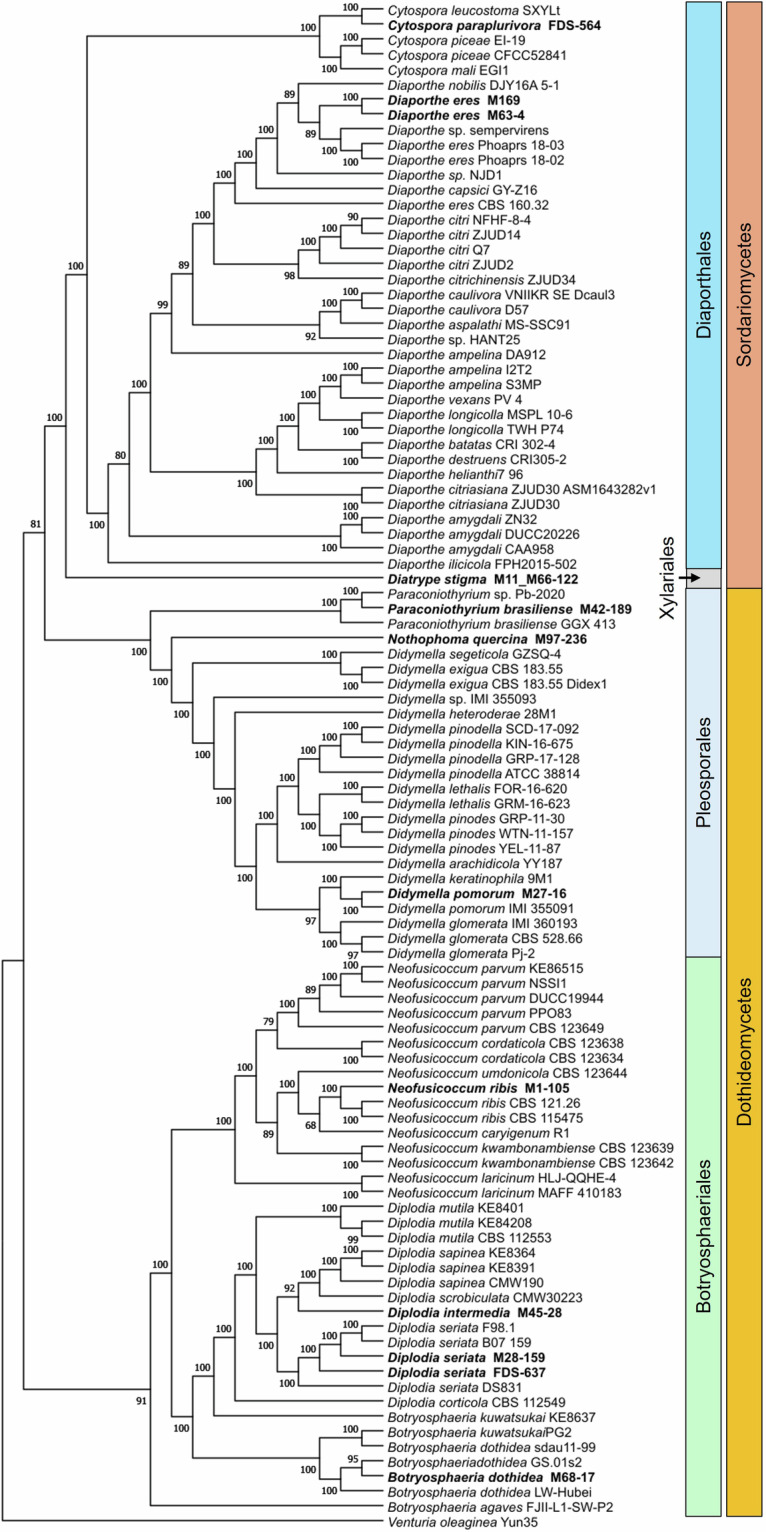 Figure 4
- —https://doi.org/10.13039/501100000040Gouvernement du Canada | Agriculture and Agri-Food Canada (Agriculture et Agroalimentaire Canada)
Peer Reviews
No public reviews on file for this paper yet. If you reviewed it on a platform where reviews are public (OpenReview, ICLR, NeurIPS, ICML), you can paste yours below so the community can read it here.
Videos
No videos yet. Explain this paper in a talk, walkthrough, or lecture? Add one.
Taxonomy
TopicsPlant Pathogens and Fungal Diseases · Yeasts and Rust Fungi Studies · Forest Insect Ecology and Management
Background & Summary
Apple and stone fruit trees are integral to Ontario’s agriculture economy. The primary areas for apple production in Ontario are located along the shores of Lake Ontario, Lake Erie, Lake Huron and the Georgian Bay. Recent years have seen a concerning downturn, with apple cultivation decreasing to 6,414 hectares in 2023, a 28% drop from the 8,903 hectares recorded in 2002^1^. Similarly, the Niagara region, responsible for over 90% of Ontario’s stone fruit production, has seen a decrease in cultivation area, down 37% from 5,080 hectares in 2007 to 3,192 hectares in 2023^1^.
Since 2016, both apple and stone fruit trees have faced alarming levels of mortality in Ontario, with reports of up to 42% mortality in apples and up to 72% in stone fruits, particularly affecting trees aged between 2 to 10 years^2–8^. Symptoms of decline vary, from leaf discoloration and canker development in apples to progressive dieback in stone fruits. These symptoms collectively define Fruit Tree Decline (FTD), with Rapid Apple Decline (RAD) specifically identified in apples^9^. The decline observed in apple and stone fruit trees extends beyond Ontario, echoing in other regions across North America^10^. While the exact cause of FTD remains elusive, the emergence of new pathogenic fungi^2–8,11^ and viruses^12–14^, as well as the re-emergence of known pathogens^15–17^, compounded by unexpected abiotic stressors such as drought stress, heat waves, floods, winter injury, and nutrient deficiency, are thought to play a significant role in its development^9,18,19^.
Fungal pathogenicity in a plant depends on multiple factors, including the specific traits of the pathogen, the plant’s defenses, and the conditions within their shared environment^20^. While weak pathogens may individually induce negligible FTD symptoms, the severity of the disease can escalate under the influence of other biotic or abiotic stresses. Understanding these interactions and the underlying genetic mechanisms is key for effective disease management.
Sequencing fungal genomes lays the foundation for exploring their ecological niche, evolutionary patterns, and disease-causing capabilities^21^. By deciphering the genetic makeup of these fungi, we aim to improve disease diagnosis, elucidate pathogenic mechanisms, and support the development of targeted strategies for disease prevention and management^22^. In the present study, we sequenced, de novo assembled and annotated the genomes of 12 fungi associated with FTD and RAD syndromes in Ontario, Canada, spanning a spectrum from pathogens to weak pathogens and non-pathogens/endophytes. By identifying genetic differences between pathogens and non-pathogens, we can gain a stronger understanding into the genetic determinants driving pathogenic evolution^23^. This knowledge is required for developing predictive models for fungal pathogen emergence and designing effective control measures.
This study provides the first assembled and annotated genomes for the Ascomycetes species Diplodia intermedia, Diatrype stigma, and Nothophoma quercina. These represent the only genome assemblies currently available for the Diatrype and Nothophoma genera. We also present high-quality and well-annotated reference genome for Diplodia seriata, Didymella pomorum and Neofusicoccum ribis. These new genomic resources significantly enhance our ability to study fungal pathogenicity in agricultural systems and inform the development of targeted control measures against pathogens. Moreover, the availability of these assemblies enables downstream functional analyses, including the identification of effector proteins, which are key virulence factors used by pathogens to facilitate host colonization^24^. Since effector characterization can inform resistance breeding and integrated disease management strategies, this work supports future discovery efforts and comparative genomic studies aimed at improving the resilience and sustainability of fruit production systems.
Methods
Sample collection, fungal isolation and identification
Between 2018 and 2021, wood samples were collected from 25 apple, 30 apricot, six peach, and six nectarine trees showing extensive symptoms of tree fruit decline across 15 commercial orchards in Ontario. Tree mortality rates reached up to 42% in apples and up to 72% in stone fruits, with the highest impact observed in trees between 2 and 10 years of age across the sampled orchards. Small sections of diseased wood (1 cm long) underwent surface sterilization with 70% ethanol for 30 seconds, followed by treatment with 1% NaClO for 20 minutes. After rinsing thrice in sterile water, the wood samples were placed on 2% potato dextrose agar (PDA, Difco™, Franklin Lakes, NJ, USA) with kanamycin (50 mg/L) and incubated at 22 °C for 5 days in darkness. Fungal colonies consistently isolated underwent hyphal-tip transfer to individual PDA plates, then incubated at 22 °C for 7 days in darkness. Purified isolates were morphologically classified into morphotypes before molecular identification.
Genomic DNA was extracted from the mycelium grown on PDA of 7-day-old cultures of one representative isolate from each morphotype group using the Plant/Fungi DNA Isolation Kit (Norgen Biotech, ON, Canada, cat. no. 26200), following the manufacturer’s instructions with slight modifications. Specifically, fungal tissue was vortexed for 15 minutes with 1 mm glass beads in 500 μL of lysis buffer supplemented with 1 μL of RNase A, followed by incubation at 65 °C for 10 minutes. Subsequently, 100 μL of Binding Buffer I was added, the mixture was thoroughly mixed, and incubated on ice for 5 minutes before centrifugation at 10,000 rpm to separate the lysate from the beads and biomass. Resin drying during the column wash was achieved by spinning for 10 minutes at 14,000 rpm. Finally, DNA was eluted at 10,000 rpm for 2 minutes.
Polymerase chain reaction (PCR) was performed in a VWR PCR Thermal Cycler XT^96^ Gradient (VWR, USA) under the following conditions: 98 °C for 30 sec; 35 × (98 °C, 10 sec; 60 °C, 30 sec; 72 °C, 30 sec); 72 °C, 2 min. The internal transcribed spacer (ITS), translation elongation factor 1-α (EF1-α) and β-tubulin (TUB2) gene regions were each amplified in separate PCR reactions using the primers ITS1/ITS4^25^, EF1-728 F/EF1-986R^26^ and Bt2a/Bt2b^27^, respectively. Each 30 μL reaction contained 9 μL of nuclease-free Water, 15 μL of Q5 Hot Start High-Fidelity 2X Master Mix (New England Biolabs, ON, Canada, cat. no. M0494S), 3 μL of extracted genomic DNA and 1.5 μL (10 μM stock) of the appropriate fungal-specific primers. Reactions were performed with negative controls containing no DNA.
The quality of the PCR products was examined using electrophoresis in 1% agarose gel. Sanger sequencing was carried out at Genome Quebec’s Sequencing Facility (Montreal, Canada). Sequences were analyzed with the Basic Local Alignment Search Tool (BLAST)^28^ against the nucleotide database for an early approximation of species classification.
DNA isolation and genome sequencing
Genomic DNA was extracted from fungal mycelium obtained from 12 pure cultures of fungi identified as previously described. These fungi include strains such as Botryosphaeria dothidea, Cytospora paraplurivora, Diaporthe eres, Diatrype stigma, Didymella pomorum, Diplodia intermedia, Diplodia seriata, Neofusicoccum ribis, Nothophoma quercina, and Paraconiothyrium brasiliense, all isolated from symptomatic apple, apricot, and nectarine trees (Table 1). Eleven of the 12 strains were deposited at the Canadian Collection of Fungal Cultures (DAOMC), each assigned a unique identification number as detailed in Table 1. The mycelium was cultured in potato dextrose broth (PDB, Difco™, Franklin Lakes, NJ, USA) for 5 days at room temperature on an orbital shaker (3 g), followed by filtration through sterilized Whatman^TM^ Qualitative filter paper grade 1 (Cytiva, Marlborough, MA, USA), freeze-drying for 48 hours using a Benchtop Freeze Dry System (Labconco FreeZone^®^ 4.5 Liter, Kansas City, MO, USA), and bead beating using 1 mm glass beads until a powdered form was obtained. Subsequently, the modified DNA extraction protocol, as previously described (Norgen Biotech, Thorold, ON, Canada), was employed.Table 1. Genome assembly and annotation statistics.Organism (DAOMC#)AccessionLength (bp)Sequencing MethodCoverageContigsN50 (bp)L50GC percentProtein-coding GenesNon-coding GenesBotryosphaeria dothidea M68-17 (DAOMC252246)GCA_021436945.245,122,761Illumina NovaSeq136.6x657286,094475512,423130Cytospora paraplurivora FDS-564 (DAOMC252466)GCA_021272945.239,445,691PacBio Sequel II170.0x187658,74118519,349192Diaporthe eres M169 (DAOMC252249)GCA_022570805.261,247,700Illumina NovaSeq112.3x1,202351,496484914,067157Diaporthe eres M63-4 (DAOMC252250)GCA_022570775.259,241,446PacBio Sequel II243.2x162644,873245014,171167Diatrype stigma M11/M66-122 (DAOMC252251)GCA_022225965.249,153,611Illumina NovaSeq145.9x420241,545644911,292163Didymella pomorum M27-16 (DAOMC252252)GCA_022225945.235,360,947Illumina NovaSeq281.9x423403,404295410,116158Diplodia intermedia M45-28 (DAOMC252253)GCA_021495925.238,098,648Illumina NovaSeq235.3x253289,184395611,222149Diplodia seriata FDS-637GCA_021436955.337,536,239PacBio Sequel II and Illumina NovaSeq427.4x213,256,27055710,553154Diplodia seriata M28-159 (DAOMC252254)GCA_021436965.237,023,545Illumina NovaSeq184.4x186481,311265710,624153Neofusicoccum ribis M1-105 (DAOMC252247)GCA_021436925.243,226,643Illumina NovaSeq179.0x659155,857745712,143127Nothophoma quercina M97-236 (DAOMC252260)GCA_021642125.234,358,614Illumina NovaSeq227.5x181833,36016529,970146Paraconiothyrium brasiliense M42-189 (DAOMC252261)GCA_022225985.239,345,625Illumina NovaSeq199.7x1081,183,519115212,000122
Sequencing strategies were designed to species abundance and data requirements. Diplodia seriata FDS-637, one of the most abundant species in the study, was sequenced using both PacBio and Illumina platforms to generate high-quality long-read data for comprehensive genome assembly. Two additional abundant species, Cytospora paraplurivora FDS-564 and Diaporthe eres M63-4 were sequenced using PacBio only, while the remaining nine isolates were sequenced using Illumina, which provided sufficient resolution.
Genomic DNA (gDNA) libraries for Cytospora paraplurivora FDS-564, Diaporthe eres M63-4, and Diplodia seriata FDS-637 were constructed and sequenced at the SickKids sequencing facility (Toronto, ON, Canada). Combinations of barcoded primers and SMRTbell adapters were used to prepare the samples, which were afterward pooled. Long reads for genome assembly were generated from a library prepared with 5 µg of unsheared gDNA using the Express Template Prep Kit (v2.0) (Pacific Biosciences, Menlo Park, CA). A post-library size-selection step targeting fragments > 14 kb was performed using the Agilent 4200 TapeStation System (Agilent, Waldbronn, Germany). The final size-selected library was sequenced on a PacBio Sequel^®^ II sequencer using a single 8 M SMRT Cell in continuous long-read (CLR) mode with a 15-hour movie acquisition time. Raw reads were processed using PacBio’s P-filter to remove low-quality reads and adapter sequences.
Illumina gDNA libraries for Diplodia seriata FDS-637 and the remaining nine fungal isolates were prepared and sequenced at the Centre d’Expertise et de Services, Génome Québec, McGill University (Montréal, QC, Canada). Genomic DNA was quantified using the Quant-iT™ PicoGreen® dsDNA Assay Kit (Life Technologies™, Grand Island, NY, USA), and its integrity was assessed on a TapeStation 2200 (Agilent Technologies, Inc. Santa Clara, CA, USA). Libraries were prepared using the NEBNext Ultra II DNA Library Prep Kit for Illumina (New England Biolabs, Whitby, ON, Canada) according to the manufacturer’s instructions. Adapters and PCR primers were purchased from Integrated DNA Technologies (IDT, Coralville, IA, USA). Size selection to obtain the desired insert size was performed using sparQ beads (Quantabio, Beverly, MA, USA). Library quantification was carried out using the KAPA Library Quantification Universal Complete Kit (Kapa Biosystems; Wilmington, MA, USA), and average fragment size was determined using a LabChip GX II instrument (PerkinElmer, Waltham, MA, USA). Libraries were normalized, pooled, denatured with 0.02 N NaOH, and neutralized using HT1 buffer. The pooled libraries were loaded at 225 pM on an Illumina NovaSeq 6000 S4 flow cell using the Xp protocol, following the manufacturer’s guidelines. Sequencing was conducted in paired-end mode (2 × 150 bp cycles). A 1% PhiX control library was spiked into the run. Base calling was performed using Illumina Real-Time Analysis (RTA) software (v3), and demultiplexing and FASTQ file generation were done using bcl2fastq2 Conversion Software (v2.20) (Illumina, San Diego, CA, USA).
Genome de novo assembly and annotation
Illumina NovaSeq reads (shown in Table 1) were trimmed with Trimmomatic (v0.38.1)^29^. The ILLUMINACLIP setting was used to remove adapter sequences, and a sliding window approach (4 bp window with an average quality threshold of Q = 20) was applied to trim low quality base calls. The quality of the reads were analyzed before and after Trimmomatic by FastQC (v0.72). Trimmed reads were assembled and gaps were filled using SPAdes (v3.12.0)^30^ with the K-mer values 21, 33, 45, 69, 81, 93, 105, and 117.
PacBio reads for Cytospora paraplurivora FDS-564, Diaporthe eres M63-4 and Diplodia seriata FDS-637 were trimmed and assembled using Canu (v2.1.1)^29^ with default settings, as described by Ilyukhin et al.^8^. For Diplodia seriata FDS-637, Illumina paired-end reads were aligned to the Canu-assembled PacBio genome using Burrow Wheeler Alignment (BWA (v0.7.17))^31^ with default settings to generate a SAM file. This file was then converted to a sorted BAM file using SAMtools (v1.14)^32^, which served as input for Pilon (v1.23)^33^ to correct base-level errors and enhance the overall accuracy of the Canu assembly. Quast (v5.0.2)^34^ was used to determine assembly statistics and genome coverage (Table 1).
The Funannotate (v1.8.18)^35^ pipeline was used for genome annotation following the recommended instructions (https://funannotate.readthedocs.io) for gene prediction. All assemblies were cleaned and masked using Funannotate default settings, which utilize Tantan (v40)^36^ (https://gitlab.com/mcfrith/tantan) for repeat masking. Subsequently, Benchmarking Universal Copy Orthologs (BUSCO (v2.0.0))^37^ was run on all genomes using the dikarya_odb9 dataset and its results were used to train GlimmerHMM (v3.0.4)^38^, SNAP (2006-07-28)^39^, and Augustus v3.3.3^40^ for ab initio gene prediction. Gene predictions were generated using the aforementioned trained gene models and GeneMark-ES (v4.59)^41^. Weights were assigned to each prediction, based on the source and the strength of each prediction, and passed into EVidenceModeler^42^, which was used to generate a consensus gene model. Finally, tRNAscan-SE^43^ was used to generate tRNA predictions.
Functional Annotation was performed using the funannotate wrapper through which the results of numerous analyses were combined. Secondary metabolic gene clusters were predicted using antiSMASH (v6.0)^44^. The number of each category of biosynthetic gene clusters, found by antiSMASH are listed in Table 2. Interproscan (v5)^45^, eggnog-mapper (v2)^46^ (utilizing eggNOG (v5.0)^47^), HMMer3 searches against Pfam (v32.0)^48^, dbCAN (v8.0)^49^; and diamond searches against MEROPS (v12.0)^50^, uniprot and CAZYmes^51^ databases were used to annotate protein functional domains. Phobius (v1.01)^52^ was used to predict protein secretion and transmembrane domains, while signal peptides were predicted using SignalP (v6.0)^53^. The number of annotations added by these steps is summarized in Table 3.Table 2. Counts of different biosynthetic gene clusters found from antiSMASH, in each genome.OrganismTerpeneT1PKSNRPS-likeNRPSBetalactoneIndoleFungal-RiPPT3PKSSiderophoreOtherBotryosphaeria dothidea M68-1712281819201000Cytospora paraplurivora FDS-56411271411041201Diaporthe eres M16914581920071211Diaporthe eres M63-412511720051211Diatrype stigma M11/M66-1221021127030110Didymella pomorum M27-164572110000Diplodia intermedia M45-28713104100000Diplodia seriata FDS-6377783100000Diplodia seriata M28-1598893100000Neofusicoccum ribis M1-10512221319100000Nothophoma quercina M97-2364354000000Paraconiothyrium brasiliense M42-189101578020000Table 3Protein counts with functional annotations from each of the listed databases.OrganismGO OntologyInterProScanEggNOGPfamCAZymeMeropsSecretionBotryosphaeria dothidea M68-176,9179,49611,4358,4945814161,092Cytospora paraplurivora FDS-5645,4807,4458,8116,659411334601Diaporthe eres M1697,74710,80512,9979,5648145251,313Diaporthe eres M63-47,71510,78013,0909,3297905141,266Diatrype stigma M11/M66-1226,2378,61210,4757,491562379935Didymella pomorum M27-165,8317,8999,5957,209550363839Diplodia intermedia M45-286,1218,40710,1697,455494342954Diplodia seriata FDS-6375,8798,0289,7027,003478335814Diplodia seriata M28-1595,9018,0689,7697,091486345825Neofusicoccum ribis M1-1056,8769,45511,3348,4695894081,025Nothophoma quercina M97-2365,7407,7559,4996,909513357792Paraconiothyrium brasiliense M42-1896,4538,96610,9707,777630425966Secretion refers to the number of proteins predicted to have signal peptides by SignalP.
Genomes were visualized using Circos diagrams to assess quality (Fig. 1). GC skew and GC content were calculated over a sliding window of size 100 kbp. Counts of the canonical telomeric sequences”TTAGGG”, and its reverse complement “CCCTAA” were found over a 50 kbp window. Spikes at the ends of scaffolds likely indicate the presence of telomeres. Scaffolds with telomere count spikes on either side can be found in Paraconiothyrium Brasiliense strain M42-189*, Nothophoma quercina* strain M97-236 and Diplodia seriata strain FDS-637, indicating that some of the scaffolds in these assemblies may be chromosomes sequence telomere-to-telomere. Functional annotations was assessed by evaluating the number of Gene Ontology (GO) terms (Fig. 2 and Tables S1–S3) and the Clusters of Orthologous Groups of proteins (COGs) present in each annotation, as shown in Fig. 3 and Table S4. Relatively similar percents of different COG groups and GO annotation terms were found between genomes of the same species.Fig. 1. Circos plots for all fungal assemblies in this study, each with 7 rings lettered A to G. Only scaffolds greater than 100 kbp are shown. Ring A illustrates scaffolds in the assembly, with smaller ticks are placed at intervals of 100 kbp, and larger ticks are placed at intervals of 1Mbp. Ring B highlights the coding sequences (CDSs) on the forward strand, while Ring C does the same for the reverse strand and Ring D depicts the tRNAs. Ring E presents the direction and magnitude of GC skew, with black fill signifying an increase in GC skew relative to the average of the entire genome, while gray represents a decrease. Similarly, Ring F presents the GC content, with olive fill representing an increase in GC content over the average of the assembly, while magenta represents a decrease. Ring G plots the counts of telomeric sequence.Fig. 2A series of plots representing the number of GO ontology terms in each annotation. In order of top to bottom, the first plot shows a line graph for the number of instances of the three different categories of GO terms: GO process, referring to the biological processes in which a particular gene may play a part; GO function, the activity the product of the gene may possess; and GO component, the location where the gene product is active. The next three plots (in order: GO function, GO component, and GO process) represent the relative percentages of each of the top 15 most common GO terms from their respective category, while terms not in the top 15 are summarized in the “other” group.Fig. 3. Plot of COGs in each annotation. Each bar represents the percent number of each of the COGS (the corresponding y-axis is on the left). The line graph shows the total number of COG annotations in each assembly (with the corresponding y-axis on the right).
Phylogenomic analyses
Genomes of the 12 fungal strains sequenced, assembled, and annotated in this study, along with 90 fungal genomes downloaded from NCBI using the get-assemblies tool (GitHub - davised/get_assemblies), were included in the phylogenetic analysis (Fig. 4). All genomes were retrieved by using all genera names of the sequenced organisms in this study as queries, such as “Didymella”, “Paraconiothyrium”, and more. Sixty-one core genes, listed in Table 4, were extracted, aligned and concatenated using the Universal Fungal Core Genes (UFCG) pipeline version 1.0.5^54^. Maximum Likelihood-based phylogenetic analysis of the concatenated sequences was performed using IQ-Tree (v2.2.6)^55^, with 1,000 bootstrap replicates processed to determine the best-scoring Maximum Likelihood tree. The phylogenetic tree was rooted with Venturia oleaginea Yun35.Fig. 4. Maximum Likelihood phylogenetic tree generated using a concatenated alignment of 61 core genes extracted from the genomes of Dothideomycetes and Sordariomycetes species sourced from NCBI. The 12 fungal genomes obtained in this study are highlighted in bold. The tree was rooted to Venturia oleaginea Yun35. The numbers at each node represent bootstrap support, expressed as percentages.Table 4. List of the 61 core genes extracted from fungal genomes using the UFCG pipeline to generate the phylogenetic tree, along with their corresponding functions and identifiers sourced from the Saccharomyces Genome Database (SGD, www.yeastgenome.org) and UniProt (www.uniprot.org).GeneFunctionSGDUniProtACT1ActinYFL039CP60010ATP6F1F0 ATP synthase subunitQ0085P00854BMS1Ribosome biogenesis proteinYPL217CQ08965BRE2COMPASS componentYLR015WP43132CCT8Chaperonin-containing T-complex subunitYJL008CP47079CMD1CalmodulinYBR109CP06787COBCytochrome bQ0105P00163COX1Cytochrome c oxidase subunitQ0045P00401COX2Cytochrome c oxidase subunitQ0250P00410COX3Cytochrome c oxidase subunitQ0275P00420DIP2U3 small nucleolar RNA-associated protein 12YLR129WQ12220DPH5Diphthine methyl ester synthaseYLR172CP32469DYS1Deoxyhypusine synthaseYHR068WP38791ELP3Elongator complex protein 3YPL086CQ02908ESF1Pre-rRNA-processing proteinYDR365CQ06344FAP7Adenylate kinase isoenzyme 6 homologYDL166CQ12055FRS1Phenylalanine–tRNA ligase beta subunitYLR060WP15624HEM12Uroporphyrinogen decarboxylaseYDR047WP32347HIS4Histidine biosynthesis trifunctional proteinYCL030CP00815HIS7Imidazole glycerol phosphate synthaseYBR248CP33734ILV1Threonine dehydrataseYER086WP00927KRE33RNA cytidine acetyltransferaseYNL132WP53914MCM7Mini-chromosome maintenance complex subunitYBR202WP38132MET65-methyltetrahydropteroyltriglutamate–homocysteine methyltransferaseYER091CP05694MIP1DNA polymerase gammaYOR330CP15801MRPL1954S ribosomal protein L19YNL185CP53875MSF1Phenylalanine–tRNA ligaseYPR047WP08425MSS51Mitochondrial splicing suppressor protein 51YLR203CP32335MVD1Diphosphomevalonate decarboxylaseYNR043WP32377NCS6Cytoplasmic tRNA 2-thiolation protein 1YGL211WP53088NDI1NADH-ubiquinone reductaseYML120CP32340NOG1Nucleolar GTP-binding protein 1YPL093WQ02892NOP14Nucleolar complex protein 14YDL148CQ99207OLI1F0 ATP synthase subunitQ0130P61829PAH1Phosphatidate phosphataseYMR165CP32567PGK1Phosphoglycerate kinaseYCR012WP00560POL2DNA polymerase epsilon catalytic subunit AYNL262WP21951PRT1Eukaryotic translation initiation factor 3 subunit BYOR361CP06103RAD2DNA repair proteinYGR258CP07276RLI1Translation initiation factorYDR091CQ03195RPB2DNA-directed RNA polymerase II core subunitYOR151CP08518RPF2Ribosome biogenesis proteinYKR081CP36160RPN126S proteasome regulatory subunitYHR027CP38764RPO21DNA-directed RNA polymerase II core subunitYDL140CP04050RPP060S acidic ribosomal protein P0YLR340WP05317SDA1Severe depolymerization of actin protein 1YGR245CP53313SEC. 21Coatomer subunit gammaYNL287WP32074SEC. 26Coatomer subunit betaYDR238CP41810SPB127S pre-rRNA (guanosine(2922)-2’-O)-methyltransferaseYCL054WP25582TEF1Translation elongation factor EF-1 alphaYPR080WP02994TIF5Eukaryotic translation initiation factor 5YPR041WP38431TIM44Mitochondrial import inner membrane translocase subunitYIL022WQ01852TOP1DNA topoisomerase 1YOL006CP04786TRM1tRNA (guanine(26)-N(2))-dimethyltransferaseYDR120CP15565TRP3Multifunctional tryptophan biosynthesis proteinYKL211CP00937TSR1Ribosome maturation factorYDL060WQ07381TUB1Alpha-tubulinYML085CP09733TUB2Beta-tubulinYFL037WP02557UTP21U3 small nucleolar RNA-associated protein 21YLR409CQ06078VMA1V-type proton ATPase catalytic subunit AYDL185WP17255ZPR1Zinc finger proteinYGR211WP53303
Data Records
The datasets have been deposited in the Sequenced Read Archive (SRA) under accession numbers: SRX14291869, SRX14155424, SRX14046716, SRX14003295, SRX13989866, SRX13979984, SRX13961038, SRX13940527, SRX13921100, SRX13894123, SRX13883208, SRX13877378, SRX13445800^56^. All assemblies and annotations can be found on NCBI GenBank under BioProject PRJNA790013^57^, with the following accession numbers: JAJVDB000000000^58^, JAJSPL000000000^59^, JAKOOP000000000^60^, JAKNSF000000000^61^, JAKJXP000000000^62^, JAKJXN000000000^63^, JAKEKT000000000^64^, JAJVDA000000000^65^, JAJVCZ000000000^66^, JAJVDC000000000^67^, JAKIXB000000000^68^, JAKJXO000000000^69^.
Technical Validation
BUSCO (v5.8.2) employing the Ascomycota_odb12 dataset was used to assess whether core genes were adequately captured in the genomes sequenced. All genomes were of high quality (Table 5) and had greater than 97% of BUSCOs complete.Table 5. Benchmarking Universal Copy Orthologs (BUSCO) assessment results.Complete BUSCOsComplete single-copy BUSCOsComplete duplicated BUSCOsFragmented BUSCOsMissing BUSCOsPercent CompleteBotryosphaeria dothidea M68-17277127591235298.1%Cytospora paraplurivora FDS-564278027483254198.4%Diaporthe eres M169277827661264298.3%Diaporthe eres M63-4277627552164498.2%Diatrype stigma M11/M66-12227832776753898.5%Didymella pomorum M27-1627862779753598.6%Diplodia intermedia M45-2827712767435298.1%Diplodia seriata FDS-63727662761555597.9%Diplodia seriata M28-15927632760345997.8%Neofusicoccum ribis M1-105276927561365198.0%Nothophoma quercina M97-23627932788552898.8%Paraconiothyrium brasiliense M42-189277927718133498.3%
Supplementary information
Supplementary Tables S1-S4
The reference list from the paper itself. Each links out to its DOI / PubMed record.
- 1Statistics Canada. Area, production and farm gate value of marketed fruits: Table 32-10-0364-01, 10.25318/3210036401-eng (2024).
- 2Hill, R. et al. Tapping culture collections for fungal endophytes: First genome assemblies for three genera and five species in the Ascomycota. Genome Biology and Evolution 15, 10.1093/gbe/evad 038 (2023).10.1093/gbe/evad 038PMC 1002760536881851 · doi ↗ · pubmed ↗
- 3White, T. J., Bruns, T., Lee, S. & Taylor, J. in PCR Protocols: A Guide to Methods and Applications (eds Innis, M. A., Gelfand, D. H., Sninsky, J. J. & White, T. J.) 315–322 (Academic Press, 1990).
- 4Danecek, P. et al. Twelve years of SA Mtools and BC Ftools. Giga Science 10, 10.1093/gigascience/giab 008 (2021).10.1093/gigascience/giab 008PMC 793181933590861 · doi ↗ · pubmed ↗
- 5Chan, P. P. & Lowe, T. M. in Gene Prediction: Methods and Protocols (ed Kollmar, M.) 1–14 (Springer New York, 2019).
- 6Sulman, M., Ilyukhin, E., Nguyen, H. D. T., Ali, S. & Ellouze, W. Diplodia seriata strain FDS-637, whole genome shotgun sequencing project. https://identifiers.org/ncbi/insdc:JAJVCZ 000000000 (2024).