Exploring the prognostic value of combined assessment of bone marrow plasma cell morphology, Vitamin D, and interleukin-6 in multiple myeloma
Ping Huang, Fenping Zhang, Yuchun Lin, Jie Peng, Zesong Yang

TL;DR
This study shows that combining bone marrow plasma cell analysis with Vitamin D and IL-6 levels can predict outcomes in multiple myeloma patients, potentially improving local healthcare access.
Contribution
The novelty lies in combining plasma cell morphology with Vit D and IL-6 for a more accurate MM prognosis assessment.
Findings
Combined detection of plasma cell morphology, Vit D, and IL-6 showed an AUC of 0.835 for prognosis.
Vit D positively correlated with ALB, while IL-6 negatively correlated with HGB.
Plasma cell count and IL-6 levels increased before chemotherapy compared to after.
Abstract
The study aims to explore the prognostic assessment value of bone marrow plasma cell morphology, Vitamin D (Vit D), and Interleukin-6 (IL-6) in patients with Multiple Myeloma (MM), with the potential to provide local medical care for follow-up patients and indirectly alleviate the difficulty of accessing healthcare in higher-level hospitals. Clinical data were collected from 111 MM patients admitted to the Department of Hematology, The First Affiliated Hospital of Chongqing Medical University, between January 2022 and December 2024. The morphological characteristics of plasma cells in different stages of the disease were analyzed in patients with poor prognosis. The correlations between the number of plasma cells, Vit D, IL-6, laboratory indicators, and disease stages were investigated. Receiver Operating Characteristic (ROC) curves were plotted based on follow-up data to assess the…
Genes, proteins, chemicals, diseases, species, mutations and cell lines named across the full text — each resolved to its canonical identifier and authoritative record.
Click any figure to enlarge with its caption.
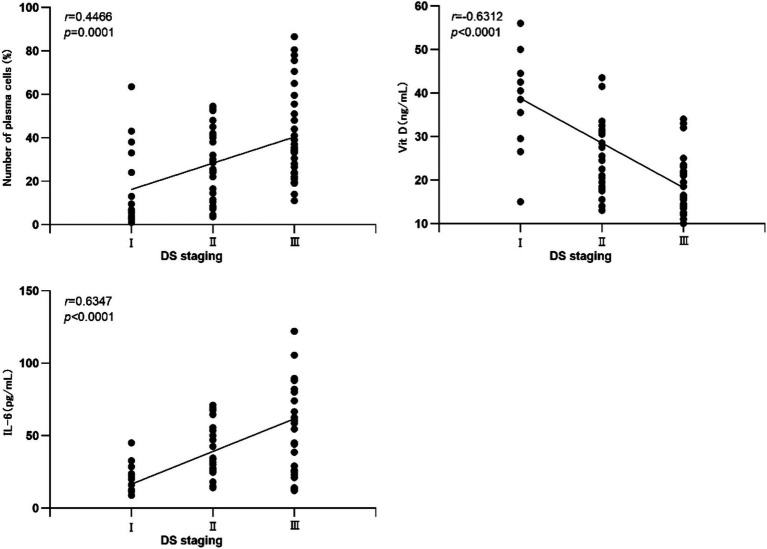 Figure 1
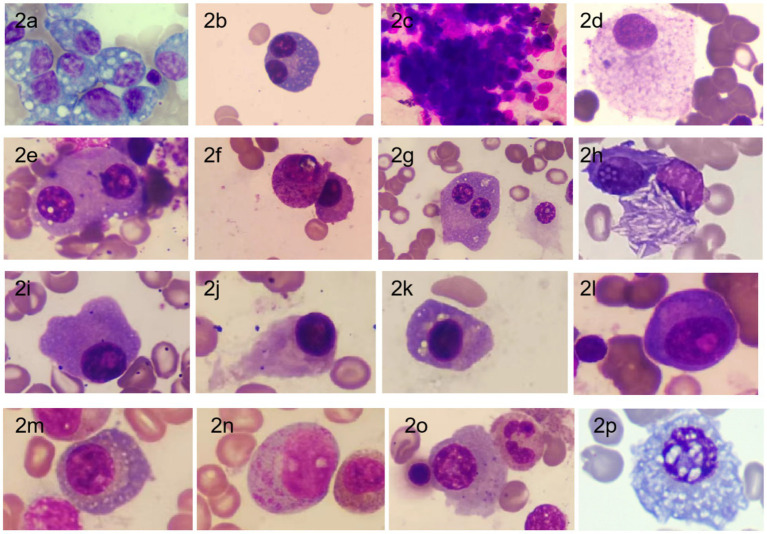 Figure 2
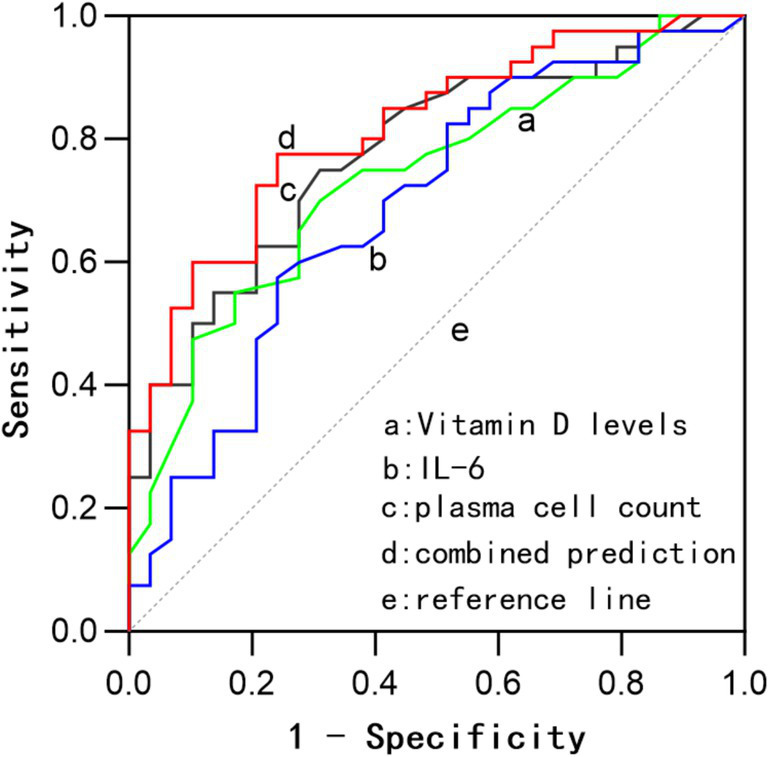 Figure 3
| Project |
| Plasma cell count ( | Vit D (ng/mL) | IL-6 (pg/mL) | ||||||
|---|---|---|---|---|---|---|---|---|---|---|
| Q (Q1, Q3) |
|
| Q (Q1, Q3) |
|
|
|
| |||
| Gender | 1.431 | 0.154 | 1.796 | 0.142 | 1.096 | 0.241 | ||||
| Male | 71 | 34 (12,54) | 28.1 (18.2,51.1) | 98.12 ± 11.21 | ||||||
| Female | 40 | 31 (14,69) | 26.8 (17.4,39.5) | 97.14 ± 10.24 | ||||||
| Age (years) | 0.491 | 0.685 | 1.287 | 0.111 | 1.564 | 0.132 | ||||
| >60 | 75 | 25 (19,51) | 21.1 (15.6,50.9) | 93.43 ± 12.13 | ||||||
| ≤60 | 36 | 30 (15,46) | 24.8 (16.3,39.7) | 92.35 ± 9.04 | ||||||
| ISS staging | 4.312 | 0.01 | 3.832 | 0.024 | 3.762 | 0.031 | ||||
| I | 21 | 21 (16,43) | 22.0 (16.2,34.9)c | 89.30 ± 11.04 | ||||||
| II | 46 | 30 (32,67)a | 20.1 (16.3,38.7)c | 94.35 ± 14.52 | ||||||
| III | 44 | 46 (38,78)ab | 16.4 (12.3,29.0) | 123.54 ± 17.12d | ||||||
| DS staging | 4.367 | 0.012 | 2.832 | 0.044 | 3.365 | 0.042 | ||||
| I | 19 | 23 (14,41) | 23.0 (19.2,44.3)c | 86.76 ± 8.09 | ||||||
| II | 44 | 32 (21,64)a | 24.1 (15.3,40.3)c | 96.36 ± 15.62 | ||||||
| III | 48 | 45 (25,79)ab | 16.4 (11.6,42.2) | 114.53 ± 18.14d | ||||||
| Myeloma-related complications | 0.409 | 0.162 | 1.943 | 0.453 | 1.187 | 0.321 | ||||
| Yes | 35 | 34 (15,55) | 15.2 (15.3,55.5) | 91.31 ± 11.63 | ||||||
| No | 76 | 31 (16,46) | 28.3 (18.3,40.7) | 90.86 ± 8.61 | ||||||
| Rouleaux formation of red blood cells | 0.563 | 0.712 | 1.131 | 0.433 | 0.424 | 0.675 | ||||
| Yes | 66 | 25 (18,49) | 25.6 (19.3,45.4) | 84.30 ± 7.53 | ||||||
| No | 44 | 29 (20,50) | 28.9 (18.3,40.8) | 83.84 ± 8.70 | ||||||
| Infection | 1.093 | 0.082 | 1.101 | 0.41 | 0.414 | 0.64 | ||||
| Yes | 25 | 36 (17,67) | 32.2 (16.0,54.9) | 89.90 ± 7.53 | ||||||
| No | 85 | 33 (21,75) | 28.4 (19.3,45.5) | 87.41 ± 8.60 | ||||||
| Hypertension | 1.231 | 0.108 | 0.876 | 1.002 | ||||||
| Yes | 31 | 35 (25,59) | 27.2 (15.6,54.5) | 92.93 ± 9.53 | 0.325 | 0.901 | ||||
| No | 80 | 38 (26,61) | 25.4 (19.4,36.3) | 90.44 ± 8.91 | ||||||
| Diabetes mellitus | 1.131 | 0.092 | 0.544 | 0.613 | 1.324 | 0.721 | ||||
| Yes | 26 | 34 (18,67) | 31.2 (13.0,51.8) | 82.73 ± 8.03 | ||||||
| No | 85 | 31 (20,49) | 33.3 (17.3,59.5) | 84.11 ± 7.81 | ||||||
| Cigarette smoking | 1.563 | 0.221 | 0.902 | 0.87 | 2.426 | 0.084 | ||||
| Yes | 46 | 40 (23,69) | 26.2 (15.0,44.1) | 98.93 ± 9.04 | ||||||
| No | 65 | 38 (32,74) | 23.6 (19.3,41.3) | 92.45 ± 8.92 | ||||||
| Chemotherapy | 3.453 | 0.021 | 1.034 | 0.632 | 5.736 | 0.001 | ||||
| Yes | 90 | 30 (21,65) | 30.3 (17.0,50.4) | 82.93 ± 9.89 | ||||||
| No | 21 | 57 (34,85) | 29.3 (18.0,42.9) | 124.84 ± 19.41 | ||||||
| Project | Plasma cell count ( | Vit D (ng/mL) | IL-6 (pg/mL) | |||
|---|---|---|---|---|---|---|
|
|
|
|
|
|
| |
| HGB | −0.113 | 0.221 | 0.176 | 0.568 | −0.556 | 0.049 |
| WBC | −0.164 | 0.077 | 0.235 | 0.489 | −0.214 | 0.482 |
| PLT | −0.13 | 0.163 | 0.312 | 0.415 | −0.456 | 0.117 |
| ALB | −0.092 | 0.322 | 0.581 | 0.04 | −0.096 | 0.754 |
| LDH | −0.051 | 0.581 | 0.345 | 0.272 | 0.184 | 0.547 |
| Ca | −0.388 | 0.190 | 0.259 | 0.408 | −0.126 | 0.681 |
| plasma cell count | – | – | −0.354 | 0.230 | 0.396 | 0.180 |
| Vit D | −0.134 | 0.171 | – | – | −0.432 | 0.124 |
| IL-6 | 0.396 | 0.180 | −0.532 | 0.056 | – | – |
| Project | Optimal cut-off value | Sensitivity (%) | Specificity (%) | AUC | 95%CI |
|---|---|---|---|---|---|
| Vit D | 26.5 | 71.0% | 71.8% | 0.745 | 0.628 ~ 0.862 |
| IL-6 | 53.5 | 75.9% | 69.0% | 0.709 | 0.583 ~ 0.835 |
| plasma cell count | 24 | 72.0% | 76.9% | 0.797 | 0.692 ~ 0.902 |
| combined | – | 79.9% | 79.5% | 0.835 | 0.741 ~ 0.928 |
Peer Reviews
No public reviews on file for this paper yet. If you reviewed it on a platform where reviews are public (OpenReview, ICLR, NeurIPS, ICML), you can paste yours below so the community can read it here.
Videos
No videos yet. Explain this paper in a talk, walkthrough, or lecture? Add one.
Taxonomy
TopicsHematological disorders and diagnostics · Vitamin D Research Studies · Bone and Joint Diseases
Introduction
1
Multiple myeloma (MM), characterized by symptoms such as anemia, bone pain, renal disease, and hypercalcemia, is a common hematological malignancy predominantly affecting elderly patients. Due to its incurable nature, prognosis monitoring becomes particularly crucial (1, 2). Bone marrow cell morphology is not only used for the diagnosis of MM but is also essential for assessing disease prognosis (3). Vitamin D (Vit D) levels exhibit a negative trend in disease progression and are closely related to disease stage and prognosis (4, 5). Interleukin-6 (IL-6) promotes tumor cell proliferation, with its levels significantly elevated during disease progression (6, 7). Considering the predominantly elderly patient population and economic burdens, it is necessary to select cost-effective prognosis monitoring indicators and facilitate follow-up visits at nearby county-level medical institutions. Therefore, this study explored the assessment value of combined detection of bone marrow cell morphology, plasma Vit D, and IL-6 in the prognosis of MM. The research findings are reported as follows:
Materials and methods
2
General information
2.1
A retrospective analysis was conducted on the clinical data of 111 MM patients admitted to the Hematology Department of the First Affiliated Hospital of Chongqing Medical University from January 2022 to December 2024. The cohort included 71 males and 40 females, aged 42 to 89 years, with a median age of 65 years. According to the International Staging System (ISS), there were 21 patients in stage I, 46 in stage II, and 44 in stage III. Based on the Durie-Salmon (DS) staging system, there were 19 patients in stage I, 44 in stage II, and 48 in stage III. Among them, There were 35 cases with bone marrow complications (such as osteolytic lesions, pathological fractures, etc.), while 76 did not. Sixty-six patients exhibited rouleaux formation of red blood cells in peripheral blood, while 44 did not. Twenty-five patients had infections, and 85 did not. Inclusion criteria: (1) All patients met the diagnostic criteria for MM (8); (2) No radiotherapy or chemotherapy before consultation; (3) Complete medical records for all patients; (4) Voluntary signing of the informed consent form. Exclusion criteria: (1) Presence of other hematological tumors, severe liver or kidney diseases, and autoimmune diseases; (2) Received antitumor treatment within 1 month; (3) Received immunosuppressants and hormone therapy within 3 months; (4) Used calcitonin and Vit D within 1 month. Prognosis follow-up: Patients were followed up every 3 months until December 2024, with their prognosis recorded. This study was approved by both the Ethics Committee of the First Affiliated Hospital of Chongqing Medical University (Approval Number: CY2025-506-01) and the Ethics Committee of Fengdu County Traditional Chinese Medicine Hospital (Approval Number: FDYY-2025-0303). All patients signed informed consent forms.
Methods
2.2
Bone marrow smears were observed and plasma cell counts were conducted using an Olympus optical microscope. Biochemical indicators were measured using a Roche 6,000 biochemical analyzer, while blood routine indicators were determined using a Mindray BC-7500 automated hematology analyzer.
Statistical analysis
2.3
SPSS statistical software was used for data analysis. Normally distributed measurement data were expressed as mean ± standard deviation (x̄ ± s), and comparisons between groups were made using the t-test or one-way ANOVA. Non-normally distributed measurement data were expressed as median M (Q1, Q3), and comparisons between groups were made using the Mann–Whitney U test or Kruskal-Wallis H test. Count data were presented as n (%). Spearman analysis was used for correlation analysis, and Receiver Operating Characteristic (ROC) curves were plotted to analyze the Area Under the Curve (AUC) for each indicator. The AUC values between indicators were compared, and the Z-test was used for assessment. p < 0.05 was considered statistically significant.
Results
3
Comparison of bone marrow plasma cell count, Vit D, and IL-6 levels among patients with different characteristics
3.1
Statistically significant differences were observed in bone marrow plasma cell count, Vit D levels, and IL-6 levels between DS and ISS staging (p < 0.05). Additionally, there were statistically significant differences in bone marrow plasma cell count and IL-6 levels before and after chemotherapy, with higher levels observed before chemotherapy (p < 0.05). See Table 1 for details.
Correlation between bone marrow plasma cell count, Vit D, and IL-6 with various indicators
3.2
Table 2 presents the correlation analysis between various laboratory indicators and bone marrow plasma cell count, Vit D, and IL-6. Notably, a positive correlation was observed between Vit D and ALB (r = 0.581, p < 0.05). Conversely, IL-6 exhibited a negative correlation with HGB (r = −0.556, p < 0.05). No correlation was found between bone marrow plasma cell count and any of the other indicators. See Table 2 for details.
Correlation between bone marrow plasma cell count, Vit D, and IL-6 with DS staging
3.3
A positive correlation was observed between bone marrow plasma cell count and IL-6 levels with DS staging in MM patients (r = 0.4466, 0.6347; p = 0.0001, <0.0001, respectively). Conversely, Vit D exhibited a negative correlation with DS staging in MM patients (r = −0.6312; p < 0.0001). See Figure 1 for details.
Correlation between bone marrow plasma cell count, Vit D, and IL-6 with DS staging.
Morphological characteristics of abnormal plasma cells in the bone marrow of MM patients
3.4
Through comprehensive observation of cell distribution, cell body morphology, cytoplasmic contents, nuclear structure, and chromatin characteristics, we summarized the morphological features of plasma cells. These include clustered distribution of plasma cells, variable cell body size, various inclusions visible within the cytoplasm, and the presence of binuclear, multinuclear, or abnormal nuclear shapes. See Figure 2 for details.
Morphology of bone marrow plasma cells in MM Patients [stained with Swiss stain, magnification ×1,000; (a) Plasma cell cytoplasm filled with large vacuoles; (b) Binuclear plasma cell; (c) Clustered distribution of plasma cells; (d) Mature plasma cell with abundant cytoplasm filled with fine granular particles; (e) Binuclear plasma cell with phagocytosis of platelets; (f) Plasma cell with cytoplasm filled with purple-red granules; (g) Binuclear plasma cell with a smaller nucleus; (h) Plasma cell cytoplasm containing needle-like white crystals; (i) Irregular edge of plasma cell; (j) Flame cell (plasma cell with a flame-like appearance); (k) Plasma cell with perinuclear vacuoles; (l) (corrected from i to avoid repetition): Primitive plasma cell with prominent nucleoli and perinuclear clear zones; (m) Fine vacuoles scattered throughout the cytoplasm; (n) Immature plasma cell with abundant unevenly distributed purple-red granules in the cytoplasm; (o) Plasma cell cytoplasm containing variable-sized fine granules; (p) Plasma cell nucleus with Dutcher bodies accompanied by cytoplasmic vacuoles (20), commonly seen in IgA type].
Prognostic value of bone marrow plasma cell count, Vit D, and IL-6 in assessing disease outcome
3.5
The combined detection of these three indicators exhibited a sensitivity of 75.9%, a specificity of 79.5%, and an AUC of 0.835. The AUC for the combined detection was superior to that of IL-6 (z = 2.148, p = 0.032) and Vit D (z = 1.978, p = 0.048) when assessed individually. The AUC for the combined detection was higher than that for plasma cell count alone, although the difference was not statistically significant. See Table 3 and Figure 3 for details.
ROC curves for prognostic assessment based on bone marrow plasma cell count, Vit D, IL-6, and their combined evaluation.
Discussion
4
Multiple myeloma (MM) is a malignant tumor characterized by abnormal proliferation of plasma cells, with a complex pathogenesis that remains incurable. Enhancing patient prognosis monitoring and controlling disease progression are optimal strategies for improving quality of life (9). However, the majority of MM patients are elderly, making it crucial to select reliable and cost-effective prognostic indicators and facilitate follow-up visits at nearby medical institutions. Based on this, we explored the prognostic value of bone marrow cell morphology, Vit D, and interleukin-6 (IL-6) in MM, providing a reference for patient follow-up.
Bone marrow cell morphology examination is not only used for MM diagnosis but is also an important method for visually assessing bone marrow plasma cell morphology and count during follow-up. In this study, we found that patients with poor prognosis exhibited significant heterogeneity in bone marrow plasma cell morphology, including clustered cell distribution, variable cell body size, the presence of vacuoles or various inclusions in the cytoplasm, and the appearance of multi-nuclear or abnormal nuclei. These findings are consistent with reports in the literature (3, 10). Moreover, we observed needle-like and large granular substances in the cytoplasm of bone marrow plasma cells in a few patients, which may be associated with poor prognosis. Similar morphologies have been reported in the literature (11, 12). Therefore, bone marrow cell morphology examination holds significant value in MM diagnosis and disease progression assessment.
Our study revealed that the number of bone marrow plasma cells increased with higher disease stages, showing a positive correlation with Durie-Salmon (DS) staging (r = 0.4466, p = 0.0001). This indicates that as MM progresses, the proportion of bone marrow plasma cells increases, consistent with the findings of Lyu et al. (3). IL-6, as a crucial inflammatory cytokine, promotes plasma cell proliferation and inhibits apoptosis in the bone marrow microenvironment by activating the JAK/STAT3 signaling pathway. Simultaneously, it induces the proliferation of blood vessels and bone marrow plasma cells, thereby accelerating disease progression (6, 13, 14). Our study showed significant differences in IL-6 levels across disease stages (p < 0.05) and a clear positive correlation with DS staging (r = 0.6347, p < 0.0001), suggesting that IL-6 levels rise more markedly during MM progression. Additionally, in patients receiving chemotherapy, the number of bone marrow plasma cells and IL-6 levels were significantly lower than before chemotherapy, with statistical significance (p < 0.05). However, Vit D may reduce inflammatory responses by inhibiting the NF-κB pathway and enhance immunoregulatory functions, thereby delaying the progression of MM (15, 16). Conversely, Vit D levels exhibited a negative correlation with DS staging (r = −0.6312, p < 0.0001), consistent with the results of Simone Donati et al. (4) and Bao et al. (17). We also included correlation analyses between laboratory indicators such as HGB, white blood cell count (WBC), platelet count (PLT), ALB, lactate dehydrogenase (LDH), calcium (Ca), and bone marrow plasma cell count, Vit D, and IL-6. The results showed a positive correlation between Vit D and ALB (r = 0.581, p < 0.05), aligning with the findings of Mirhosseini et al. (18); a negative correlation between IL-6 and HGB (r = −0.556, p < 0.05), consistent with the correlational study by Li et al. (19); and no significant correlation between bone marrow plasma cell count and other laboratory indicators, possibly due to our insufficient sample size. We plan to conduct further research with a larger sample size.
Further analysis in this study indicated that bone marrow plasma cell count, Vit D, and IL-6 all have certain prognostic value in MM, and combined detection can improve the sensitivity and specificity for prognosis, reaching 79.9 and 79.5%, respectively, with an AUC of 0.835 (0.741–0.928). The AUC for combined detection was superior to that of IL-6 (z = 2.148, p = 0.032) and Vit D (z = 1.978, p = 0.042) when assessed individually. Although the combined AUC was also higher than that for plasma cell count alone, the difference was not statistically significant. Based on the cut-off values, a bone marrow plasma cell count greater than 24%, Vit D levels below 26.5 ng/mL, and IL-6 levels above 53.5 pg./mL suggest a high likelihood of poor prognosis, with combined measurement offering greater prognostic significance. The clinical application of combined testing requires stratified analysis according to the treatment phase. During induction therapy, dynamic monitoring of IL-6 levels can assess the response to chemotherapy. In the maintenance phase, Vit D levels may reflect the status of immune recovery. However, for primary healthcare institutions, serological testing for Vit D and IL-6 can be prioritized, with further consideration of bone marrow morphological examination based on threshold values (IL-6 > 53.5 pg./mL, Vitamin D < 26.5 ng/mL). Additionally, based on threshold values for these indicators (plasma cell count > 24%, IL-6 > 53.5 pg./mL, Vitamin D < 26.5 ng/mL), early intervention can be implemented for high-risk patients to improve prognosis.
In summary, bone marrow cell morphology examination can visually assess the changes in tumor cells in MM patients after treatment, and special attention should be paid to patients with special inclusions, advising them to follow up promptly. Further combined examination of Vit D and IL-6 can effectively predict disease progression, providing convenient follow-up medical conditions for elderly patients with mobility issues or residing in remote areas.
This study has certain limitations. Firstly, the relatively small sample size (n = 111) may affect the statistical power and generalization of the results, particularly as no significant correlation was observed between bone marrow plasma cell count and other indicators, which may be related to insufficient sample size. Secondly, the data were sourced from a single center, potentially introducing selection bias. Future studies should expand the sample size and conduct multicenter collaborations to validate the conclusions, while further exploring the complex relationships among the indicators. This study did not delve into the underlying molecular mechanisms, which could be investigated in future research through in vitro experiments or animal models to validate the roles of these pathways in MM.
The reference list from the paper itself. Each links out to its DOI / PubMed record.
- 1Mousavi SE Ilaghi M Aslani A Yekta Z Nejadghaderi SA. A population-based study on incidence trends of myeloma in the United States over 2000-2020. Sci Rep. (2023) 13:20705. doi: 10.1038/s 41598-023-47906-y, PMID: 38001246 PMC 10673923 · doi ↗ · pubmed ↗
- 2Han S Woo S Kim YI Yoon DH Ryu JS. Prognostic value of 18F-fluorodeoxyglucose positron emission tomography/computed tomography in newly diagnosed multiple myeloma: a systematic review and meta-analysis. Eur Radiol. (2021) 31:152–62. doi: 10.1007/s 00330-020-07177-x, PMID: 32809165 · doi ↗ · pubmed ↗
- 3Lyu J Tao Z Li S Zong H Huo H Ma G. Diagnostic and prognostic value of bone marrow plasma cell morphology in patients with plasma cell myeloma. Chin J Lab Med. (2023) 46:473–82.
- 4Donati S Palmini G Aurilia C Falsetti I Marini F Giusti F. Calcifediol: mechanisms of action. Nutrients. (2023) 15:4409. doi: 10.3390/nu 1520440937892484 PMC 10610216 · doi ↗ · pubmed ↗
- 5Wang ME Su T Guo XZ Huang RF Zheng YY Chen GW. Role of total Vitamin D, total procollagen type I amino-terminal propeptide and β-crosslaps in multiple myeloma. Chin J Exp Hematol. (2025) 33:163–7. doi: 10.19746/j.cnki.issn.1009-2137.2025.01.02340017201 · doi ↗ · pubmed ↗
- 6Kumari N Dwarakanath BS Das A Bhatt AN. Role of interleukin-6 in cancer progression and therapeutic resistance. Tumour Biol. (2016) 37:11553–72. doi: 10.1007/s 13277-016-5098-7, PMID: 27260630 · doi ↗ · pubmed ↗
- 7Gao Y Ma G Liu S Teng Y Wang Y Su Y. Thalidomide and multiple myeloma serum synergistically induce a hemostatic imbalance in endothelial cells in vitro. Thromb Res. (2015) 135:1154–9. doi: 10.1016/j.thromres.2015.03.019, PMID: 25840743 · doi ↗ · pubmed ↗
- 8Cai Z Chen WM. Interpretation of treatment of relapsed/refractory multiple myeloma patients in the guidelines for the diagnosis and management of multiple myeloma in China(2022 revision). Zhonghua Nei Ke Za Zhi. (2022) 61:469–73. doi: 10.3760/cma.j.cn 112138-20220414-00278, PMID: 35488595 · doi ↗ · pubmed ↗