Estimating the share of ultra-processed foods in Brazilian municipalities
Leandro Teixeira Cacau, Maria Helena D’Aquino Benicio, Renata Bertazzi Levy, Maria Laura da Costa Louzada, Leandro Teixeira Cacau, Maria Helena D’Aquino Benicio, Renata Bertazzi Levy, Maria Laura da Costa Louzada

TL;DR
This study estimates the caloric share of ultra-processed foods in Brazilian municipalities using a statistical model based on dietary and sociodemographic data.
Contribution
The paper introduces a predictive model to estimate ultra-processed food consumption at the municipal level in Brazil.
Findings
The model showed high accuracy with a concordance correlation coefficient of 0.87.
Municipalities in the South region and São Paulo had higher ultra-processed food consumption (>20%).
Capital cities had higher estimates of ultra-processed food consumption compared to other municipalities in their states.
Abstract
To estimate the caloric share of ultra-processed foods (% UPF) in the 5,570 Brazilian municipalities. The estimation of % UPF in municipalities was performed using a statistical prediction model based on data from 46,164 individuals aged over >10 years who participated in the Household Budget Survey (HBS 2017–2018). Multiple linear regression was used to estimate the average % UPF (measured through two 24-hour dietary recalls) based on predictor variables (sex, age, income, education, race/color, urbanity, federative units, and geographic location). The model's adequacy was assessed through residual analysis and by comparing predicted values with those directly measured in POF 2017–2018 using Lin's concordance correlation coefficient (CCC). The linear coefficients obtained from the multiple linear regression model were applied to the sociodemographic data from the 2010 Census (measured…
Genes, proteins, chemicals, diseases, species, mutations and cell lines named across the full text — each resolved to its canonical identifier and authoritative record.
Click any figure to enlarge with its caption.
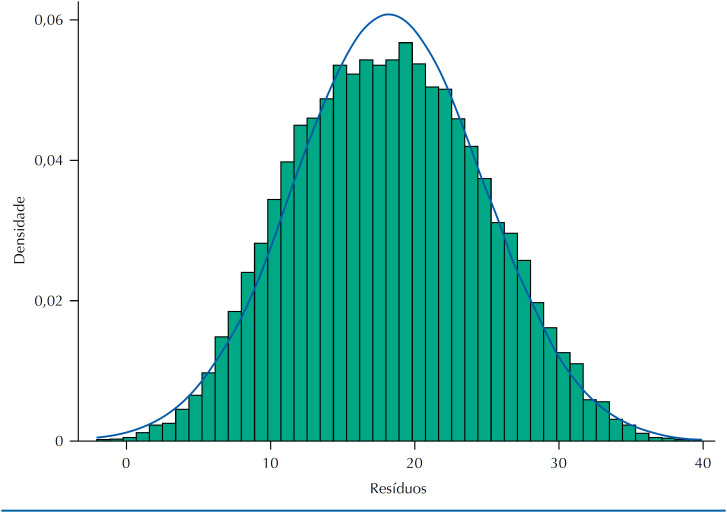 Figure 1
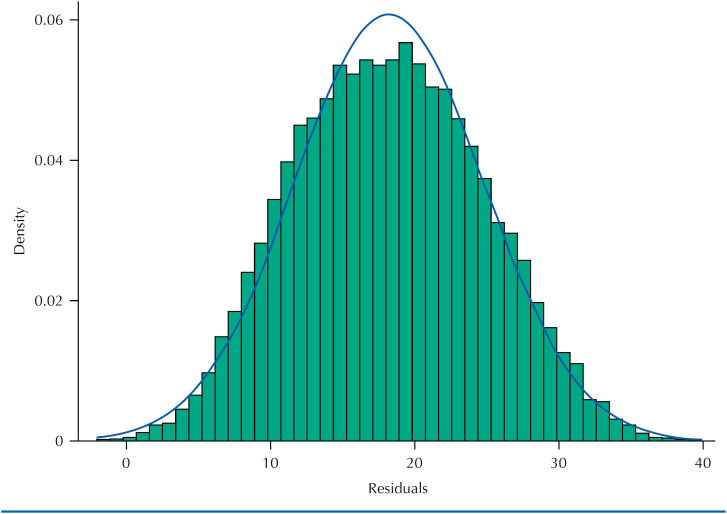 Figure 2
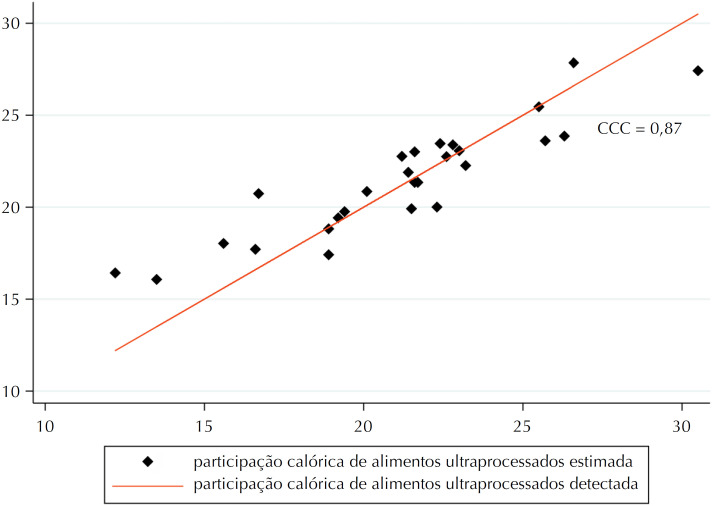 Figure 3
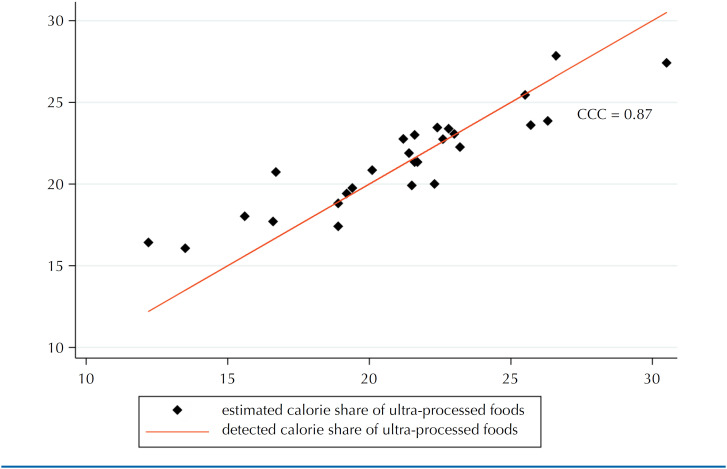 Figure 4
 Figure 5
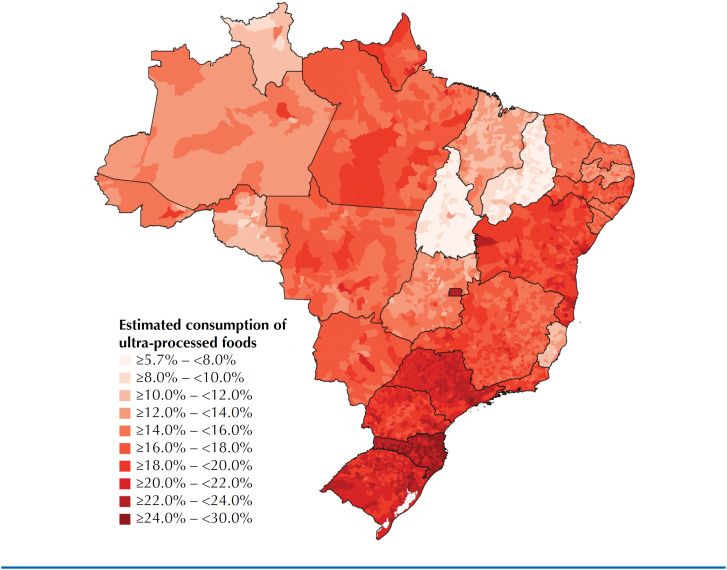 Figure 6
Peer Reviews
No public reviews on file for this paper yet. If you reviewed it on a platform where reviews are public (OpenReview, ICLR, NeurIPS, ICML), you can paste yours below so the community can read it here.
Videos
No videos yet. Explain this paper in a talk, walkthrough, or lecture? Add one.
Taxonomy
TopicsConsumer Attitudes and Food Labeling