The sequence kernel association test for the proportional odds model
Jingxin Yan, Xiaoyu Zhang, Shuying Wang, Jinjuan Wang, Qizhai Li

TL;DR
This paper introduces a new statistical test for analyzing genetic data with ordered categorical outcomes, improving the detection of gene-phenotype associations.
Contribution
The paper introduces POM-SKAT, a novel method for analyzing ordered categorical phenotypes using a proportional odds model.
Findings
POM-SKAT performs well in simulations and detects gene-phenotype associations effectively.
The method was successfully applied to rheumatoid arthritis data, identifying relevant gene variants.
Abstract
The Sequence Kernel Association Test (SKAT) and its extensions are the most popular methods for studying the association between phenotypes and a set of single nucleotide polymorphisms. Their practical application is very wide, but most of these methods are designed for continuous and binary phenotypes. Ordered categorical phenotypes are also very common in practice, so there is an urgent need to develop SKAT-type tests for proportional odds model. To accommodate ordered categorical phenotypes, we propose a test named the Sequence Kernel Association Test for the Proportional Odds Model (POM-SKAT). It constructs a score test for the variance of the coefficients of interest using a quasi-likelihood and the P-value is evaluated by approximating the asymptotic distribution of the test statistic with the Pearson Type III distribution. Simulation studies demonstrate that our method performs…
Genes, proteins, chemicals, diseases, species, mutations and cell lines named across the full text — each resolved to its canonical identifier and authoritative record.
Click any figure to enlarge with its caption.
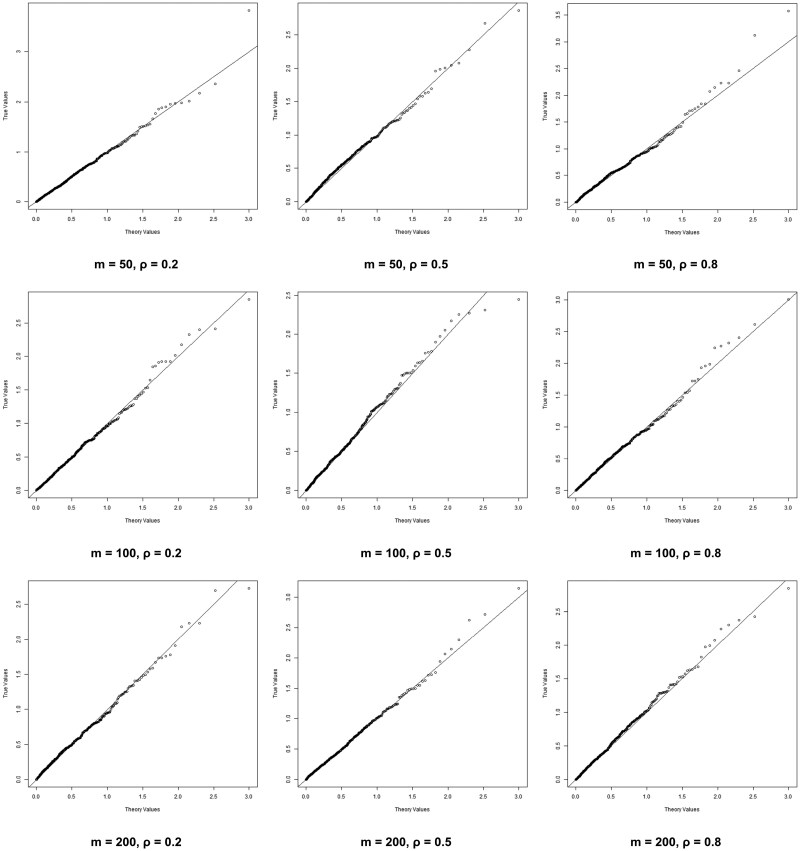 Figure 1
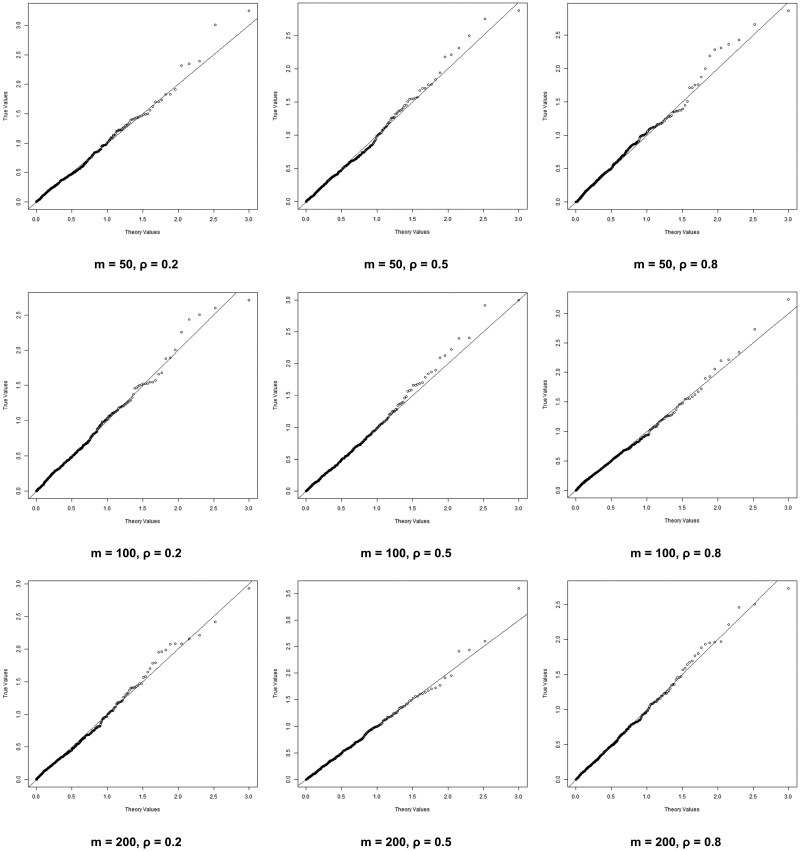 Figure 2
| | |||||||||
|---|---|---|---|---|---|---|---|---|---|
| | |||||||||
|
| 50 | 50 | 50 | ||||||
| | 0.2 | 0.5 | 0.8 | 0.2 | 0.5 | 0.8 | 0.2 | 0.5 | 0.8 |
|
| |||||||||
|---|---|---|---|---|---|---|---|---|---|
|
| 0 | 1 | 2 | 3 | 4 | 5 | 6 | 7 | 8 |
| POM-SKAT | 0.005 | 0.262 | 0.478 | 0.63 | 0.75 | 0.808 | 0.856 | 0.866 | 0.918 |
| PCA | 0.064 | 0.224 | 0.446 | 0.59 | 0.74 | 0.776 | 0.846 | 0.862 | 0.894 |
| BC | 0.05 | 0.306 | 0.478 | 0.57 | 0.658 | 0.662 | 0.742 | 0.786 | 0.81 |
| QT | 0.148 | 0.246 | 0.422 | 0.57 | 0.66 | 0.712 | 0.836 | 0.852 | 0.878 |
|
| |||||||||
|---|---|---|---|---|---|---|---|---|---|
|
| 0 | 1 | 2 | 3 | 4 | 5 | 6 | 7 | 8 |
| POM-SKAT | 0.048 | 0.186 | 0.328 | 0.48 | 0.586 | 0.704 | 0.788 | 0.826 | 0.88 |
| PCA | 0.05 | 0.164 | 0.286 | 0.446 | 0.58 | 0.668 | 0.774 | 0.816 | 0.866 |
| BC | 0.038 | 0.2 | 0.296 | 0.398 | 0.484 | 0.596 | 0.688 | 0.71 | 0.764 |
| QT | 0.144 | 0.192 | 0.296 | 0.43 | 0.554 | 0.638 | 0.754 | 0.85 | 0.876 |
|
|
| |||||
|---|---|---|---|---|---|---|
|
| 30 | 60 | 90 | 30 | 60 | 90 |
| POM-SKAT | 0.796 | 0.764 | 0.744 | 0.774 | 0.752 | 0.738 |
| PCA | 0.782 | 0.750 | 0.738 | 0.766 | 0.726 | 0.716 |
| BC | 0.72 | 0.706 | 0.678 | 0.724 | 0.702 | 0.654 |
| Method | POM-SKAT | Re-sampling | ||||
|---|---|---|---|---|---|---|
|
| 1000 | 2000 | 3000 | 1000 | 2000 | 3000 |
| Time | 3 s | 25 s | 1 min 20 s | 34 min 37 s | 3 h 57 min 19 s | 12 h 52 min 53 s |
| Gene region name |
| POM | MinP | BC | PCA |
|---|---|---|---|---|---|
| CD40 | 31 | 0.0003 | 0.001 | 0.002 | 0.004 |
| CHODL | 98 | 0.195 | 0.27 | 0.503 | 0.072 |
| DGKB | 176 | 0.025 | 0.067 | 0.125 | 0.028 |
| DNAH9 | 89 | 0.112 | 0.395 | 0.39 | 0.109 |
| STAB2 | 89 | 0.0009 | 0.009 | 0.009 | 0.006 |
| UST | 126 | 0.111 | 0.27 | 0.5 | 0.073 |
|
|
|
| |||||||
|---|---|---|---|---|---|---|---|---|---|
|
| 0.2 | 0.5 | 0.8 | 0.2 | 0.5 | 0.8 | 0.2 | 0.5 | 0.8 |
| | 0.058 | 0.046 | 0.058 | 0.046 | 0.052 | 0.044 | 0.052 | 0.056 | 0.048 |
| | 0.046 | 0.044 | 0.048 | 0.05 | 0.048 | 0.05 | 0.042 | 0.056 | 0.054 |
- —National Natural Science Foundation of China10.13039/501100001809
Peer Reviews
No public reviews on file for this paper yet. If you reviewed it on a platform where reviews are public (OpenReview, ICLR, NeurIPS, ICML), you can paste yours below so the community can read it here.
Videos
No videos yet. Explain this paper in a talk, walkthrough, or lecture? Add one.
Taxonomy
TopicsGenetic Associations and Epidemiology · Liver Disease Diagnosis and Treatment · Hepatitis C virus research
1 Introduction
Identifying the relationship between genes and diseases is an important topic in modern genetic studies, which has a profound significance for disease prevention and treatment. Many genetic associations with disease have been identified. For example, alleles in FGFR2 are associated with breast cancer (Hunter et al. 2007), Ahn et al. (2010) found single nucleotide polymorphism (SNP) rs2282679 associated with circulating vitamin D levels, and the genomic region 11p11.2 is associated with schizophrenia (Yue et al. 2011). The association between genes and diseases, combined with proteomics technology and information about the patient’s lifestyle, biomarkers and other factors, can provide patients with more effective and safer personalized treatment. For example, the widely used targeted therapies in oncology, and genetic screening in individuals with a family history of certain hereditary diseases, enable preventive measures to reduce disease risk.
In genome-wide association studies, the genetic association is typically examined by regressing the phenotype onto each individual SNP, and a parametric P-value is generated. However, these tests require strict thresholds, and polygenic and epistatic effects are often present. A number of methods, which can improve the effectiveness of the tests, have been proposed to test the association between gene sets and diseases. Commonly used testing methods include principal component analysis (PCA) (Gauderman et al. 2007), which projects SNPs onto a new coordinate system, maximizes variance through linear transformation; minimum P-value (MinP), which first tests individual SNP, then takes the smallest P-value and uses its empirical distribution to find the P-value for a multi-SNP test; The Sequence Kernel Association Test (SKAT) (Wu et al. 2010) and its variants, which construct test statistics by combining test statistics corresponding to individual gene variants. Variants of SKAT can handle various types of data. For example, Zhao et al. (2015) proposed extended SKAT for dealing with gene–environment interactions, and Zhang et al. (2020) proposed Composite Kernel Association Test (CKAT), which deals with gene and treatment interactions. Ionita-Laza et al. (2013), Chen et al. (2013), and Saad and Wijsman (2014) extended the SKAT approach by various methods to deal with data collected from families. Turkmen and Lin (2021) further extended SKAT to data related to the X chromosome. Wu and Pankow (2016) and Zhan et al. (2017) extended SKAT to analyze multiple phenotypes simultaneously.
Although SKAT and its variants have been well developed in the literature, they are specially designed for continuous and dichotomous phenotypes, while multi-category or ordered categorical phenotypes are often encountered in practice. For example, liver steatosis has three levels, consisting of normal liver, intermediate steatosis, and severe steatosis. The anti-cyclic citrulline peptide (anti-CCP) categorizes four ordered levels of risk for developing rheumatoid arthritis (RA) (Xue et al. 2019). Bocher et al. (2021) reformulated the SKAT test statistic as a weighted sum of the distance between the case center and the sample center, and then extend it to multi-category phenotypes without incorporating covariates. Beyond that we find no other extended SKAT for dealing with multi-category phenotypes within the limits of our search. To fill up this gap, we propose the sequence kernel association test for proportional odds model (POM-SKAT) by combining SKAT with the proportional odds model (POM).
Our POM-SKAT uses the POM to model the relationship between the ordered categorical variable and the explanatory variable and adopts the method in Lin (1997) to construct a score test statistic similar to SKAT. Our approach has three advantages. Firstly, we use the variance component test to convert multiple parameter tests into a single variance parameter test, which simplifies the testing problem. Moreover, we use quasi-likelihood to reduce the model complexity and computational burden for discrete variables, as directly conducting the score test involves different categories and individuals. Finally, we construct a SKAT-type test statistic that follows a mixed chi-square distribution, and its P-value can be found by re-sampling. Here we use the Pearson Type III distribution to approximate it, as its three parameters have explicit expressions, allowing for faster calculations.
We test our approach with data simulations and real data analysis. In the simulation, we construct 18 models under the null hypothesis by varying the number of phenotype categories, the number of considered SNPs, and the correlation among SNPs. We generate the Q–Q plots for all these models, and the results show that the distribution of our test statistic is well approximated by the Pearson Type III distribution. To evaluate the power of our method, we compare it with PCA, Bonferroni correction (BC) and Quadratic test statistic (QT) under the conditions that the number of associated SNPs ranges from 1 to 8. We further explore the scenario in which gene–gene interactions exist. The results show that our method has higher power. Our method together with MinP, BC and PCA are used to analyze some RA data provided by Genetic Analysis Workshop 16 (Amos et al. 2009), which verified the practicability of our method.
2 Materials and methods
Suppose that in a genetic association study, n independent individuals are randomly selected from a source population. For each , let represent an ordered categorical phenotype with a total of J categories. is a vector of K covariates, and is a vector of M genotypes, where denotes the number of m-th minor alleles of the genetic variant for the i-th individual. To model the relationship between , , and , the POM is employed, which is expressed as
where and represent the coefficients for and , respectively. To test the association between phenotype and the genotypes , the following methods are proposed.
2.1 Principal component analysis
PCA is a commonly used dimensionality reduction method. Gauderman et al. (2007) applied it to examine the association between multiple SNPs and binary phenotype, but its availability of ordered categorical phenotypes has not been studied. To apply this method to ordered categorical phenotypes, we first perform a PCA for M SNPs. Assume that the first L principal components collectively capture 80% of the variability in the M genotypes. These components can be expressed as
where are the eigenvectors of the correlation matrix of , and the variances of , correspond to the eigenvalues in decreasing order. Then we construct POM using , which can be expressed as
To test the null hypothesis in this method, the likelihood ratio test (LRT) is applied. The resulting test statistic asymptotically follows a chi-square distribution with L degrees of freedom.
2.2 Minimum P-value
To obtain the minimum P-value, we first test each SNP individually. Specifically, for each genotype m, we construct the POM model as follows, independently,
and use the Student’s t test to get the P-value, for each SNP. The minimum P-value is then defined as . To calculate the final P-value for the multi-SNP test, we employ a permutation approach. Specifically, within each permutation r, we randomly shuffle the phenotype data and calculate the corresponding minimum P-value . Using R random permutations to account for the null distribution, we obtain the empirical distribution of minimum P-values. The P-value of the multi-SNP test is then calculated as the proportion of permutation minimum P-values that are less than or equal to the observed minimum P-value,
The BC is another commonly used method for multiple testing. It allocates a fraction of the overall significance level to each individual test, such that the significance level for each test becomes of the overall level. Consequently, the P-value for multiple testing is adjusted as .
2.3 POM-SKAT
We first use the variance component test to simplify the test problem, assuming that is constant and follows a distribution with mean and variance (Lin 1997). Here is a vector with all zeros and is a linear function of , such that when , and that the third and higher-order moments of are of order . Thus, determining whether there are correlations between the phenotype and the genotypes is equivalent to testing whether the variance of is zero, that is, testing the null hypothesis corresponds to testing .
As derived in the Appendix (Derivation of POM-SKAT test statistics), the test statistic of our method is given by:
where is the phenotype of the n individuals, is the maximum likelihood estimator of expectation under , defined as
and
the specific solution methods for this optimization problem can be found in Agresti (2010) and McCullagh (1980). Here we directly use the polr() in the MASS package of R to get the solution. is the residual matrix from the regression of each genotype m onto , which is used to account for the effects of gene-covariate associations. is the derivative of , according to Wu et al. (2011), we take Beta(MAF, 1/2,1/2)^2^ as , where MAF is the minor allele frequency.
The statistic T follows a mixed chi-square distribution , where are independent random variables following a chi-square distribution with one degree of freedom, and the mixed coefficient are the eigenvalues of . Here is a diagonal matrix with the variance of each under on the diagonal. The P-value of can be approximated by re-sampling, but to increase the speed of calculation, we use Pearson Type III distribution to approximate the distribution of , where is the standardized T.
Pearson Type III distribution (Pearson 1894) includes the normal distribution, the gamma distribution and other distributions, can be used to approximate various statistical distributions. According to Solomon and Stephens (1978), various methods for approximating the mixed chi-square distribution have been proposed, and many authors recommend using methods such as the Pearson III distribution to simplify calculations. Under the conditions of our article, the three parameters a, b, and c depend only on the skewness . Specifically, , and . Moreover, the first three moments of the mixed chi-square distribution mentioned above can be easily calculated using the eigenvalues obtained from the eigen() function in R, where in R code. Thus , and . Then, the P-value of our test statistic is calculated using the ppearsonIII() function from PearsonDS R package, that is, .
3 Simulation studies
We conduct simulation studies to assess the accuracy of using the Pearson Type III distribution to approximate the asymptotic distribution of under the null hypothesis. Due to the computational intensity of MinP, we do not compare its power in the simulations. Its performance will be compared with other methods in the real data analysis.
3.1 Type I error
To evaluate the type I error of the proposed method, we generate genotypes under the null hypothesis, that is . We use a two-step process to generate genotypes. First, we generate from a multivariate normal distribution with mean and covariance , where i and j are the indices of the elements. Based on the MAF, f, we then calculate the two quantiles of the standard normal distribution corresponding to and , dividing the sample space into three intervals. In the second step, the genotype count 0, 1, and 2 is then assigned based on the interval containing the sample. For example, if is the frequency of the first SNP, the two quantiles of the standard normal distribution corresponding to and are denoted as and . If , then ; if , then ; and if , then . Here the MAF consists of M equally spaced values from the range [0.1, 0.45]. We set covariates , and the error term . The phenotype is generated using a process similar to genotype generation. Specifically, we first calculate the phenotype as , where . The ordered categorical phenotype is then obtained by truncating at the quantile threshold values . Depending on J, M and , we created 18 scenarios for our simulation. The different combinations are shown in Table 1, where or 5; , or 200; and or 0.8. We set and ; and , for and 5, respectively.
It is known that P-values follow the uniform distribution under the null hypothesis. To check the accuracy of our methods, we conduct 500 repeated experiments and plot the Q–Q plots comparing the theoretical and observed P-values. For a more detailed comparison, we apply a transformation to the P-values and present the results in Figs 1 and 2. Figure 1 presents the results for , while Fig. 2 corresponds to . In both figures, the number of SNPs is fixed within each row, while the correlation between genotypes is fixed within each column. In each plot, the horizontal axis represents the theoretical P-values, while the vertical axis represents the observed P-values. In all Q–Q plots, the points are observed to almost fall on the diagonal, indicating that our simulation results are highly accurate. Table 7 in the appendices summarizes the Type I errors in the above scenarios, demonstrating desirable results. These results confirm the validity of our POM-SKAT and support the use of the Pearson Type III to approximate the null distribution.
Q–Q plot of scenarios that J=3 and n=2000.
Q–Q plot of scenarios that J=5 and n=3000.
3.2 Power
We generate data under the alternative hypothesis to compare the power of POM-SKAT with BC and PCA. To compare them with the classical method of hypothesis testing, we also construct a QT statistic for the results, which follows a chi-square distribution with degrees of freedom equal to the number of SNPs. The simulation settings are almost identical to those used under Type I Error analysis, except that we randomly select M SNPs from the CHODL genes, for which genotype data were provided by the Genetic Analysis Workshop 16, and we randomly select B SNPs and make them associated with phenotypes. Specifically, the phenotypes are first calculated as , where and , and the ordered categorical phenotypes are then obtained by truncating using the same method as described earlier. We set , choose B from 1 to 8, and fix .
The power of the four methods is shown in Tables 2 and 3. The results show that the classical method fails when the number of SNPs is large, and its ability to control Type I error worsens as the number increases. For all other three methods, power increases as the number of SNPs associated with the phenotype (B) increases when the total number of SNPs (M) is fixed. Conversely, for a fixed B, power decreases as M increases. The power of our method is higher than the power of PCA and BC across nearly all scenarios. The advantage of POM-SKAT over PCA is more pronounced when the number of phenotypically associated SNPs is small. The advantage of POM-SKAT and PCA over BC is more pronounced when the number of phenotype-associated SNPs is large. For instance, for , the powers of the POM-SKAT and PCA are 0.704 and 0.668, respectively, with a difference of 0.036. For , the powers of the POM-SKAT and BC are 0.792 and 0.624, respectively, with a difference of 0.168. In addition, PCA has stronger requirements on sample size, and only when the sample size is large, PCA can better estimate the main component. Then, for fixed n, the advantage of POM-SKAT over PCA becomes more pronounced as M increases correspondingly.
To test whether our method is robust in the presence of gene–gene interactions, we perform additional simulations. The simulation setting is the same as in the above power simulations, except that we fix and add an interaction term between the first two SNPs. That is , where , and . Then we truncate the values to obtain the ordered categorical phenotypes. Since QT does not perform well, we only simulate the other three methods. The results are shown in Table 4, which illustrates that POM-SKAT still outperforms PCA and BC.
3.3 Computation time
The Pearson Type III distribution is used to approximate the mixed chi-square distribution instead of re-sampling to save calculation time. To compare the calculation time of POM-SKAT and re-sampling, a simulation study was conducted. When simulate the computation time of POM-SKAT, the settings are similar to those used in the Type I error, except that the process is performed only once without repetition. For the re-sampling computation time, H permutations of is performed. In each permutation, the replaced and the original and are used to create a new sample and the value of T is re-evaluated using (2). Finally, the result from H permutations is used as the re-sampling p-value of the empirical distribution of T.
Simulations are performed with , and under the condition , and for re-sampling. The results, summarized in Table 5, demonstrate that the computation time required for POM-SKAT is significantly less than that for re-sampling, particularly for larger n. In these simulations, we conducted 10 000 permutations for each scenario. It is worth noting that there are theoretically possible phenotypic permutations. As n increases, the number of permutations required to achieve reliable results grows correspondingly, leading to a substantial increase in the computational burden for re-sampling methods.
4 Real data analysis
RA has been shown to be a genetically linked disease. Anti-CCP is an effective predictor of RA. Higher anti-CCP levels are associated with an increased risk of developing RA. Specifically, anti-CCP level below 20, between 20 and 39, between 40 and 59, and over 60 corresponding to: without RA, low risk, moderate risk, and high risk. Studying the association between genetic variation and RA through its relationship with anti-CCP is a logical approach. Data form the Genetic Analysis Workshop 16 (Amos et al. 2009) is used for a genome-wide association analysis of RA, consisting of genotypes from 2062 individuals. Additionally, the dataset includes patients’ affection status with RA, sex, the anti-CCP titer and the genetic information. To identify genetic variants associated with RA using our method, we divide the sample into four categories based on the aforementioned anti-CCP criteria as response variables, each category contain 1195, 103, 66, and 698 samples, respectively. Since females are generally at higher risk of RA than males, sex is included as a covariate. We select six regions (Raychaudhuri et al. 2008, Lin et al. 2009) such as CD40, CHODL, and DGKB from the data as gene variation sets and test them separately with our method and three compared methods, the results are presented in Table 6. For MinP, 2000 permutations of anti-CCP are performed, while for PCA, the top 80% principal components are selected.
The results indicate that the conclusions are mostly consistent across methods, except for DGKB, where BC and MinP produce larger P-values, providing insufficient evidence to reject the null hypothesis under the significance level 0.05. However, the P-value of DGKB tested by POM-SKAT and PCA allow rejection of the null hypothesis at the same significance level. The P-values of CD40 and STAB2 are small, which means we can reject the null hypothesis, concluding that variations in these regions are associated with RA. And it can be seen that the P-value of our method is smaller when testing CD40 and STAB2, that is, 0.0003 and 0.0009 of our method, while MinP takes 0.001 and 0.009, BC takes 0.002 and 0.009, and PCA takes 0.004 and 0.006, meaning that our method is better at identifying relevant variants. The P-values of all four methods for CHODL, DNAH9, and UST are too big to reject the null hypothesis. Most of our results are consistent with the previous literature (Amos et al. 2009), which provides the data, indicates that CD40 has been implicated in Caucasian rheumatoid arthritis populations. Additionally, we identify DGKB and STAB2, which are recognized by Lin et al. (2009).
5 Discussion
We proposed the POM-SKAT to test the association between ordered categorical phenotypes and a set of SNPs, which is an extension of the widely used SKAT. To model the relationship between phenotypes and SNPs, we adopt the proportional odds model. As a multiple testing method, it involves testing all the coefficients of the SNPs in the set. To simplify this, we adopt the variance component test, which reduces the problem to testing only one parameter corresponding to their variance. To construct a score test statistic, for which only one parameter estimation is required under the null hypothesis, we use the quasi-likelihood. The Pearson Type III distribution, which can approximate any distribution by adjusting its three parameters, is employed to approximate the asymptotic distribution of the test statistic, saving computation time and simplifying calculations. Simulation results demonstrate that our POM-SKAT achieves good model fitting and high statistical power. The POM-SKAT shares a uniform form with SKAT and other extended SKAT methods. Similar to other SKAT test statistics, the central component (excluding the phenotypes and their expectations) can be seen as a kernel, which may be replaced by other kernels.
In our test statistic T, the -th element of is , where is the -th element of . This is equivalent to using a weighted linear kernel to process individual genetic data, which assumes that the effects of SNPs on phenotypes are independent of each other. We can handle SNP interactions by choosing other kernel functions. Many kernel functions have been proposed to handle SNP interactions, for example, the Gaussian kernel, identity by state (IBS) kernel and inner product-based kernel have been separately used by Wu et al. (2010) and Wang et al. (2023). However, it is worth noting that the performance and computational efficiency of different kernels vary under different SNP relationships. Under the current settings, the performance of other kernels is suboptimal.
Currently, the SNPs under study are common variants, but rare variants are also frequently studied, with extensive literature available on this topic. For example, Wu et al. (2011) extended the SKAT to test association between rare variants and binary phenotype. Lin et al. (2016) and Lim et al. (2020) increased consideration of gene–environment interaction. Oualkacha et al. (2013) took into account the data from families, Yan et al. (2015) even considered the longitudinal family data. Urrutia et al. (2015) and Posner et al. (2020) extended SKAT by handling multiple candidate kernels. Lee et al. (2017) considered cases with multiple phenotypes. However, methods to test the association between rare variants and ordered categorical phenotypes remind blank, presenting a potential area for future development. When rare variants are considered, the sample size increases significantly, leading to greater computational difficulty and longer computation time. SKAT and its extended methods often incorporate additional strategies when addressing rare variants, which presents another avenue for future research.
Pleiotropy is a common phenomenon in organisms, where a single gene usually affects multiple phenotypes. For example, from Ensembl (https://www.ensembl.org), we know that ASAH1 is associated with Farber disease and spinal muscular atrophy associated with progressive myoclonic epilepsy. O'Reilly et al. (2012) proposed MultiPhen, which constructed the likelihood ratio test using the proportional dominance model, to test the association between gene variants and continuous or binary phenotypes. But how to take ordered categorical phenotypes into consideration reminds unsolved. In this case, genotypes can be considered as ordered categorical variables, and the phenotypes are explanatory variables, which looks can be solved by our method. The difficulty is, in our POM-SKAT, genotypes only have three levels, but phenotypes can be continuous, binary or multi-level with or without order. The form and value of covariate matrix for phenotypes need to be studied and solved again.
6 Appendix
6.1 Derivation of POM-SKAT test statistic
Then the expectation and variance of , , will be,
We set , , and for simplicity. Thus, we have , where h is a monotonically increasing function of and has the form
which can be solved by the variance component score test (Lin 1997).
To test , we first use the quasi-likelihood, and the integrated quasi-likelihood is
where
Consider as the expectation of , and take a quadratic expansion about at the truth , we have
where is an vector with elements and is an diagonal matrix with elements on the diagonal. Let’s set and be diagonal matrices with elements
where and .
Then, under , the initial score test statistic will be
According to Zhang and Lin (2003), the second part of (6) is unrelated to Y, and the first part of (6) follows a mixed chi-square distribution. Since the part related to and only affects the mixing coefficients, we can further simplify U to T.
Conflict of interest: The authors declare that they have no competing interests.
The reference list from the paper itself. Each links out to its DOI / PubMed record.
- 1Agresti A. Analysis of Ordinal Categorical Data. Hoboken, NJ: John Wiley & Sons, 2010.
- 2Ahn J , Yu K, Stolzenberg-Solomon R et al Genome-wide association study of circulating vitamin D levels. Hum Mol Genet 2010;19:2739–45.20418485 10.1093/hmg/ddq 155PMC 2883344 · doi ↗ · pubmed ↗
- 3Amos CI , Chen WV, Seldin MF et al Data for Genetic Analysis Workshop 16 Problem 1, association analysis of rheumatoid arthritis data. BMC Proc 2009;3 Suppl 7:S 2.10.1186/1753-6561-3-s 7-s 2PMC 279591620018009 · doi ↗ · pubmed ↗
- 4Bocher O , Marenne G, Tournier-Lasserve E et al; FREX Consortium. Extension of SKAT to multi-category phenotypes through a geometrical interpretation. Eur J Hum Genet 2021;29:736–44.33446828 10.1038/s 41431-020-00792-8PMC 8110546 · doi ↗ · pubmed ↗
- 5Chen H , Meigs JB, Dupuis J. Sequence kernel association test for quantitative traits in family samples. Genet Epidemiol 2013;37:196–204.23280576 10.1002/gepi.21703 PMC 3642218 · doi ↗ · pubmed ↗
- 6Gauderman WJ , Murcray C, Gilliland F et al Testing association between disease and multiple SN Ps in a candidate gene. Genet Epidemiol 2007;31:383–95.17410554 10.1002/gepi.20219 · doi ↗ · pubmed ↗
- 7Hunter DJ , Kraft P, Jacobs KB et al A genome-wide association study identifies alleles in FGFR 2 associated with risk of sporadic postmenopausal breast cancer. Nat Genet 2007;39:870–4.17529973 10.1038/ng 2075 PMC 3493132 · doi ↗ · pubmed ↗
- 8Ionita-Laza I , Lee S, Makarov V et al Family-based association tests for sequence data, and comparisons with population-based association tests. Eur J Hum Genet 2013;21:1158–62.23386037 10.1038/ejhg.2012.308PMC 3778346 · doi ↗ · pubmed ↗