Magnitude, associated risk factor and awareness of predisposing factors, treatment, and prevention of overweight/obesity among adults in North Wollo zone, Northeast Ethiopia
Aychew Kassa Belete, Yeshiwas Jemberu Asefa, Birhan Ambachew Taye

TL;DR
This study in Ethiopia found that 21.3% of adults are overweight or obese and highlights poor awareness of risk factors and prevention methods.
Contribution
The study provides new insights into the prevalence and awareness gaps of overweight/obesity in North Wollo, Ethiopia.
Findings
Overweight/obesity affected 21.3% of the population in North Wollo.
Most participants were unaware of key risk factors like family history and stress.
Many were unaware of effective prevention methods such as sufficient sleep and stress reduction.
Abstract
Bad eating habits and an insufficient amount of body activity can contribute to obesity and overweight. This study looked at the prevalence, related risk factors, awareness of predisposing factors and also the avoidance and management of overweight and obesity in North Wollo, Northeast Ethiopia. From January 2022 to January 2023, A cross-sectional community survey was carried out with 1084 respondents aged 18 and above in North Wollo, Northeast Ethiopia. A multi-stage sampling technique was employed to recruit participants for the quantitative study, while a convenience sampling technique was employed for the qualitative study. A structured questionnaire that had been pre-tested was utilized to gather quantitative data, while qualitative data was collected using an interview. Body mass index was used to determine overweight and obesity. We employed ordinal logistic regression to…
Genes, proteins, chemicals, diseases, species, mutations and cell lines named across the full text — each resolved to its canonical identifier and authoritative record.
Click any figure to enlarge with its caption.
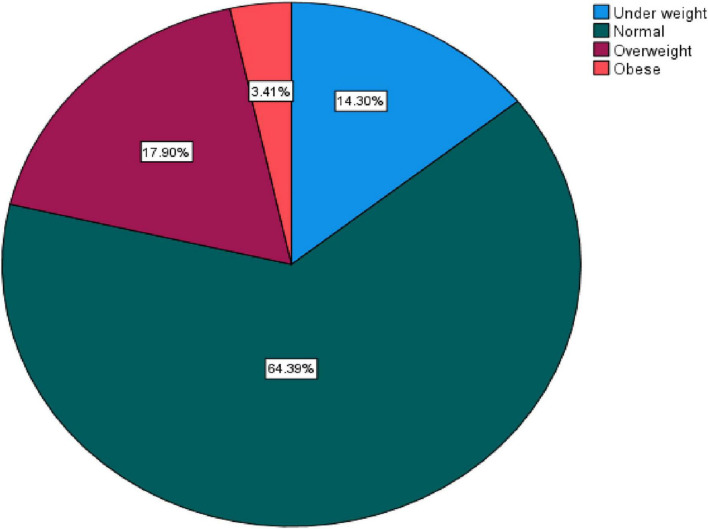 FIGURE 1
| Variable | Categories | Frequency | Percentage |
| Age | 18–29 | 575 | 53.1% |
| 30–49 | 407 | 37.5% | |
| 50 and above | 102 | 9.4% | |
| Sex | Women | 377 | 34.8% |
| Men | 707 | 65.2% | |
| Marital status | Married | 364 | 33.6% |
| Single | 602 | 55.5% | |
| Divorced | 83 | 7.7% | |
| Widowed | 35 | 3.2% | |
| Educational status | Unable to read and write | 156 | 14.4% |
| Primary | 214 | 19.7% | |
| Secondary | 316 | 29.2% | |
| Collage and above | 398 | 36.7% | |
| Occupational status | Merchant | 210 | 19.4% |
| Government worker | 463 | 42.7% | |
| Student | 292 | 26.9% | |
| Farmer | 94 | 8.7% | |
| Others | 25 | 2.3% | |
| Monthly family income | Less than 2,000 ETB | 202 | 18.6% |
| 2,000–4000 ETB | 445 | 41.1% | |
| 4,000–6,000 ETB | 176 | 16.2% | |
| More than 6,000 ETB | 261 | 24.1% |
| Variables | Categories | Frequency | Percentage |
| Stress | Never | 718 | 66.2% |
| Currently | 246 | 22.7% | |
| Previously | 120 | 11.1% | |
| Type of oil most often used | Unsaturated | 572 | 52.8% |
| Saturated | 512 | 47.2% | |
| Adequate sleep | No | 530 | 48.9% |
| Yes | 554 | 51.1% | |
| Physical activity level | Sedentary | 369 | 34.0% |
| Fairly active | 293 | 27.0% | |
| Active | 422 | 38.9% | |
| Smoking | Never | 857 | 79.1% |
| Currently | 75 | 6.9% | |
| Previously | 152 | 14.0% | |
| Frequency of drinking alcohol per weak | Never | 515 | 47.5% |
| Less than 3 | 246 | 22.7% | |
| More than 3 | 323 | 29.8% | |
| Vegetable consumption per a weak | Never | 437 | 40.3% |
| Less than 3 | 492 | 45.4% | |
| More than 3 | 155 | 14.3% | |
| Fruit consumption per a weak | Never | 308 | 28.4% |
| Less than 3 | 336 | 31.0% | |
| More than 3 | 440 | 40.6% | |
| Family history of obesity | Yes | 424 | 39.1% |
| No | 660 | 60.9% |
| Variable | Categories | Frequency | Percentage |
| lack of adequate sleep | Yes | 456 | 42.1% |
| No | 628 | 57.9% | |
| Stress | Yes | 185 | 17.1% |
| No | 899 | 82.9% | |
| Medication | Yes | 455 | 42.0% |
| No | 629 | 58.0% | |
| Lack of physical activity | Yes | 899 | 82.9% |
| No | 185 | 17.1% | |
| Smoking | Yes | 190 | 17.5% |
| No | 894 | 82.5% | |
| Low socioeconomic status | Yes | 300 | 28.0% |
| No | 784 | 72.0% | |
| Low Intake of Fruit | Yes | 250 | 23.0% |
| No | 834 | 77.0% | |
| Low Intake of vegetable | Yes | 400 | 37.0% |
| No | 684 | 63.0% | |
| High consumption of saturated fat | Yes | 568 | 52.4% |
| No | 516 | 47.6% | |
| Age | Yes | 456 | 42.1% |
| No | 628 | 57.9% | |
| Family history | Yes | 170 | 16.0% |
| No | 914 | 84.0% |
| Variable | Categories | Frequency | Percentage |
| Making adequate sleep | Yes | 456 | 42.1% |
| No | 628 | 57.9% | |
| Reducing stress | Yes | 185 | 17.1% |
| No | 899 | 82.9% | |
| Managing Medication | Yes | 455 | 42.0% |
| No | 629 | 58.0% | |
| Being physical active | Yes | 899 | 82.9% |
| No | 185 | 17.1% | |
| Stop smoking | Yes | 190 | 17.5% |
| No | 894 | 82.5% | |
| Good socioeconomic status | Yes | 300 | 28.0% |
| No | 784 | 72.0% | |
| High Intake of fruit | Yes | 250 | 23.0% |
| No | 834 | 77.0% | |
| High Intake of vegetable | Yes | 400 | 37.0% |
| No | 684 | 63.0% | |
| Low consumption of saturated fat | Yes | 568 | 52.4% |
| No | 516 | 47.6% |
| Variable | Categories | Frequency | Percentage |
| Regular exercise | Yes | 600 | 55.4% |
| No | 484 | 44.6% | |
| Making well informed nutrition | Yes | 386 | 35.6% |
| No | 698 | 64.4% | |
| Weight loss medication | Yes | 283 | 26.1% |
| No | 801 | 73.9% | |
| Weight loss surgery | Yes | 337 | 31.1% |
| No | 747 | 68.9% |
| Variables | Body mass index | COR (95% CI) | AOR (95% CI) | Sig. | |||
| Under weight | Normal | Over Wight | Obese | ||||
|
| |||||||
| 18–29 | 86(55.5) | 407(58.3) | 81(41.8) | 1(2.7) | 0.15(0.10–0.23) | 0.07(0.04–0.13) |
|
| 30–49 | 58(37.4) | 252(36.1) | 88(45.4) | 9(24.3) | 0.22(0.14–0.34) | 0.16(0.09–0.29) |
|
| >50 | 11(7.1) | 39(5.6) | 25(12.9) | 27(73.0) | 1 | ||
|
| 1 | ||||||
| Men | 127(81.9) | 147(21.1) | 85(43.8) | 18(48.6) | 0.49(0.37–0.63) | 0.22(0.09–0.50) |
|
| Women | 28(18.1) | 551(78.9) | 109(56.2) | 19(51.4) | 1 | ||
|
| 1 | ||||||
| Married | 135(87.1) | 185(26.5) | 23(11.9) | 21(56.8) | 0.04(0.02–0.08) | 0.13(0.04–0.38) |
|
| Single | 16(10.3) | 499(71.5) | 87(44.8) | 0(0.0) | 0.20(0.10–0.38) | 0.36(0.12–1.08) | 0.069 |
| Divorced | 1(0.6) | 3(0.4) | 64(33.0) | 15(40.5) | 4.84(2.18–10.73) | 5.73(2.04–16.05) |
|
| Widowed | 3(1.9) | 11(1.6) | 20(10.3) | 1(2.7) | 1 | ||
|
| 1 | ||||||
| Unable to read and write | 20(12.9) | 87(12.5) | 30(15.5) | 19(51.4) | 0.90(0.62–1.30) | 3.44(1.90–6.22) |
|
| Primary | 44(28.4) | 158(22.6) | 10)5.2) | 2(5.4) | 0.23(0.16–0.34) | 31.22(13.12–74.29) |
|
| Secondary | 46(29.7) | 243(34.8) | 27(13.9) | 0(0.0) | 0.32(0.23–0.44) | 0.35(0.18–0.67) |
|
| College and above | 45(20.9) | 210(30.1) | 127(65.5) | 16(43.2) | 1 | ||
|
| 1 | ||||||
| Merchant | 2(1.3) | 118(16.9) | 72(37.1) | 18(48.6) | 0.95(0.42–2.11) | 0.93(0.29–2.98) | 0.903 |
| Government worker | 16(10.3) | 344(49.3) | 95(49.0) | 8(21.6) | 0.37(0.17–0.81) | 0.76(0.25–2.26) | 0.619 |
| Student | 121(78.1) | 160(22.9) | 9(4.6) | 2(5.4) | 0.03(0.01–0.07) | 0.11(0.03–0.40) |
|
| Farmer | 12(7.7) | 68(9.7) | 8(4.1) | 6(16.2) | 0.18(0.07–0.44) | 0.27(0.08–0.88) |
|
| Others | 4(2.6) | 8(1.1) | 10(5.2) | 3(8.1) | 1 | ||
|
| 1 | ||||||
| <2,000 ETB | 80(51.6) | 115(16.5) | 5(2.6) | 2(5.4) | 0.02(0.01–0.04) | 0.09(0.04–0.21) |
|
| 2,000–4,000 ETB | 60(38.7) | 351(50.3) | 28(14.4) | 6(16.2) | 0.09(0.06–0.12) | 0.07(0.03–0.14) |
|
| 4,000–6,000 ETB | 12(7.7) | 116(16.6) | 39(20.1) | 9(24.3) | 0.31(0.21–0.46) | 0.36(0.19–0.67) |
|
| >6,000 | 3(1.9) | 116(16.6) | 122(62.9) | 20(54.1) | 1 | ||
|
| 1 | ||||||
| Never | 145(93.5) | 536(76.8) | 29(14.9) | 8(21.6) | 0.07(0.05–0.11) | 0.22(0.12–0.40) |
|
| Currently | 3(1.9) | 103(14.3) | 127(65.5) | 13(35.1) | 1.41(0.92–2.14) | 0.88(0.49–1.57) | 0.663 |
| Previously | 7(4.5) | 59(8.5) | 38(19.6) | 16(43.2) | 1 | ||
|
| 1 | ||||||
| Unsaturated | 64(41.3) | 465(66.6) | 43(22.2) | 0(0.0) | 0.41(0.32–0.53) | 0.61(0.38–0.98) |
|
| Saturated | 91(58.7) | 233(33.4) | 151(77.8) | 37(100) | 1 | ||
|
| 1 | ||||||
| No | 98(63.2) | 295(42.5) | 116(59.8) | 21(56.8) | 1.05(0.82–1.33) | 1.25(0.82–1.89) | 0.301 |
| Yes | 57(36.8) | 403(57.7) | 78(40.2) | 16(43.2) | 1 | ||
|
| 1 | ||||||
| Active | 106(68.4) | 129(18.5) | 112(57.7) | 22(59.5) | 1.11(0.83–1.47) | 0.40(0.25–0.64) |
|
| Fairly active | 43(27.7) | 191(27.4) | 44(22.7) | 15(40.5) | 0.99(0.73–1.34) | 0.27(0.16–0.46) |
|
| Sedentary | 6(3.9) | 378(54.2) | 38(19.6) | 0(0.0) | 1 | ||
|
| 1 | ||||||
| Never | 132(85.2) | 594(85.1) | 129(66.5) | 2(5.4) | 0.30(0.21–0.43) | 0.40(0.25–0.67) |
|
| Currently | 7(4.5) | 27(3.9) | 29(14.9) | 12(32.4) | 1.82(1.08–3.09) | 1.35(0.64–2.84) | 0.433 |
| Previously | 16(10.3) | 77(11.0) | 36(18.6) | 23(62.2) | 1 | ||
|
| 1 | ||||||
| Never | 110(71.0) | 365(52.3) | 40(20.6) | 0(0.0) | 0.19(0.14–0.26) | 0.15(0.09–0.24) |
|
| <3 | 21(13.5) | 152(21.8) | 58(29.9) | 15(40.5) | 0.75(0.54–1.04) | 0.18(0.10–0.32) |
|
| >3 | 24(15.5) | 181(25.9) | 96(49.5) | 22(59.5) | 1 | ||
|
| 1 | ||||||
| Never | 19(12.3) | 283(40.5) | 99(51.0) | 36(97.3) | 1.21(0.83–1.75) | 0.89(0.51–1.55) | 0.687 |
| <3 | 118(76.1) | 331(47.4) | 42(21.6) | 1(2.7) | 0.24(0.16–0.35) | 0.52(0.31–0.87) |
|
| >3 | 18(11.6) | 84(12.0) | 53(27.3) | 0(0.0) | 1 | ||
|
| 1 | ||||||
| Never | 102(65.8) | 75(10.7) | 115(59.3) | 16(43.2) | 1.37(1.01–1.84) | 0.39(0.24–0.63) |
|
| <3 | 34(21.9) | 234(33.5) | 55(28.4) | 13(35.1) | 1.28(0.96–1.72) | 1.42(0.89–2.25) | 0.137 |
| >3 | 19(12.3) | 389(55.7) | 24(12.4) | 8(21.6) | 1 | ||
|
| 1 | ||||||
| Yes | 29(18.7) | 205(29.4) | 158(81.4) | 32(86.5) | 8.06(5.95–10.92) | 4.07(2.37–6.99) |
|
| No | 126(81.3) | 493(70.6) | 36(18.6) | 5(13.5) | 1 | ||
Peer Reviews
No public reviews on file for this paper yet. If you reviewed it on a platform where reviews are public (OpenReview, ICLR, NeurIPS, ICML), you can paste yours below so the community can read it here.
Videos
No videos yet. Explain this paper in a talk, walkthrough, or lecture? Add one.
Taxonomy
TopicsObesity, Physical Activity, Diet · Child Nutrition and Water Access · Birth, Development, and Health
Introduction
Overweight is having a BMI of between 25 and 29.9 kg/m^2^, whereas obesity is defined as having a BMI of 30 kg/m^2^ or higher (1). Both disorders are characterized by a fat buildup that is abnormal or excessive in the body. BMI is a straightforward measurement and a widely used to estimate overall body composition within a population (2).
Over the last few years, prevalence of obesity has risen globally (3). According to a report from the World Health Organization (WHO), more than 1.9 billion persons were overweight in 2016, with over 650 million being obese (4). This means that globally, around 13% of adults were obese in 2016 (5). Obesity rates vary greatly across areas and countries. Obesity is more common in high-income countries such as the United States, Canada, and Australia than in countries with low and moderate incomes (6). However, the incidence of obesity is fast increasing in many countries with low and moderate incomes, particularly in metropolitan areas (7).
Overweight and obesity have also become more prevalent in Africa in recent years. According to the WHO, over 38% of persons in Africa were overweight or obese in 2016 (8). In North Africa, the occurrence of obesity is generally higher than in other regions, with countries such as Egypt and Tunisia having obesity rates of over 30% (9). Obesity prevalence in Ethiopia was found to be relatively low compared to other Sub-Saharan African countries, according to a 2016 study published in the International Journal of Environmental Research and Public Health. In accordance with the survey, the incidence of obesity among women was 5.9 and 1.7% among males (10). However, it is crucial to highlight that the frequency of obesity may have increased in recent years as a result of changes in lifestyle and nutrition patterns, urbanization, and other factors. Furthermore, there may be differences in obesity rates between different locations and populations within Ethiopia. Age, gender, family history, an unhealthy lifestyle, and physical inactivity have either direct or indirect effects on obesity (11–13). Recent research by Kumer A. suggests that regular physical activity, eating more fruits and vegetables, lowering saturated fat, quitting smoking, and managing stress all play important roles in the prevention of overweight/obesity (14, 15).
Sedentary life style have been linked to a variety of health issues, including cardiovascular disease, musculoskeletal illnesses, cancer, lung disorders, mental disorder, spinal deformity, and metabolic disorders (16, 17). Several factors, such as awareness, attitudes, sociodemographic traits, behavioral patterns, and biomedical factors, can play a role in the development of overweight and obesity Biomedical factors that can be measured in relation to overweight and obesity include body mass index (BMI), which estimates body composition based on height and weight, and waist circumference, a measure of abdominal fat that indicates risk for metabolic conditions (18). Despite increasing these risk factors, limited data can be found about the prevalence and awareness of the population regarding risk factors and the prevention and treatment of obesity/overweight in Ethiopia, Although there is an increase in sedentary life and unhealthy diet, alcohol intake, and smoking, which can cause different metabolic disorder in Ethiopia (19, 20), there is no single study that has assessed the community’s awareness of risk factors and the prevention and treatment of obesity/overweight. As a result, this study was aimed at assessing the prevalence and awareness of risk factors and the prevention and treatment of obesity among adults who live in Northeast Ethiopia.
Materials and methods
Study setting, design, period, and population
From January 2022 to January 2023, a community-based cross-sectional survey was conducted among 1,084 persons aged 18 and above in North Wollo, Northeast Ethiopia. Both qualitative and quantitative research approach was applied. North Wollo is one of Amhara National Regional State’s eleven Zones. North Wollo was named after the past region of Wollo. South Wollo borders North Wollo on the south, South Gondar on the west, Wag Hemra on the north, Tigray Region on the northeast, and Afar Region on the east. Woldia is a province in the North Wollo Zone. Woldia is the capital of the north Wollo Zone. According to the Central Statistics Agency of Ethiopia’s (CSA) 2007 Census, Total population of North Wollo is 1,500,303 people, with 752,895 men and 747,408 women. The greater part of the population adhered to Ethiopian Orthodox Christianity, with 80.49% identifying as such, while 18.46% identified as Muslim. The populations were all adults aged 18 and over living in the North Wollo Zone.
Inclusion and exclusion criteria
This study included all persons aged 18 and above who had lived in the district for 6 months or more; those with significant sickness, mental illness, refusal to reply to the questionnaire, and women with known pregnancy were omitted.
Sample size determination and sampling technique
In this research, multi- stage, stratified probability sampling technique was applied. Of the 1,838,753 residents in the North Wollo zone as estimated in 2015, 726,657 were adults age above 18 years. From target population of 726,657, we used 1,084 respondents using the Cochran formula. The probability of success and failure will take 0.5 each and margin of error was taken 3%.
Using this formula total sample size is determined below:
The final calculated sample size was 1,084. A two-stage sampling design was used to select study participants. First stage, The sample size was allocated to each of the selected kebeles using probability proportional to size allocation. Second stage, 1,084 households meeting the inclusion criteria were selected using systematic random sampling. The first household was chosen using a lottery method, and subsequently, every tenth household was recruited. If there was more than one eligible adult in a household, one individual was selected at random using the lottery method. Ultimately, a total of 1,084 adults participated in the study.
Definitions and measurement
According to the Communicable Disease Control categorical classification, the respondents
were classified based on their BMI as follows (21).
Overweight: BMI = 25–29.9 kg/m^2^
Obese: BMI ≥ 30 kg/m^2^
Awareness
Participants’ self-reported beliefs and knowledge regarding obesity risk factors, prevention, and treatment plans. To assess this, a structured questionnaire was utilized, featuring statements to which participants responded with “yes” or “no.” Responses were categorized into two groups: “aware” for those who answered “yes,” and “not aware” for those who answered “no” (22).
Physical activity levels
Participants physical activity level can be categorized as follows: Sedentary individuals engage in minimal movement, typically spending over 6 h per day in activities like sitting or lying down, and do not meet the recommended guidelines of at least 150 min of moderate-intensity or 75 min of vigorous-intensity exercise per week. Fairly active individuals participate in moderate physical activity for at least 150 min or vigorous activity for at least 75 min weekly, often incorporating a mix of both but not consistently reaching higher levels of intensity. Active individuals exceed the recommended guidelines, engaging in more than 300 min of moderate-intensity or over 150 min of vigorous-intensity exercise weekly, often participating in structured workouts or various physical activities regularly (23).
Adequate sleep
In this study, adequate sleep defined based on established guidelines from the National Sleep Foundation, adults aged 18–64 years should sleep 7–9 h per night for optimal health Respondents who report sleeping between 7 and 9 h per night was answer “yes,” while those who sleep less than 7 h per night was respond with “no” (24).
Data collection instruments and procedures
A structured questionnaire adapted from the World Health Organization instrument for step wise surveillance (WHO STEPS) of chronic disease risk factors (25). The data was gathered using a structured questionnaire. The same questionnaire was prepared in English and translated to Amharic and then back to English to maintain its consistency. It is contained of four parts. The first section focuses on the socio-demographic characteristics of the participants, including age, sex, education level, marital status, monthly income, and employment status. The second section evaluates the respondents’ behavioral, dietary, and biomedical characteristics, such as smoking habits, alcohol consumption, physical activity, and vegetable intake. The third section of the instrument included 11 statements designed to evaluate participants’ perceptions and knowledge about overweight/obesity and its associated risk factors, demonstrating a strong internal consistency with a Cronbach’s alpha of 0.79. The fourth section comprised thirteen statements aimed at assessing participants’ understanding of the prevention and treatment of overweight/obesity. The internal validity was also examined by SPSS and resulted well with a Cronbach’s alpha value of 0.85.
Data was gathered by a team of 22 trained data collectors. They received training on the study’s objectives, goals, and ethical considerations related to data collection. During the interviews, they conducted anthropometric measurements, including weight, height, and body mass index (BMI). A pretest was administered to 5% of the participants prior to data collection. The cross-validity of the questionnaire was evaluated by two experts in the field. Following minor adjustments based on their feedback, which enhanced the clarity and ease of the questionnaire, actual data collection was conducted daily in working days. The supervisors oversaw the entire data collection process, closely monitoring the quality, clarity, and integrity of the procedures. For the qualitative component, a structured open-ended interview guide was utilized. Conducting the interviews in the participants’ native language (Amharic) facilitated simpler and more effective responses. Trained and experienced professionals collected qualitative data through audio recordings and note-taking. The BMI of respondents was calculated by dividing their weight in kg by their height in m^2^.
A typical beam balance, which is used to assess weight in medical settings, was employed for the weight measurement. Prior to each participant’s measurement, the scale’s pointer was zeroed. Each person shed a hefty clothing. He or she was standing upright in the middle of the balancing platform without any support. The weight was measured to the closest 0.1 kg.
According to normal anthropometric protocols, height was measured using a wooden height-measuring board with a sliding head bar. After being instructed to take off their shoes and stand erect, the participants were put in the Frankfurt plane with their knees straight and their feet together. The occipital region of the back of the head, the heels, buttocks, and the shoulder blades touched the stadiometer’s vertical stand, and readings were taken to the closest 0.1 cm.
Data entry and statistical analysis
The data was entered, coded, and analyzed using the Statistical Package for Social Sciences version 26 after it was checked for quality and clarity. A Q-Q plot and histogram were used to assess the data’s normal distribution. For categorical variables, descriptive findings were reported using frequency and percentage. Following the usage of the multi-co-linearity enters approach; the goodness of model fit test and the parallel line assumption test were performed. The connection between overweight/obesity and other independent risk variables was determined using ordinal logistic regression analysis. A p-value of 0.05 with a 95% confidence interval was considered statistically significant.
Research ethics approval and consent form
The project was ethically authorized by Woldia University’s ethical review board. The Woldia University Institutional Review Board (WDU/IRB) office provided a formal authorization letter with the protocol number WDU/IRB001. Following a briefing on the study’s aims, participants were informed and gave both written and verbal consent forms. Participants in the study were able to offer informed consent and had a thorough knowledge of the study’s objectives. All processes were carried out by relevant standards and regulations based on Helsinki legislation.
Results
Socio-demographic character of the participants
This survey included 1,084 participants aged 18 and above, with a response rate of 100%. In terms of age, the majority (53.1%) of respondents are between the ages of 18 and 29, 37.5% are between the ages of 30 and 49, and 9.4% are over 50. Similarly, 65.2% were men and 34.8% were women. As for educational attainment, 14.4% are illiterate, 19.7% have a primary education, 29.2% have a secondary education, and the remaining 36.7% have a college education or above. 33.6% were married, 55.5% were single, 7.7% divorced, and 3.2% were widowed. In terms of occupation, 19.4% were merchants, 42.7% were government employees, 26.9% were students, 8.7% were farmers, and the other 2.3% were involved in other activities. According to respondents’ monthly household income, 18.6% have less than 2,000 ETB, 41.1% have 2,000–4,000 ETB, 16.2% have income 4,000–6,000 ETB, and 24.1% have income greater than 6,000 ETB (Table 1).
Behavioral, dietary, and biomedical character of respondents’
When it comes to stress levels, the majority of respondents (66.2%) are stress-free. In terms of smoking habits, the vast majority (79.1%) of respondents never smoke. As for alcohol use, 52.5% were current consumers of alcohol. According to the data, 40.6% of people ate fruit at least three times per week. 45.4% of people consume vegetables less than three times each week. Unsaturated oil is utilized by 52.8% of people, regardless of the type of oil they use.
38.9% were very active, regardless of their degree of physical exercise. According to the level of adequate sleep, 51.1% of people got enough sleep. As for family history of obesity, 60.9% of respondents had no family history of obesity (Table 2).
Prevalence of overweight/obesity
Overweight was prevalent in 17.9% of the population, and obesity was prevalent in 3.4%. Overweight and obesity were present in 21.3% of the population. Adults aged 30–49 years had the highest prevalence of overweight or obesity, followed by adults aged 50 and up. The prevalence of overweight in males was 7.9 and 10.0% in females, obesity in males was 1.65 and 1.75% in females, and the combined prevalence of overweight and obesity in males was 9.55 and 11.75% in females (Figure 1).
Prevalence of overweight/obesity.
Participant’s knowledge of risk factors for overweight/obesity
The mass of respondents was aware of some risk factors, such as high intake of saturated fat (52.4%) and a lack of adequate physical activity (82.9%). However, the greater part of respondents (84.0%) were unaware that family history (84.0%), age (57.9), low vegetable intake (63.0%), low consumption of fruit (77.0%), low socioeconomic status (72.0%), smoking (82.5%), medication (58.0%), stress (82.9%), and lack of adequate sleep (57.9%) were risk factors for overweight and obesity (Table 3).
Participant’s knowledge of prevention techniques for overweight/obesity
The mass of respondents was aware of various preventative methods for overweight and obesity, such as limiting saturated fat consumption (52.4%) and engaging in regular physical activity (82.9%). However, the majority of respondents were unaware that adequate sleep (57.9%), stress reduction (82.9%), medication management (58.0%), smoking cessation (82.5%), good socioeconomic status (72.0%), a high intake of fruit (77.0%), and a high intake of vegetables (63.0%) were prevention techniques for overweight and obesity risk (Table 4).
Participant’s knowledge of treatment techniques of overweight/obesity
The bulk of respondents (55.4%) were aware of some treatments for overweight and obesity, such as frequent exercise. The majority of respondents, however, were unaware that well-informed nutrition (64.4%), weight reduction medicine (73.9%), and weight loss surgery (68.9%) were treatment options for overweight and obesity risk (Table 5).
Knowledge of risk factors of overweight/obesity via interview
During the interview stage, a lack of information on risk factors for overweight/obesity was discovered. A high number of respondents stated that they are unaware of the risk factors for obesity, that they do not know about smoking, drinking alcohol, and how saturated fat is related to obesity. However, a 29-year-old woman claimed: “…The most common risk factor for overweight/obesity is being wealth…………….” Another 45-year-old guy indicated that he lacked awareness about the risk factors for obesity: “…In general, I feel that people are predisposed to being overweight or obese as a result of their high level of comfort.…..” Some respondents who were more aware of the risk factors for overweight and obesity were able to name saturated fat consumption and physical inactivity as risk factors. For example, 23-year-old men claimed: “… PHYSICAL inactivity exposes for obesity.” Furthermore, increased saturated fat consumption increases the risk of being overweight or obese……..”
Association between prevalence of overweight/obesity and other predictors
The association between being obese and other independent variables was demonstrated using ordinal binary logistic regression analysis. Based on the results, age, sex, educational status, marital status, occupational status, monthly family income, smoking, frequency of drinking of alcohol per week, fruit consumption per week, vegetable consumption per a weak, type of oil most often used, physical activity level, level of stress and family history of obesity were significantly associated with obesity. Participants aged 18–29 are 0.071 times less likely to be overweight or obese than those aged 50 and above (AOR = 0.07, 95% CI: 0.04–0.13; p = 0.000). Similarly, being male are 0.22 times less likely to obese than female (AOR = 0.22, 95% CI: 0.09–0.50; p = 0.000), monthly family income less than 2,000 ETB (AOR = 0.09, 95% CI: 0.04–0.21; p = 0.000), low level of stress (AOR = 0.22, 95% CI: 0.12–0.40; p = 0.000), Participants who used unsaturated oil the most frequently (AOR = 0.61, 95% CI: 0.38–0.98; p = 0.043), those with active physical activity level (AOR = 0.40, 95% CI: 0.25–0.64; p = 0.000) those who never smoked cigarettes (AOR = 0.40, 95% CI: 0.25–0.67; p = 0.000) those who never drank alcohol (AOR = 0.15, 95% CI: 0.09–0.24; p = 0.000) previous family history of obesity (AOR = 4.07, 95% CI: 2.37–6.99; p = 0.000) were less likely to have obese. Educational status not more than primary (AOR = 31.22, 95% CI: 13.12–74.29; p = 0.000) were more likely to have obese (Table 6).
According to Table 6, as for age, those aged 18–29 are 0.071 times less likely to be overweight or obese than those aged 50 and above. In terms of gender, female respondents were more likely than males to be overweight or obese. As for the impact of educational status, those respondents who had a primary level of education were 31.220 times more likely to be overweight or obese than respondents who were college and above educational level, and participants who had a secondary level of education had 0.350 times lower risk to be overweight and obese as compared to those who have collage and above educational level participants.
As for occupational status, participants who were students had 0.112 times lower risk for being overweight and obese as compared to those who have occupational status “others.” In the case of monthly family income, respondents who have a family monthly income of more than 6,000 ETB are more likely to be overweight and obese. As for the impact of stress, respondents who live with stress previously had a greater risk for to be overweight and obese. As for the type of oil most often used, respondents who used unsaturated oil mostly are 0.613 times lower risk of being overweight and obese as compared to saturated oil users.
In terms of adequate sleep, respondents who had good sleep experience (yes) had a lower risk than respondents who did not have a good sleep experience (no). As for physical activity level, participants who have a sedentary level of physical activity were more likely overweight and obese. As for smoking, participants who never smoked had 0.404 times lower risk as compared to previous smokers, and participants who are currently smokers had 1.347 times higher risk for being overweight and obese than previous smokers. As per frequency of drinking alcohol, participants who drank alcohol more than 3 days per week had a higher risk of being overweight and obese. In the case of vegetable consumption per week, participants who never ate vegetables were more likely to be overweight and obese.
As for fruit consumption per week, participants who ate fruit more than 3 days per week had a lower risk of being overweight and obese as compared to participants who never ate fruit. On the impact of family history related to obesity, participants who have a history of obesity in their family were 4.071 times more likely to be overweight and obese than participants who never history of obesity.
Discussion
The mass of Ethiopian researchers perform studies on the prevalence and risk factors of overweight and obesity (26–28). There is no one published study that has assessed the level of community awareness of risk factors, preventions, and treatments of overweight/obesity in the North Wollo population, based on the authors’ best search approach. As a result, the magnitude and awareness of risk factors, prevention, and treatment of overweight/obesity among adults in north Wollo, Northeast Ethiopia, were investigated in this study. Among the North Wollo zone, the total prevalence of overweight and obesity among adults aged 18 and above was 21.3%. According to our research, the findings achieved are lower than the other studies (as for prevalence) conducted in Ethiopia. As researchers, we suspected that the location where the research was conducted had become a war zone over the previous 3 years. Because, the majority of the residents of North Wolo migrated during Tigray’s invasion. There was a transportation difficulty during the exodus, thus most of the evacuees were forced to walk for many days. Hunger and thirst were also used against them. We are convinced that this scarification is related to the findings of the current investigation. This was discovered to be more than the EDHS report of 2016 (29) and Congo (30), but lower than the result of united state (31), Nigeria (32), Portuguese (33), Turkey (34), and China (35). In addition, it is in line with a study conducted in the Democratic Republic of Congo (36), Benin (36), and Malawi (37).
This study states that a large proportion of the respondents were aware of some risk factors, such as high consumption of saturated fat (52.4%) and lack of physical exercise (82.9%). this result is supported by a previous study (38–40) However, a large percentage of respondents were not aware that family history (84.0%), age (57.9), low intake of vegetables (63.0%), low intake of fruit (77.0%), Low socioeconomic status (72.0%), smoking (82.5%) medication (58.0%), stress (82.9%), and lack of adequate sleep (57.9%) had risk factor for overweight and obesity risk. The mass of the respondents was aware of some prevention techniques of overweight and obesity, such as low consumption of saturated fat (52.4%), and regular physical exercise (82.9%). However, a large proportion of the respondents were not aware that getting adequate sleep (57.9%), reducing stress (82.9%), managing medication (58.0%), stopping smoking (82.5%), good socioeconomic status (72.0%), high intake of fruit (77.0%), and high intake of vegetable (63.0%) had prevention technique for overweight and obesity risk. The majority of the respondents were aware of some treatment techniques of overweight and obesity, such as regular exercise (55.4%). However, the majority of the respondents were not aware that making well-informed nutrition (64.4%), weight loss medication (73.9%), and weight loss surgery (68.9%) had treatment techniques for overweight and obesity risk.
An example of the attitudes of the respondents was made known to the authors of this study through a personal revelation Despite struggles with overweightness, the man known to the authors had become regularly engaged in sport, managing to shed some pounds over time. After 4 months, He visits his family who he had not seen in a long time.
Upon arriving at his family home, his mother embraced him tightly, tears welling in her eyes as she asked, “What happened to you, my son?” Her emotional reaction was rooted in the cultural perception in Ethiopia, where gaining weight is often seen as a sign of comfort and prosperity.
Most of the studies conducted in different countries showed that a prevalence of obesity is observed among women more than men (41, 42). Based on the results of this study, the prevalence of overweight in males was 7.9% and in females was 10.0%, obesity in males was 1.65% and in females was 1.75%. Our research prevails that the prevalence of overweight/obesity is higher in women than men. This finding is supported by studies in Iran (42), Latin America (41), and EDHS reports of 2016 (43). Differently, the studies in united states (31), Turkey (44), Danish (45), and Spanish (46).
The findings in the present study showed a statistical association between age, sex, educational status, monthly family income, smoking, frequency of alcohol conception, vegetable and fruit consumption, level of stress, physical activity level, family history, and overweight or obesity. This is in line with other similar findings in Kerala, India (47), Uganda (48), and Porto (49). On the contrary, people with the lowest income and socioeconomic group were more likely to be obese (50). In addition, participants with the highest income in the study area might be increased food intake of high calories, reduced physical activity, and increased sedentary lifestyles (51).
This study identified the odds of being overweight or obese is increased with increasing age. This finding is in line with other similar findings in Saudi Arabia (1), Great Britain (52), Benin (53), Atlanta (54), and Shanghai (55). This is highly linked to physical inactivity and hormonal change due to becoming older.
Obesity results from energy imbalance: too many calories in, too few calories burned. Several factors influence how many calories (or how much “energy”) people burn each day, among them, age, body size, and genes. But the most variable factor is also the most easily modified the amount of activity people get each day (56). In this study, physical activity was found to be adversely related with obesity and overweight. Physically inactive persons had a greater risk of being overweight or obese than physically active ones. This finding is supported by the study among adults in Swedish (57), Canada (58), South Africa (59), and Ghana (60). This might be explained by the accepted belief that keeping active can help people stay at a healthy weight or lose weight.
Stress has long been associated with changes in dietary preference, food intake, weight gain, and fat accumulation (61). As for the impact of stress, respondents who lived with stress previously had a greater risk for to be overweight and obese. Since, stress was positively associated with obesity in this study. This result is in line with studies in Chicago (62), Australia (63), and Canada (64).
Increased consumption of unsaturated fatty acids at the expense of saturated fatty acids, proteins, and carbs had a positive influence on body weight and obesity (65). As for the type of oil most often used, respondents who used unsaturated oil mostly have 0.613 times lower risk of being overweight and obese as compared to saturated oil users. This result is supported by a study conducted in the United States (66).
The current study’s findings revealed that individuals who used alcohol had a higher risk of becoming overweight or obese than those who did not consume alcohol. This is supported by cross-sectional research done in Welkite, Ethiopia (67), United States (68), and France (69). This might be explained by the understanding that alcohol consumption leads to a positive energy balance because the alcohol they consumed quickly turns to energy; drinking alcohol also seems to trigger impulsive eating behaviors, and alcohol might decrease fat breakdown and can stimulate its synthesis and deposition (70).
The results of this study reveal a concerning gap in knowledge among participants regarding the typical risk factors associated with overweight and obesity, as well as the prevention and treatment strategies for unhealthy habits and physical inactivity, which has significant implications for public health interventions aimed at combating the rising prevalence of obesity and related chronic diseases. The majority of participants’ unawareness of risk factors such as poor dietary habits, sedentary lifestyles, genetic predisposition, and environmental influences suggests that existing public health messaging may not be effectively reaching target populations, potentially leading to a failure to recognize personal risk and a lack of motivation to adopt healthier behaviors. Additionally, the unfamiliarity with prevention and treatment approaches is alarming, as effective strategies, including community-based programs promoting physical activity and nutrition education, are essential for reducing obesity rates; without knowledge of these strategies, individuals may not seek help or engage in preventive measures. Several factors, including socioeconomic status, educational background, and access to health information, may contribute to this observed lack of awareness, along with cultural perceptions surrounding body image and health that influence attitudes towards obesity
Study strengths and limitations
The utilization of a broader representative sample, as well as the standardized survey technique and measures, can be cited as positives of this study. However, because selection bias may impact the composition of participants, it is difficult to conclude. The study design, a cross-sectional survey approach, limits drawing causal conclusions between the variables studied. As a result, understanding study limitations may be significant in interpreting and applying the findings. More research on these limits in the area will be encouraged.
Conclusion
The current study can conclude that more than one-fifth of adults are overweight/obese. The majority of the respondents did not have an awareness of overweight/obesity risk factors, prevention, and treatment techniques regarding unhealthy lifestyles and age. Furthermore, living with stress, a family history of obesity, high consumption of saturated fat, alcohol consumption, older age, smoking, inability to consume fruits, and sedentary life were found to have a significant association with the occurrence of overweight/obesity. Future researchers should focus on educational interventions to raise awareness about obesity risk factors and prevention strategies. Longitudinal studies are needed to track changes in awareness and lifestyle behaviors over time. Additionally, exploring the influence of family dynamics, dietary patterns, and cultural contexts can enhance the effectiveness of obesity interventions.
The reference list from the paper itself. Each links out to its DOI / PubMed record.
- 1Al-Ghamdi S Shubair M Aldiab A Al-Zahrani J Aldossari K Househ M Prevalence of overweight and obesity based on the body mass index; A cross-sectional study in Alkharj, Saudi Arabia. Lipids Health Dis. (2018) 17:134. 10.1186/s 12944-018-0778-5 29871648 PMC 5989365 · doi ↗ · pubmed ↗
- 2Völgyi E Tylavsky F Lyytikäinen A Suominen H Alén M Cheng S. Assessing body composition with DXA and bioimpedance: Effects of obesity, physical activity, and age. Obesity (Silver Spring). (2008) 16:700–5. 10.1038/oby.2007.94 18239555 · doi ↗ · pubmed ↗
- 3James P Leach R Kalamara E Shayeghi M. The worldwide obesity epidemic. Obes Res. (2001) 9:228S–33S. 10.1038/oby.2001.123 11707546 · doi ↗ · pubmed ↗
- 4Ahirwar R Mondal P. Prevalence of obesity in India: A systematic review. Diabetes Metab Syndr. (2019) 13:318–21. 10.1016/j.dsx.2018.08.032 30641719 · doi ↗ · pubmed ↗
- 5NCD Risk Factor Collaboration (NCD-Ris C). Trends in adult body-mass index in 200 countries from 1975 to 2014: A pooled analysis of 1698 population-based measurement studies with 19.2 million participants. Lancet. (2016) 387:1377–96. 10.1016/S 0140-6736(16)30054-X 27115820 PMC 7615134 · doi ↗ · pubmed ↗
- 6Zulfiqar T Strazdins L Banwell C Dinh HD’Este C. Growing up in Australia: Paradox of overweight/obesity in children of immigrants from low-and-middle -income countries. Obes Sci Pract. (2018) 4:178–87. 10.1002/osp 4.160 29670755 PMC 5893467 · doi ↗ · pubmed ↗
- 7Jaacks L Slining M Popkin B. Recent trends in the prevalence of under- and overweight among adolescent girls in low- and middle-income countries. Pediatr Obes. (2015) 10:428–35. 10.1111/ijpo.12000 25558987 PMC 4492920 · doi ↗ · pubmed ↗
- 8Ofori-Asenso R Agyeman A Laar A Boateng D. Overweight and obesity epidemic in Ghana-a systematic review and meta-analysis. BMC Public Health. (2016) 16:1239. 10.1186/s 12889-016-3901-4 27938360 PMC 5148846 · doi ↗ · pubmed ↗