Phosphatidylethanol levels and their association with withdrawal severity among individuals with severe alcohol use disorder seeking inpatient withdrawal management
Jeong Hoo Lee, Veronica Szpak, Lisa W. Vercollone, Peter R. Chai, Charlotte E. Goldfine, Samuel Maddams, Joji Suzuki

TL;DR
This study found that phosphatidylethanol levels correlate with alcohol consumption but not with the severity of alcohol withdrawal in patients receiving inpatient treatment.
Contribution
The study is the first to examine PEth levels as a predictor of withdrawal severity in individuals with severe alcohol use disorder.
Findings
PEth levels correlated with average daily alcohol consumption and heavy drinking days.
No significant association was found between PEth levels and withdrawal severity measures like CIWA or medication requirements.
Results suggest PEth may not be a reliable predictor of withdrawal severity in heavy drinkers.
Abstract
This study aimed to determine if phosphatidylethanol (PEth) levels are associated with alcohol withdrawal severity among individuals seeking inpatient withdrawal management. A prospective study enrolled individuals undergoing alcohol withdrawal treatment at a ASAM level 4 inpatient unit. Primary outcome was the association between serum PEth levels with alcohol withdrawal medication requirements in diazepam equivalent (mg). Secondary objectives examined associations between PEth levels, Clinical Institute Withdrawal Assessment for Alcohol (CIWA) scores, drinking history, Alcohol Use Disorders Identification Test (AUDIT), and Prediction of Alcohol Withdrawal Severity Scale (PAWSS) scores. Thirty participants (mean age 48.7 years, SD 11.7; 67.7% white) reported average daily alcohol consumption of 14.2 drinks (SD 11.4, range 1.2-47.6) and percent heavy drinking days of 72% (SD 31.9,…
Genes, proteins, chemicals, diseases, species, mutations and cell lines named across the full text — each resolved to its canonical identifier and authoritative record.
Click any figure to enlarge with its caption.
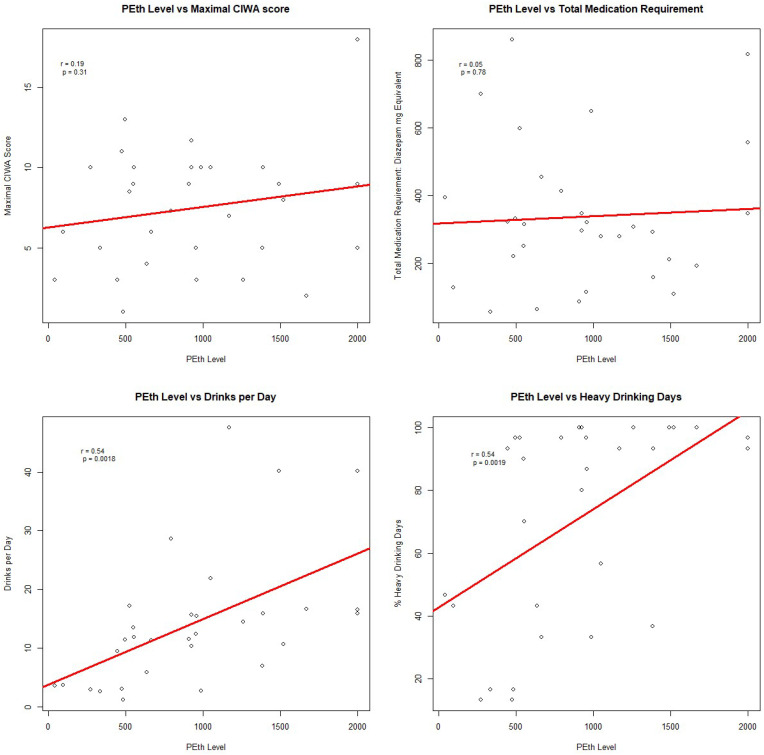 Figure 1
| Patient Characteristics |
|
|---|---|
| Age, M (SD) | 48.7 (11.7) |
| Sex, n, % | |
| Males | 24 (77.4%) |
| Females | 7 (22.6%) |
| Race, n, % | |
| White | 21 (67.7%) |
| Black | 8 (25.8%) |
| Other | 2 (6.5%) |
| Ethnicity, n, % | |
| Hispanic | 1(3.2%) |
| Non-Hispanic | 30 (96.8%) |
| Marital Status, n, % | |
| Single | 21 (67.7%) |
| Married/Life Partner | 5 (16.1%) |
| Divorced | 3 (9.7%) |
| Other | 2 (6.5%) |
| Employment, n % | |
| Employed | 24 (77.4%) |
| Unemployed | 6 (19.4%) |
| Retired | 1 (3.2%) |
| Home Status, n, % | |
| Domiciled | 24 (77.4%) |
| Unstable Housing | 7 (22.6%) |
| Psychiatric Diagnoses, n, % | |
| Major Depressive Disorder | 13 (41.9%) |
| Bipolar Disorder | 5 (16.1%) |
| ADD or ADHD | 1 (3.2%) |
| Panic Disorder | 2 (6.5%) |
| Post Traumatic Stress Disorder | 4 (12.9%) |
| Generalized Anxiety Disorder | 16 (51.6%) |
| Alcohol use disorder history | |
| Drinks per Day | 14.2(11.4, 1.2-47.6) |
| Percent Heavy Drinking Days | 72 (31.9, 13.3-100) |
| Withdrawal Seizure, n (%) | 9 (29.0%) |
| Delirium Tremens, n (%) | 7 (22.6%) |
| AUDIT, M, SD, Range | 27.5 (7.3, 10-38) |
| PAWSS, M, SD, Range | 5.3 (1.4, 1-8) |
| Substance use disorder history, n, % | |
| Opioids | 4 (12.9%) |
| Cocaine | 6 (19.4%) |
| Benzodiazepines | 3(9.7%) |
| Cannabis | 8 (25.8%) |
| Tobacco | 18 (58.1%) |
| Admission, M, (SD, Range) | |
| Length of Stay (Days) | 4.7 (2.4, 2-13) |
| Blood Alcohol Level (mg/dL) | 182.0 (138.6, 0-495) |
| Maximal CIWA Score | 7.5(3.7, 1-18) |
| PEth Level (PO, ng/mL) | 934.9 (546.6, 42-2,000) |
| Medication requirement in diazepam equivalent (mg) | 338.5 (210.6, 57.5-860) |
- —National Institute on Drug Abuse 10.13039/100000026
- —National Institute on Alcohol Abuse and Alcoholism 10.13039/100000027
Peer Reviews
No public reviews on file for this paper yet. If you reviewed it on a platform where reviews are public (OpenReview, ICLR, NeurIPS, ICML), you can paste yours below so the community can read it here.
Videos
No videos yet. Explain this paper in a talk, walkthrough, or lecture? Add one.
Taxonomy
TopicsAlcoholism and Thiamine Deficiency · Alcohol Consumption and Health Effects · Substance Abuse Treatment and Outcomes
Introduction
1
Inpatient withdrawal management is often the first step in treatment for individuals with alcohol use disorder (AUD). Despite various methods, predicting withdrawal severity remains challenging. Phosphatidylethanol (PEth), a membrane-bound phospholipid, is synthesized exclusively in the presence of alcohol consumption (1, 2). Uniquely, studies have demonstrated PEth levels to correlate well with self-reported heavy drinking in the prior several weeks or more, making PEth a useful biomarker to assess the degree of recent drinking (3–6). Conversely, a negative PEth test indicates no heavy drinking in the past 1–2 weeks. Given these correlations, PEth levels may help assess withdrawal severity and guide treatment strategies. Currently, PEth testing is not commonly available in most clinical laboratories and samples often need to be sent to specialized reference laboratories for analysis (7–9). The processing time for PEth testing also typically ranges from 2 to 5 business days (7, 9). If baseline PEth levels reliably indicate withdrawal severity and guide treatment, it could encourage faster testing development.
A recent study found PEth levels to correlate with alcohol withdrawal symptoms in individuals with AUD seeking inpatient withdrawal management (10). To explore this relationship further, we conducted a prospective study with individuals undergoing inpatient alcohol withdrawal management.
Methods
2
Setting: We enrolled English-speaking adults aged 18 and older undergoing alcohol withdrawal treatment at an American Society for Addiction Medicine (ASAM) level 4 inpatient unit in an urban academic hospital. Level 4 units only admit patients at the highest risk for severe alcohol withdrawal, providing 24-hour intensive medical care, cardiac monitoring, pharmacotherapy, and intensive psychosocial support. Given this unique patient population, a fixed-dose regimen is universally utilized in which benzodiazepine or phenobarbital are administered proactively without waiting for escalating withdrawal scores. Clinical Institute Withdrawal Assessment (CIWA) scores are still obtained, but only to determine if additional pharmacotherapy is needed. The choice of medication and dose are determined by the individual attending physician, therefore introducing inter-individual variability in how withdrawal is managed. The study was approved by the Mass General Brigham Institutional Review Board (protocol#: 2023P000710) on 4/7/23 and recruitment took place from June to November of 2023.
Participants: Inclusion criteria were admission to the unit for alcohol withdrawal as assessed and determined by the addiction medicine team, English-speaking, and ability to provide informed consent. Exclusion criteria included impaired mental status (i.e. acute intoxication or delirium) that prevented informed consent and primary withdrawal management for substances other than alcohol based on the primary addiction team’s screening and urine drug test that was obtained on admission. Participants received compensation of $20 in the form of Forte card.
Study Procedures: Upon obtaining consent, we conducted the following assessments: Prediction of Alcohol Withdrawal Severity Scale (PAWSS) (11), Alcohol Use Disorders Identification Test (AUDIT) (12), and Time-Line Follow Back (TLFB) (13). TLFB was used to calculate drinks per drinking days and percent heavy drinking days in the prior 30 days. Blood sample was collected via standard phlebotomy procedure and the sample was then sent to the laboratory and analyzed using liquid chromatography-tandem mass spectrometry (LC-MS/MS) to detect and quantify PEth levels. The laboratory provided results for PEth homologues PO (16:0/18:1) PEth and PL (16:0/18:2) Peth. For our study, we utilized only PO PEth given that it is the most common (>75%) Peth homologue. Clinicians were not made aware of the PEth levels as they were obtained only for research purposes. Participants’ electronic medical records provided demographics, psychiatric and substance use history, laboratory tests, maximal CIWA scores on day 2 or 3 of admission assessed by nursing, and medications used in diazepam equivalents (10 mg diazepam = 2 mg lorazepam = 25 mg chlordiazepoxide = 30 mg IV phenobarbital) (14). Participants were continued on their home medications and did not receive additional psychiatric medications.
Outcomes: Primary outcome was medication requirement in diazepam equivalents.
Sample size calculation: Based on the prior study (10) that showed moderate effect size (0.5), we conducted an alpha priori power analysis to estimate that we would require a sample of 30 to achieve 80% power with alpha set at 5% to detect a significant association between PEth and medication requirement.
Analytic strategy: Analyses were conducted in R Studio version 4.2.2 (15). Descriptive statistics summarized the data. Pearson’s correlations were computed with the ‘cor.test ()’ function. Primary outcome assessed the correlation between PEth and medication requirements. Secondary outcomes explored the relationship between PEth levels with CIWA scores, drinking history, AUDIT, and PAWSS scores. Alpha was set at 0.05 for all analyses. In post-hoc analyses, different benzodiazepine conversions were examined as sensitivity analysis (15 mg diazepam = 2 mg lorazepam = 25 mg chlordiazepoxide = 30 mg IV phenobarbital) (14).
Results
3
The characteristics of those included are summarized in Table 1. Thirty participants were an average 48.7 years old (SD 11.7), and predominantly non-Hispanic white (67.7%) males (77.4%). Most were single (67.7%), employed (77.4%), and housed (77.4%). Common comorbid psychiatric conditions included depression (41.9%) and generalized anxiety disorder (51.6%). Substance use was prevalent, with tobacco (58.1%), cannabis (25.8%), cocaine (19.4%), opioids (12.9%), and benzodiazepines (9.7%). In the 30 days prior to admission, participants reported drinking on average 14.2 drinks per day (SD 11.4, range 1.2-47.6) with 72% heavy drinking days (range 13.3-100). Total medication requirement was on average 338.5mg (SD 210.6, range 57.5-860) diazepam-equivalent, maximal CIWA scores were on average 7.5 (SD 3.7, range 1-18), and PAWSS scores were on average 5.3 (SD 1.4, range 1-8). The average length of hospitalization was 4.7 days (SD 2.4, range 2-13).
Pearson’s correlation analysis (Figure 1) showed no significant correlation between PEth and medication requirements in diazepam equivalence (r=0.05, p=0.78; Figure 1). No significant correlations were found between PEth levels and CIWA scores (r=0.09 to -0.14, p>0.05), AUDIT scores (r=0.17, p=0.35), AUDIT-C scores (r=0.14, p=0.45), or PAWSS scores (r=0.13, p=0.50). There was a significant correlation between PEth levels and drinks per day (r=0.54, p=0.0018; Figure 1) and percent heavy drinking days (r=0.54, p=0.0019; Figure 1). Post-hoc analyses with different benzodiazepine conversions did not affect these results.
Pearson's Correlation Analysis.
Discussion
4
We aimed to assess whether PEth levels could predict the severity of alcohol withdrawal because of recent positive study which found such a positive correlation (10). We therefore hypothesized a similar correlation, but our results tentatively led us to reject this hypothesis. The participants in our study generally presented with more severe drinking patterns compared to those in the previous study and were at higher risk for severe withdrawal. Our results therefore could potentially suggest a ceiling effect, where PEth’s utility in predicting withdrawal severity is limited beyond a certain threshold of alcohol use. Our study also used a fixed-dose regimen to treat alcohol withdrawal, as opposed to a symptoms-triggered approach, proactively managing withdrawal symptoms rather than waiting for escalating CIWA scores and ensuring that patients, even those at the highest risk, do not experience significant symptoms. The PEth testing for study had an upper limit 2000 ng/mL, which introduced limitations on assessing the exact correlation with PEth values higher than 2000 ng/ml. Taken together, while our study failed to demonstrate a correlation between PEth and withdrawal severity, more research is needed to determine if certain populations of AUD or settings may be better suited for PEth testing as a risk stratification tool to predict alcohol withdrawal severity. Currently, there is also a limitation with the delay in obtaining PEth levels, and further study findings regarding the new utility of PEth may necessitate and encourage the development of faster testing.
Consistent with the prior research, our results confirm that PEth levels correlate with recent self-reported alcohol consumption. Direct alcohol markers such as blood alcohol level and ethylglucuronide have narrow windows of detection limiting their utility in assessing recent drinking (16). Indirect biomarkers such as liver function tests or carbohydrate deficient transferrin also suffer from poor predictive value in identifying recent drinking (17). Our study therefore supports the use of PEth in addition to self-report as a valuable biomarker to ascertain the degree of recent drinking.
Our study has limitations. The study was performed in a single institution, on an ASAM level 4 inpatient unit, with a small sample size (and lack of diversity in ethnic/cultural, racial, socioeconomic background), limiting our ability to generalize to other settings or populations. While there were standardized approaches to managing withdrawal, each physician attending on the unit had considerable flexibility in the choice of medication and dose to use (42% of patients received phenobarbital or phenobarbital/benzodiazepine combination and 58% received benzodiazepines alone in this study), potentially introducing a confound which we did not control for in our analyses. Our results may not generalize to settings that predominantly utilize symptom-triggered approach, including ASAM level 3 withdrawal management units. Finally, our sample size estimates may have been inaccurate since we used the prior study by Novak et al. to estimate the effect size.
PEth level may not predict the severity of alcohol withdrawal for individuals with severe AUD at risk for severe withdrawal admitted to an ASAM level 4 inpatient withdrawal management unit. Further studies conducted in various settings, with a wider spectrum of AUD severity, and with adequate sample sizes are needed to better assess the possible utility of PEth as a predictor of alcohol withdrawal severity.
The reference list from the paper itself. Each links out to its DOI / PubMed record.
- 1Isaksson A Walther L Hansson T Andersson A Alling C. Phosphatidylethanol in blood (B-P Eth): A marker for alcohol use and abuse. Drug Test Anal. (2011) 3:195–200. doi: 10.1002/dta.v 3.4 21438164 · doi ↗ · pubmed ↗
- 2Finanger T Vaaler AE Spigset O Aamo TO Andreassen TN Gråwe RW. Identification of unhealthy alcohol use by self-report and phosphatidylethanol (P Eth) blood concentrations in an acute psychiatric department. BMC Psychiatry. (2022) 22:286. doi: 10.1186/s 12888-022-03934-y 35449039 PMC 9026645 · doi ↗ · pubmed ↗
- 3Cherrier MM Shireman LM Wicklander K Yeung W Kooner P Saxon AJ. Relationship of phosphatidylethanol biomarker to self-reported alcohol drinking patterns in older and middle-age adults. Alcohol Clin Exp Res. (2020) 44:2449–56. doi: 10.1111/acer.v 44.12 PMC 847604633038267 · doi ↗ · pubmed ↗
- 4Helander A Hermansson U Beck O. Dose–response characteristics of the alcohol biomarker phosphatidylethanol (P Eth)—A study of outpatients in treatment for reduced drinking. Alcohol Alcohol. (2019) 54:567–73. doi: 10.1093/alcalc/agz 064 31529064 · doi ↗ · pubmed ↗
- 5Kummer N Ingels AS Wille SMR Hanak C Verbanck P Lambert WEE. Quantification of phosphatidylethanol 16:0/18:1, 18:1/18:1, and 16:0/16:0 in venous blood and venous and capillary dried blood spots from patients in alcohol withdrawal and control volunteers. Anal Bioanal Chem. (2016) 408:825–38. doi: 10.1007/s 00216-015-9169-1 26597914 · doi ↗ · pubmed ↗
- 6Sonmez MB Cinar RK Gorgulu Y Kilic EK Unal A. Evaluation of phosphatidylethanol by ELISA for detection of excessive alcohol use compared with traditional biomarkers: a case-control study. Psychiatry Clin Psychopharmacol. (2017) 27:41–6. doi: 10.1080/24750573.2017.1293249 · doi ↗
- 7Helander A Hansson T. The alcohol biomarker phosphatidylethanol (P Eth) - test performance and experiences from routine analysis and external quality assessment. Scand J Clin Lab Invest. (2023) 83:424–31. doi: 10.1080/00365513.2023.2253734 37697976 · doi ↗ · pubmed ↗
- 8White DO’Halloran S Salman S Mac Quillan G Joyce DA. Validation of a liquid chromatography tandem mass spectrometry (LC-MS/MS) method for erythrocyte phosphatidylethanol revealing critical considerations for its use as a clinical biomarker. J Chromatogr B Analyt Technol Bio Med Life Sci. (2022) 1192:123134. doi: 10.1016/j.jchromb.2022.123134 35139475 · doi ↗ · pubmed ↗