Hydraulic Traits Constrain Salinity-Dependent Niche Segregation in Mangroves
Haijing Cheng, Yinjie Chen, Yunhui Peng, Mi Wei, Junfeng Niu

TL;DR
This study shows how different mangrove species adapt to varying salinity levels through their hydraulic traits, influencing their distribution in intertidal zones.
Contribution
The study reveals how hydraulic traits drive salinity-dependent niche segregation in mangroves, offering new insights into their salt adaptation strategies.
Findings
A. marina and B. gymnorhiza showed the highest resistance to xylem embolism with the most negative P50 values.
P50 and P88 values decreased with increasing salinity, reflecting a shift from isohydric to anisohydric water regulation strategies.
B. gymnorhiza had a larger hydraulic safety margin and smaller SLA, suggesting better water retention and lower hydraulic failure risk.
Abstract
To understand the mechanisms underlying species assemblage along salt gradients in intertidal zones, we measured the xylem hydraulic vulnerability curves (HVCs), leaf water potential (ψ), stomatal conductance (gs), specific leaf area (SLA), and wood density (WD) for six mangrove species of Avicennia marina, Bruguiera gymnorrhiza, Aegiceras corniculatum, Kandelia obovata, Sonneratia apetala, and Sonneratia caseolaris. We found the following: (1) A. marina and B. gymnorhiza had the most negative P50 (water potential at which 50% of hydraulic conductivity was lost), while S. caseolaris and S. apetala had the least negative P50, indicating different resistance to embolism in xylem; (2) P50 and P88 (water potential at which 88% of hydraulic conductivity was lost) declined with increasing salinity from the onshore to offshore species, as their water regulation strategy meanwhile transitioned…
Genes, proteins, chemicals, diseases, species, mutations and cell lines named across the full text — each resolved to its canonical identifier and authoritative record.
Click any figure to enlarge with its caption.
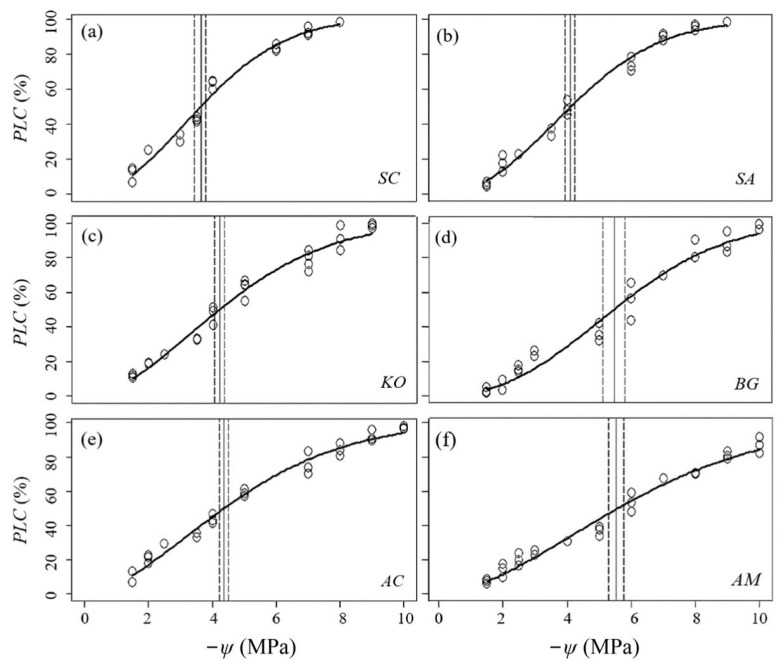 Figure 1
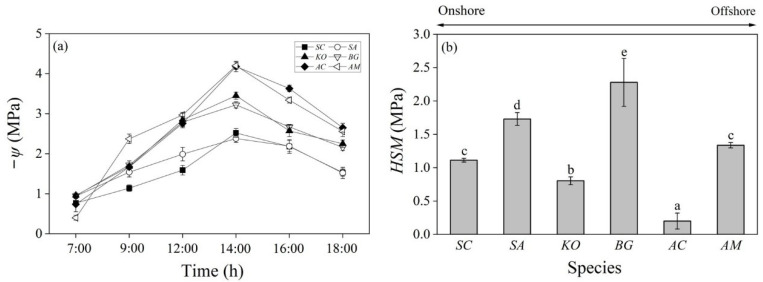 Figure 2
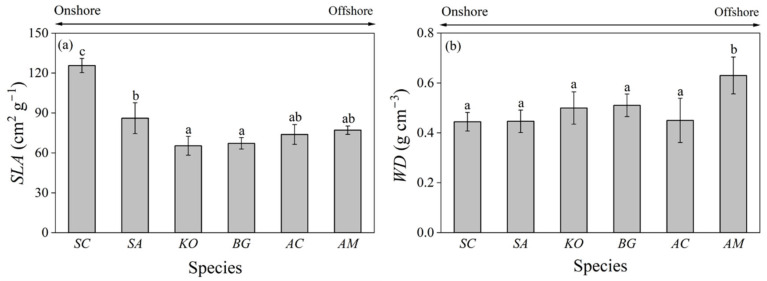 Figure 3
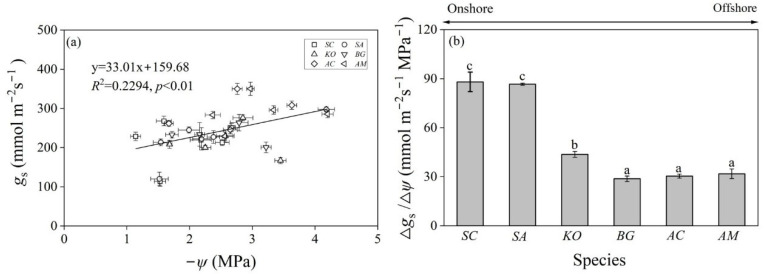 Figure 4
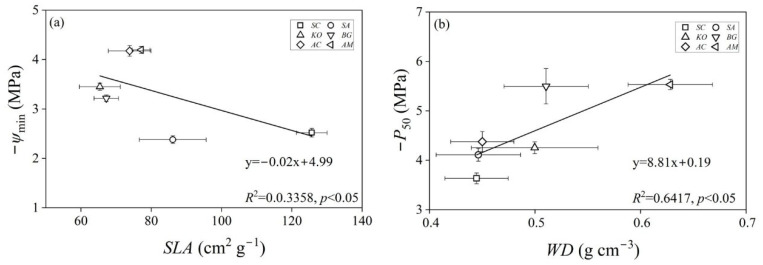 Figure 5
- —China National Key Research and Development Project
- —China National Natural Science Foundation Youth Program
- —Shenzhen University Youth Teacher Launching Project
Peer Reviews
No public reviews on file for this paper yet. If you reviewed it on a platform where reviews are public (OpenReview, ICLR, NeurIPS, ICML), you can paste yours below so the community can read it here.
Videos
No videos yet. Explain this paper in a talk, walkthrough, or lecture? Add one.
Taxonomy
TopicsCoastal wetland ecosystem dynamics · Plant Water Relations and Carbon Dynamics · Plant responses to water stress
1. Introduction
Mangroves grow in tidal, saline wetlands along tropical and subtropical coasts worldwide [1]. They provide important habitats for terrestrial and marine animals including birds, insects, mammals, reptiles, and shellfish, and have the function of improving water quality and protecting dikes from waves and storms [2]. Salinity is one of the most important factors shaping the morphology and typology of mangrove ecosystems, largely accounting for the niche differentiation among sympatric species in coastal regions [3,4]. Therefore, it is necessary to perform interspecies comparative studies to better understand the competitive advantages of different mangroves colonizing along a varying salt gradient.
High and fluctuating salinity may cause water deficit for mangrove trees [5]. To extract water efficiently from saline substrates, mangroves have to maintain a lower internal osmotic potential [6]. Meanwhile, many mangrove species have evolved physiological adaptations similar to those of xerophytes for water conservation [1,7]. Global warming and intensifying heat waves may boost evapotranspiration and exacerbate hydraulic tensions, leading to embolism in mangrove xylem vessels. That could in turn induce stomatal closure, limit carbon assimilation, and affect plant survival and growth [8]. Thus, it is important to improve our understanding of mangrove xylem hydraulics so that we can better predict and assess their responses to future climate scenarios.
Water potential, inducing a specific percentage decrease in hydraulic conductivity (Px), is often used to characterize xylem embolism resistance [9]. Salt tolerance in mangroves can also be described in the same way if its ionic effect was neglected and only the osmotic effect was considered [7]. P12, P50, and P88, representing xylem water potentials corresponding to the loss of hydraulic conductivity by 12%, 50%, and 88%, respectively, are the most frequently adopted indexes. P50 was considered as a key indicator for plant tolerance to stress and extensively used in hydraulic safety or vulnerability assessments [10,11]. P12, P50, and P88 are all generally extracted from hydraulic vulnerability curves (HVCs). However, HVCs also bear information about the sensitivity of conductivity loss (Sx) to water potential changes, and this Sx has so far been largely underappreciated.
The hydraulic safety margin (HSM) is another important indicator for plant hydraulic risk, and is commonly quantified as the difference between the minimum water potential (ψmin) experienced by plants under natural conditions and their P50 [12,13]. A large positive HSM means a relatively low risk of embolism, and thus a low level of hydraulic failure; by contrast, a small positive or even negative HSM may imply potential hydraulic threat [10,14]. It can be speculated that mangroves are different in HSMs due to their different P50 and ψmin.
Plant functional traits can track environmental changes, affect plant fitness, and play an important role in shaping species co-occurrence patterns within ecosystems [15,16]. Both specific leaf area (SLA) and wood density (WD) are widely used functional traits. SLA reflects plant adaptive response to optimize light capture in leaves [17]; meanwhile, WD accounts for a tradeoff between carbon storage and hydraulic efficiency in xylem [18,19]. Mangrove plants can adjust leaf size and thickness to improve their adaptability to salt [20]. It has also been reported that the mangrove species of Avicennia germinan, which inhabits the most seaward saline environment, had the highest WD on the Amazon coast [21]. However, there is still a lack of research that can directly link SLA and WD to mangrove niche partitioning along salinity gradients in intertidal zones.
Plant tolerance to drought and salt highly depends on leaf stomatal behaviors: isohydric species close stomata rapidly, while anisohydric species tend to keep stomata open and maintain water transpiration even under more negative osmotic potentials [22,23]. More generally, plants coexist along a continuous spectrum from isohydry to anisohydry, with the former being resistant to embolism and the latter being tolerant of embolism [24]. If salinity increases (and thus water potential decreases) from the onshore to offshore habitats, the stomatal water regulation strategies of mangroves should also transition from isohydry to anisohydry along this coastal region.
In the present study, we selected six representative mangrove species, including Sonneratia caseolaris, Sonneratia apetala, Kandelia obovate, Bruguiera gymnorrhiza, Aegiceras corniculatum, and Avicennia marina in Shenzhen Overseas Chinese Town National Wetland Park. We measured leaf water potential (ψ) dynamics, stomatal conductance (gs), WD, and SLA and we constructed xylem HVCs, analyzed Px and Sx, and calculated the HSM for each species. We hypothesized the following: (1) salt resistance varied among mangroves distributed along salinity gradient from the onshore to offshore sites; (2) water regulation strategies changed from isohydry to anisohydry in mangroves as substrate salinity increased toward the offshore habitats; (3) HSM and WD tend to be low and SLA tend to be high for the onshore species of S. caseolaris and S. apetala, while the offshore species of B. gymnorrhiza and A. marina should have high HSM and WD, but low SLA. We aim to elucidate the underlying mechanisms that constrain mangrove distribution along salt gradients in intertidal zones. The results are meaningful for the monitoring, protection, reestablishment, and restoration of coastal mangrove ecosystems.
2. Materials and Methods
2.1. Field Site and Study Species
This study was conducted in the Overseas Chinese Town (OCT) Wetland Park (113.99 N, 22.53 E) in Shenzhen. It is the only coastal mangrove wetland in the urban hinterland in China. It covers an area of about 68.5 ha, and has a subtropical monsoon climate with mean annual precipitation and air temperature of 1823 mm and of 24 °C, respectively. The regional dominant mangrove species include Sonneratia caseolaris, Sonneratia apetala, Kandelia obovate, Bruguiera gymnorrhiza, Aegiceras corniculatum and Avicennia marina, distributing sequentially along the intertidal zone.
S. caseolaris and S. apetala occupy the most inland estuary area (flooded only during high tide) with continuous freshwater replenishment from an inner lake, leading to a relatively low substrate salinity of between 3.5 and 6.2‰. A. marina is located exclusively in the most seaward site and is immersed throughout the year in seawater with a changing salinity from 17.3‰ to 24.5‰. The distribution of A. corniculatum is partially overlapped with that of K. obovate and B. gymnorrhiza (with a substrate salinity of 9.1–15.4‰). They are geographically closer to A. marina than S. caseolaris and S. apetala, and their roots are also immersed in seawater most of the time. All salinity was measured monthly with a YSI Pro30 field conductivity meter (YSI Inc., Yellow Springs, OH, USA). For each species, we selected four to six individual trees of similar physical status to carry out measurements. All measurements were taken in trees that represent typical site characteristics.
2.2. Leaf Water Potential and Stomatal Conductance
ψ (leaf water potential) was measured using a Model 1505D-EXP pressure chamber (PMS Instrument Company, Corvallis, OR, USA), and gs (stomatal conductance) was screened by a SC-1 leaf porometer (METER, San Francisco, CA, USA). To compensate for the possible effect of the sensor head on gs, the porometer took readings within 30 s [25]. For the measurement of ψ, leaves were carefully excised, sealed in plastic bags, and stored in a portable icebox for 20 min. The equilibrated leaves were taken out and inserted into the chamber lid with the petiole cut surface protruding out through a gasket. The lid is replaced, holding the leaf blade within the sealed chamber, and the chamber is pressurized slowly (0.01 Mpa s^−1^) until the petiole cut surface is wetted by the rising sap meniscus. The ‘balancing pressure’ applied has exactly compensated for the negative pressure in the xylem water column [26]. Four to six fully expanded, healthy, and sun-exposed leaves for each tree and four to six individual trees for each species were sampled. Measurements were taken every two hours in the field from 5:00 to 19:00 on clear days over the summer growing season in 2020.
2.3. Hydraulic Vulnerability Curves
Sun-exposed terminal branches (about 1–1.2 m in length) were harvested from the upper canopy positions of the sample trees at predawn (5:00–6:00 am), and transported immediately to the laboratory in black plastic bags to prevent moisture loss [27]. In the laboratory, a stem section (about 3–5 cm in length) was cut off from the bottom of each branch sample under water to avoid the inclusion of embolized vessels [28]. Stem segments measuring 6–8 cm in length and 0.8–1 cm in diameter were then prepared, and both the basal and distal ends were trimmed using a razor blade. The bark of the central part of each stem segment was removed and the sapwood was slightly notched using sharp blade to facilitate air seeding [29].
Embolism was induced by injecting air into a steel sleeve (4 cm in length) at different pressure levels. The sleeve was connected to a Model 1505D-EXP pressure chamber, allowing the injection of compressed nitrogen gas. Stem segment samples were inserted into the sleeve with two ends protruding out. Air was injected for 5 min at each of the following pressure levels: 1.0, 2.0, 3.0, 4.0, 5.0, 6.0, 7.0, 8.0, 9.0, and 10.0 Mpa. The injected segments were allowed at least 30 min to equilibrate after each pressurization until no more bubbles came out of the xylem [30].
Post-injection hydraulic conductivity (K) was assessed with a commercial XYL’EM apparatus (Bronkhorst, Montigny-les-Cormeilles, France). At least 5 subsamples (0.8–1 cm in diameter) measuring 2 cm in length were excised under water, and their proximal ends were connected to the tubing system of XYL’EM. The flow was measured by a high-resolution liquid mass flow meter, and K (kg m^−1^ s^−1^ Mpa^−1^) was calculated as the ratio of flow rate to pressure gradient (6 kPa). Initial hydraulic conductivity (Kini) was measured using the unpressured stem samples. They were then flushed with ultrapure water at 0.15 Mpa for 30 s and remeasured to determine the maximal conductivity (Kmax). The percentage loss of hydraulic conductivity (PLC) at each pressure level was calculated as (Equation (1)):
HVCs (hydraulic vulnerability curves) were constructed by fitting PLC with xylem water potentials (equal in number to the injection pressure but with opposite signs) using an exponential–sigmoidal function (Equation (2)). P12, P50, and P88 (water potential corresponding to 12%, 50% and 88% loss in hydraulic conductivity) were assessed from the HVC for each tree species. P12 measures the initiation of embolism and P88 signifies complete embolism. P50 is the most commonly used index of embolism resistance, at which HVCs are steepest [31]. We also assessed the slope (S_x_) of HVCs at P12, P50 and P88 (S12, S50 and S88). (Table 1) These parameters represent the sensitivity of conductivity loss to water potential changes in the xylem vessels. The 95% confidence intervals (CIs) for Px and Sx were estimated by the bootstrap resampling approach with replacement (N = 1000) [32].
where a is the slope at the inflection point and b is the ψ value of the inflection point of the fitting curve. It can be easily proved that b equals P50 [33]. The HSM (hydraulic safety margin) was computed as the difference between the minimum leaf water potential (ψmin) and P_50_ [34].
2.4. Specific Leaf Area and Wood Density
Sun-exposed healthy leaves were taken from the same sample trees for gs and ψ measurements. Fresh leaves were scanned and weighted in field as soon as they were collected, then put in labelled envelopes and brought to the laboratory. Leaf areas were analyzed using ImageJ (Version 1.54). Leaves were then oven dried at 75 °C for 72 h, and dry mass was determined by an analytical balance with an accuracy of 0.0001 g (Thermo Fisher Scientific Inc., Waltham, MA, USA). SLA (specific leaf area) was calculated as the ratio of leaf area to dry mass [35].
Stem segments about 1.5 cm in length and 0.8–1.0 cm in diameter were cut from the harvested stem branches. Barks were removed, and fresh volume (FV) was determined with the water-displacement method (available online: https://prometheusprotocols.net). Stem segments were then oven-dried at 80 °C until constant dry weight (DW) was obtained (Thermo Fisher Scientific Inc., Waltham, MA, USA). WD (wood density) was calculated as the ratio of DW to FV.
2.5. Statistical Analyses
The HVC was fitted using the fitplc package [32] in R-4.2.1. Data were analyzed with SPSS 20 and visualized in origin 2023. Normality and homogeneity of variance were examined before analyses. One-way analyses of variance (ANOVA) with Duncan’s multiple-range tests were performed to test trait differences among tree species. Relationships between two quantitative variables were assessed based on Pearson correlation tests and linear regression models. Statistical analyses were considered significant if p < 0.05.
3. Results
3.1. Hydraulic Vulnerability and Sensitivity
PLC (percentage loss of hydraulic conductivity) fitted well with the chamber pressures adopted to induce cavitation in branch xylem (Figure 1). Decreased ψ (leaf water potential) led to increased embolism. Px (water potential corresponding to x% loss in hydraulic conductivity) varied significantly (p < 0.05) among the six mangroves, and was generally lower (more negative) in the offshore species of Bruguiera gymnorrhiza and Avicennia marina. A. marina also had a significantly lower (more negative) P88 (water potential corresponding to 88% loss in hydraulic conductivity) than B. gymnorrhiza, while the differences of P12 (water potential corresponding to 12% loss in hydraulic conductivity) and P50 (water potential corresponding to 50 % loss in hydraulic conductivity) were not significant between them. For the onshore species of Sonneratia caseolaris and Sonneratia apetala, P50 was significantly higher (less negative) in the former than in the latter, while the differences of P12 and P88 were not significant. The mangrove species of Kandelia obovata and Aegiceras corniculatum tended to have intermediate Px (Table 2).
Sx (slope of hydraulic vulnerability curves) tend to increase first, reach their maximum at S50 (the slope of the hydraulic vulnerability curve at P50), and then decrease as embolism percentages (x) increase. Sx varied significantly (p < 0.05) among the six mangroves, and was generally larger in the onshore species of S. caseolaris and S. apetala. S. caseolaris had a significantly larger S12 (the slope of the hydraulic vulnerability curve at P12) than S. apetala, while the differences of S50 and S88 (the slope of the hydraulic vulnerability curve at P88) were not significant between them. For the offshore species of B. gymnorrhiza and A. marina, S50 and S88 were significantly larger in the former than in the latter, while the difference of S12 was not significant. The mangrove species of K. obovate and A. corniculatum tended to have intermediate Sx (Table 2).
3.2. Stomatal Conductance and Water Potential
Daily changes in gs (leaf stomatal conductance) showed a unimodal pattern for the onshore species of S. caseolaris and S.apetala, with the maximum gs occurring at about 10:00 am and then decreasing all the way to below 130 mmol m^−2^ s^−1^ at 17:00. By contrast, K. obovate, B. gymnorrhiza, A. corniculatum, and A. marina had bimodal gs dynamics, also peaking at about 10:00 am, but decreasing at noon and then increasing after 14:00 for a period of time, consistently maintaining above 200 mmol m^−2^ s^−1^ throughout the whole day of the measurement (Table 3).
While gs was generally larger in A. corniculatum and A. marina than in S. caseolaris, S. apetala, K. obovate, and B. gymnorrhiza, its variation was significantly larger in S. caseolaris and S. apetala than in the other four species. During the measurement period from 6:00 to 17:00, the variation of gs was largest in S. caseolaris with a coefficient of variation (CV = standard deviation/mean) of 27% and a changing range (△gs, the difference between the maximum and minimum gs) of 178.5 mmol m^−2^ s^−1^. By contrast, gs varied least in B. gymnorrhiza with a CV of 10% and △gs of 99.5 mmol m^−2^ s^−1^. For other species, the CV (14–23%) and △gs (108–124 mmol m^−2^ s^−1^) fell between S. caseolaris and B. gymnorrhiza (Table 3).
ψ (leaf water potential) decreased from 7:00 to 14:00 and then increased gradually until 18:00. ψpre (the predawn ψ) was below 0 Mpa, but above −1 Mpa for all six mangrove species. A. corniculatum, A. marina, and S. caseolaris had significantly higher (less negative) ψpre than S. apetala, K. obovate, and B. gymnorrhiza, with A. marina having the highest (least negative) ψpre of −0.40 Mpa. Meanwhile, A. marina and A. corniculatum also had the lowest (most negative) ψmin (the minimum ψ), significantly lower (more negative) than that of the other four species. ψ was consistently lower (more negative) in A. marina and A. corniculatum than in other species from 14:00 to 18:00. By contrast, S. caseolaris and S. apetala had significantly higher (less negative) ψ throughout the whole day except for the predawn time of between 06:00–07:00 (Figure 2a and Table A1). Due to the similar ψpre, but contrasting ψmin, the range of ψ (△ψ) was significantly wider in A. marina (3.80 Mpa) and A. corniculatum (3.44 Mpa) than in other species (1.44–2.49 Mpa) (Table A1).
3.3. Hydraulic Safety Margin
The mangrove species of our present study all had a positive HSM (hydraulic safety margin), meaning that their ψmin was higher (less negative) than the P50 calculated from HVCs. The HSM was significantly wider in B. gymnorrhiza than in other mangroves. S. apetala also had a significantly wider HSM than S. caseolaris, K. obovate, A. corniculatum, and A. marina. S. caseolaris and A. marina had similar HSMs of between 1 and 1.5 Mpa, while A. corniculatum had the narrowest HSM (0.2 Mpa). The HSM of K. obovate was significantly wider than that of A. corniculatum, but significantly narrower than those of S. apetala, B. gymnorrhiza, and A. marina (Figure 2b).
3.4. Specific Leaf Area and Wood Density
S. caseolaris and S. apetala had a significantly larger SLA (specific leaf area) than K. obovate and B. gymnorhiza. The SLA of S. caseolaris was nearly twice that of K. obovate (125.68 vs. 65.36 cm^2^ g^−1^). The SLA of A. corniculatum and A. marina also tended to be larger than those of K. obovate and B. gymnorhiza, but was smaller in comparison to those of S. caseolaris and S. apetala; yet, none of these differences were statistically significant (Figure 3a).
WD (wood density) was significantly larger in A. marina (0.63 g cm^−3^) than in other five mangrove species. Although K. obovate and B. gymnorhiza also tended to have larger WD than S. caseolaris, S. apetala, and A. corniculatum, the differences among them were not statistically significant (Figure 3b).
4. Discussion
Mangroves are periodically inundated by tides, and the high salinity of seawater may pose a great challenge to their growth [36]. Although the ion toxicity of salt is commonly ion-specific, its osmotic stress on plants is intrinsically similar to that of drought. Mangroves may therefore experience a physiological drought, and be potentially at the risk of drought-induced cavitation and embolism [37]. If that were the case, there would be trait differentiation among mangrove species distributed along salinity gradients. Traits relate to plant form and function, and the functional traits in turn affect plant responses to climate change and abiotic stresses [11,38]. The covariation between plant functional traits and various environmental factors has been well established in the literature [39,40,41].
SLA (specific leaf area) and WD (wood density) have been related to growth performance of trees and forests in response to drought across biomes. Species in arid environments tend to have low SLA and high WD [42,43]. In the present study, we found that SLA was significantly larger (p < 0.05) in the onshore species of Sonneratia caseolaris and Sonneratia apetala, while WD was significantly larger (p < 0.05) in the offshore species of Avicennia marina (Figure 3). These results concurred with the findings that SLA decreased while WD increased with salinity across mangroves in the Bangladesh Sundarbans [44]. We also noticed that S. caseolaris had significantly larger SLA than the introduced species of S. apetala (Figure 3a). This difference may come from the comparative advantage of the native species of S. caseolaris through long-term evolutionary adaptation to local hydro-environmental conditions to maximize leaf area and thus photosynthetic carbon assimilation [16].
In our present study, we observed that SLA and WD were marginally related to ψmin (the minimum leaf water potential) and P50 (water potential corresponding to 50% loss in hydraulic conductivity) (Figure A1). However, SLA was not significantly different among other mangroves except for S. caseolaris and S. apetala (Figure 3a). Also, except for A. marina, the differences of WD were not significant among other mangrove species (Figure 3b). Such a dichotomy of SLA and WD of the studied mangroves further undermines their linear regression relationships with ψmin and P50. These results corroborated the previous finding that SLA and WD were only weakly correlated with cross-species drought response patterns due to their loose connection to plant hydro-physiological processes [19]. Serra-Maluquer et al. [45] found that SLA and WD accounted for only 7% of drought-induced tree mortality variation across the globe. Powell et al. [46] showed that drought tolerance was independent of WD among mature Amazon rainforest trees. Therefore, despite the advantage of being easily measured for a large number of individual trees, SLA and WD per se do not necessarily presage plant vulnerability to drought or any other abiotic stress.
By contrast, hydraulic traits are generally considered to be more mechanistically linked to water use and transport in plants [47]. A large number of studies have demonstrated that hydraulic traits correlate tightly with plant vulnerability to drought [10,31]. We found that both P50 (water potential corresponding to 50% loss in hydraulic conductivity), P88 (water potential corresponding to 88% loss in hydraulic conductivity) and ψ (leaf water potential) decreased significantly along the salinity gradient from the onshore to offshore mangroves (Table 2 and Table A1). Jiang et al. [27] also observed that the P50 and ψmin of the offshore salt-adapted mangroves were significantly lower than those of onshore species at Guangxi Beilun Estuary National Mangrove Reserve. It should also be noted that Aegiceras corniculatum had higher (less negative) Px (including P12, P50 and P88) than Bruguiera gymnorrhiza in the present study (Table 2). This might be a result of the adaption of A. corniculatum to long-term inundation, being more available to water under the same or similar salinity. In natural conditions, A. corniculatum generally inhabits low tidal regions, while B. gymnorrhiza is commonly a mid–high tidal species [48,49].
The lower (more negative) P50 (<−5 Mpa) led to larger HSMs (hydraulic safety margins) (Figure 2b) for the offshore species of A. marina and B. gymnorrhiza, implying higher resistance to dehydration [11,46]. Yet, no obvious trends for HSMs were observed along the salinity gradient (Figure 2b). A. corniculatum and K. obovate had significantly narrower HSMs, signifying greater vulnerability to cavitation. Cavitated xylem conduits can be refilled at night through nocturnal sap flow, providing an effective compensation strategy for water deficits in these species [50]. On the other hand, although it is comparable in ψmin (Table A1), S. apetala had a significantly larger HSM than S. caseolaris (Figure 2b). Photosynthesis and growth may be prioritized over drought resistance, restricting carbon investment to xylem and thus resulting in a less negative P50 and a narrower HSM for the native species of S. caseolaris.
Px measures the water potential at which plants suffer a x% loss of hydraulic conductivity due to cavitation [32,51]; HSMs reflect the degree of conservatism of a plant’s hydraulic strategy [10,52]. The Sx, which quantifies xylem embolism sensitivity to water potential changes, is also important. In alignment with the decline in P50 and P88, Sx (S12, S50 and S88) also decreased along the salinity gradient from the onshore to offshore species (Table 2). Low Sx may serve as a buffer for plants to activate the ABA (abscisic acid) signaling pathway, inducing stomatal closure to reduce water loss through transpiration and preventing a further decline in ψ [53,54]. To sum up, it seems to be the case that there is a more gradual and slow progression of embolism than a sudden and rapid xylem embolization that dominates the acclimation and adaptation to salt in mangroves.
Hydraulic traits such as Px, Sx, and HSMs mainly depict the capacity of the xylem of a plant species to resist cavitation and embolism [52]. Regulation of gs (leaf stomatal conductance) represents another common strategy that plants adopt to cope with water deficiency under drought or saline conditions [55,56]. Species closing stomata rapidly can reduce transpiration water loss and maintain a relatively stable ψ in leaves (isohydry); by contrast, a loose control over gs often leads to fluctuating ψ (anisohydry) [57]. The decreasing ψmin (with a similar ψpre) (Figure 2a and Table A1) indicated a gradual transition from isohydry to anisohydry for mangroves distributed along the onshore to offshore salinity gradient. Further analyses revealed that the onshore species of S. caseolaris and S. Apetala had significantly larger △g_s_/△ψ than the offshore species of A. marina and A. corniculatum (Figure 4b), supporting the argument that strict stomatal control over ψ prevailed in the inland mangrove species.
Across the six mangrove species studied here, gs was significantly related to ψ (Figure 4a), suggesting that species with larger gs exert less control over ψ (and thus leads to more negative ψ). Klein [22] compiled the response curves of gs to ψ for 70 woody species from major forest biomes and found a continuum spectrum from anisohydry to isohydry. Other studies demonstrated that anisohydric species are more prone to be drought tolerant due to their embolism-resistant xylem and thick, dense leaves with lower turgor loss points [23,58]. In contrast, isohydric species often adopt a drought-avoidance strategy to prevent hydraulic failure during dry periods [59]. In the present study, we also observed smaller SLA, larger WD, and more negative P50 and P88 in the anisohydric species of A. marina and A. corniculatum. However, it is worth noting that a strict regulation of ψ is not necessarily associated with closed stomata and constrained carbon assimilation [60]. For a better prediction of plant responses to drought stress and a more reliable interpretation of community assemblage along salinity gradients, a prospective framework involves the integration of xylem hydraulics with stomatal behaviors as has been proposed by Klein [22] and Skelton et al. [61].
5. Conclusions
Based on the findings shown in the Section 3 and Section 4, and in correspondence to the hypotheses proposed in the introduction part, we make the following conclusions: (1) Hydraulic traits such as Px (water potential corresponding to x% loss in hydraulic conductivity), Sx (slope of the hydraulic vulnerability curve), and HSMs (hydraulic safety margins) differentiated markedly among the studied mangrove species: species inhabiting high salinity sites tended to have more negative P50 (water potential corresponding to 50% loss in hydraulic conductivity) and P88 (water potential corresponding to 88% loss in hydraulic conductivity), and smaller Sx, but P12 (water potential corresponding to 12% loss in hydraulic conductivity) and HSM displayed no salinity-associated trend. (2) Stomatal control over ψ (leaf water potential) decreased, and mangroves transitioned gradually from isohydry to anisohydry along the salinity gradient from the onshore to the offshore sites. (3) The onshore species of S. caseolaris and S. apetala had thinner leaves (larger SLA (specific leaf area )), while the offshore species of A. marina had significantly denser wood (larger WD (wood density)); both SLA and WD seemed to be more species-dependent rather than tolerance-related. More physiological features such as turgor loss points and a broader screening of mangrove species along topographically heterogenous coastal regions are needed to generalize our conclusions.
The reference list from the paper itself. Each links out to its DOI / PubMed record.
- 1Wang W.Q. Yan Z.Z. You S.Y. Zhang Y.H. Chen L.Z. Lin G.H. Mangroves: Obligate or facultative halophytes? A review Trees-Struct. Funct.20112595396310.1007/s 00468-011-0570-x · doi ↗
- 2Basha S.K.C. An overview on global mangroves distribution Indian J. Mar. Sci.201847766772
- 3Robert E.M.R. Koedam N. Beeckman H. Schmitz N. A safe hydraulic architecture as wood anatomical explanation for the difference in distribution of the mangroves Avicennia and Rhizophora Funct. Ecol.20092364965710.1111/j.1365-2435.2009.01551.x · doi ↗
- 4Barik J. Mukhopadhyay A. Ghosh T. Mukhopadhyay S.K. Chowdhury S.M. Hazra S. Mangrove species distribution and water salinity: An indicator species approach to Sundarban J. Coastal Conserv.20182236136810.1007/s 11852-017-0584-7 · doi ↗
- 5Reef R. Lovelock C.E. Regulation of water balance in mangroves Ann. Bot.201511538539510.1093/aob/mcu 17425157072 PMC 4332601 · doi ↗ · pubmed ↗
- 6Brodersen C.R. Roddy A.B. Wason J.W. Mc Elrone A.J. Functional status of xylem through time Annu. Rev. Plant Biol.20197040743310.1146/annurev-arplant-050718-10045530822114 · doi ↗ · pubmed ↗
- 7Parida A.K. Jha B. Salt tolerance mechanisms in mangroves: A review Trees-Struct. Funct.20102419921710.1007/s 00468-010-0417-x · doi ↗
- 8dos Santos T.B. Ribas A.F. de Souza S.G.H. Budzinski I.G.F. Domingues D.S. Physiological responses to drought, salinity, and heat stress in plants: A Review Stresses 2022211313510.3390/stresses 2010009 · doi ↗