Investigation of the ABCB1 Gene Polymorphism and Food Effects on the Avatrombopag Pharmacokinetics in Chinese Individuals: A Population Pharmacokinetic/Pharmacodynamic Analysis
Xin Liu, Lulu Chen, Gehang Ju, Chao Li, Bijue Liu, Yunzhou Fei, Xintong Wang, Yang Gao, Qingfeng He, Xiao Zhu, Dongsheng Ouyang

TL;DR
This study examines how food and genetic factors affect the drug avatrombopag in Chinese individuals, finding that dosing adjustments may not be necessary for consistent results.
Contribution
The study identifies the combined effects of food and CYP2C9/ABCB1 polymorphisms on avatrombopag pharmacokinetics in Chinese individuals.
Findings
Food intake reduced pharmacokinetic variability by about 50% in avatrombopag.
CYP2C9 intermediate metabolizers had 1.70-fold higher drug exposure under fed conditions.
ABCB1 (C1236T) heterozygotes showed 1.37-fold increased drug exposure.
Abstract
Background/Objectives: Avatrombopag (AVA), a thrombopoietin receptor agonist used to treat thrombocytopenia in patients with chronic liver disease, exhibits significant pharmacokinetic (PK) variability, particularly under fasting conditions. This study investigates the combined influence of food intake and genetic polymorphisms in CYP2C9 and ABCB1 on the PK and pharmacodynamics (PD) of AVA, with the goal of informing individualized dosing strategies. Methods: A pharmacogenetic analysis was conducted in 92 healthy participants, who received 20 mg of AVA under both fasting and fed conditions. A population PK/PD model was developed to evaluate the covariates effects on the PK variability. Monte Carlo simulations were used to predict AVA exposure and platelet count profiles under diverse dosing scenarios. Results: Food intake significantly reduced PK variability, with approximately 50%…
Genes, proteins, chemicals, diseases, species, mutations and cell lines named across the full text — each resolved to its canonical identifier and authoritative record.
Click any figure to enlarge with its caption.
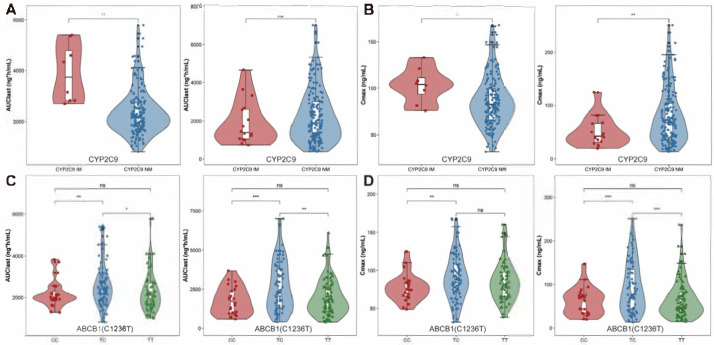 Figure 1
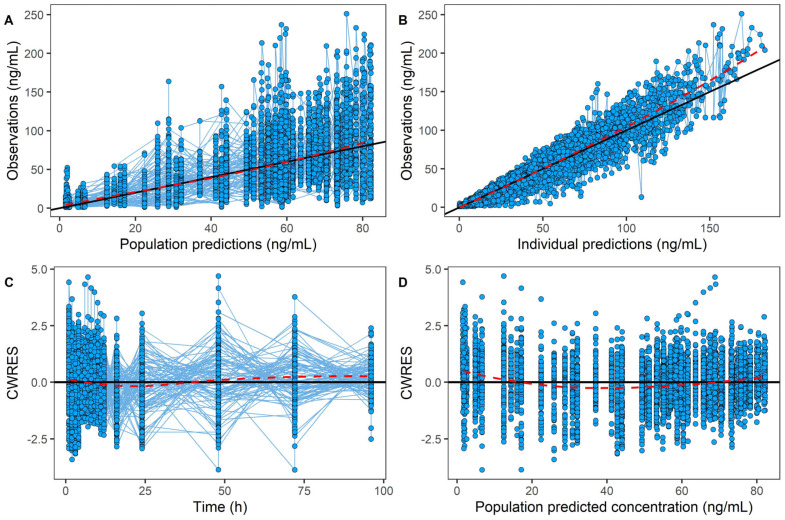 Figure 2
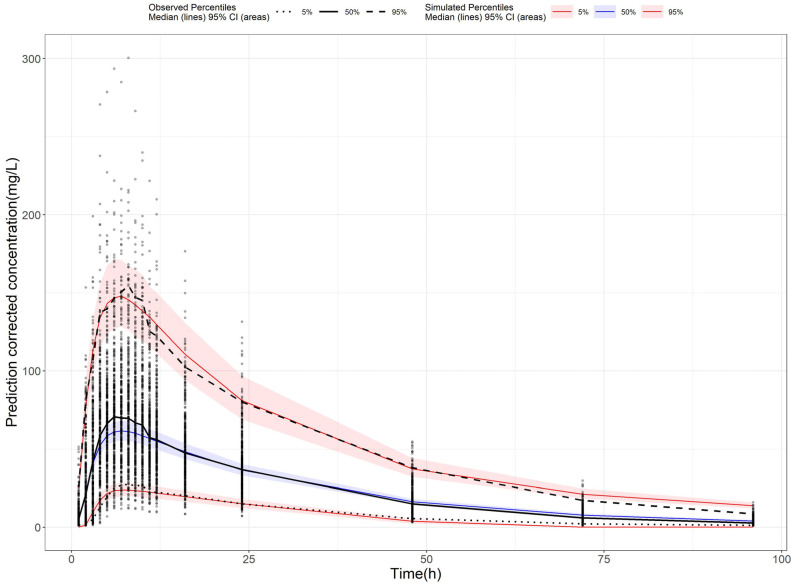 Figure 3
 Figure 4
- —Hunan Science and Technology Youth Talent Support Program
- —science and technology innovation Program of Hunan Province
- —Hunan Provincial Natural Science Foundation
Peer Reviews
No public reviews on file for this paper yet. If you reviewed it on a platform where reviews are public (OpenReview, ICLR, NeurIPS, ICML), you can paste yours below so the community can read it here.
Videos
No videos yet. Explain this paper in a talk, walkthrough, or lecture? Add one.
Taxonomy
TopicsDrug Transport and Resistance Mechanisms · Platelet Disorders and Treatments · Pharmacogenetics and Drug Metabolism
1. Introduction
Thrombocytopenia is a hematologic disorder characterized by abnormally low platelet counts, often associated with inherited factors or drug-induced immunologic destruction [1]. Globally, the estimated incidence of thrombocytopenia in adults ranges from 1.6 to 3.9 cases per 100,000 person-years [2,3,4,5]. Despite the relatively low incidence of fatal bleeding events, which is approximately 0.13 per person-year, managing and preventing bleeding remains a significant challenge. Pharmacologic therapy is the primary approach due to its safety and convenience compared with the platelet transfusion [2,3]. Thrombopoietin receptor agonists (TPO-RAs) are commonly used as second-line treatments for immune thrombocytopenia (ITP). These agents mimic endogenous thrombopoietin to stimulate megakaryocyte proliferation and differentiation in the bone marrow [4,5,6].
Avatrombopag (AVA), a second-generation TPO-RA, is approved for the treatment of thrombocytopenia, particularly in patients with chronic liver disease (CLD) [7]. It is increasingly used in ITP patients due to its superior efficacy and favorable benefit–risk profile compared to other TPO-RAs [8]. Although AVA was widely used in clinical practice, the variability of its PK has raised concerns among clinicians. Previous studies have shown that food intake significantly impacts both the inter- and intra-individual variability of AVA exposure. Notably, between-subject variability (BSV) is up to two-fold higher in the fasting state compared to the fed state [9,10,11,12]. Thus, oral administration with food is recommended in clinical practice to reduce the variability and ensure consistent therapeutic effects.
Cytochrome P450 (CYP) 2C9 genetic polymorphisms were identified as other key contributors to AVA variability, as it is the primary metabolized enzyme [1,13] of AVA. The genetic polymorphisms significantly influence AVA exposure [1,9,10], with *CYP2C9 *2, 3 alleles associated with higher exposure compared to *1 carriers. However, despite the AVA exposure caused by CYP2C9 polymorphism, it had limited impact on the platelet count changes [1]. Beyond the metabolic factors, transporters also play a significant role in the AVA PK process. P-glycoprotein (P-gp) [7,14], encoded by the ABCB1 gene, is primarily responsible for AVA disposition. Over 8000 single nucleotide polymorphisms (SNPs) [15] in ABCB1 have been identified, influencing over 50% of the pharmacokinetic processes of various drugs [16]. Additionally, P-gp plays an important role in TPO-RAs transport, with polymorphisms impacting both drug exposure and efficacy [17,18]. However, the effect of P-gp polymorphisms on AVA remains underexplored. Therefore, this study focused on CYP2C9 and ABCB1 due to their primary roles in AVA metabolism and transport. Other genes, such as CYP3A4, were not included due to their limited contribution [9] and lack of consistent evidence in AVA disposition.
Therefore, this study aims to investigate the underlying causes of AVA PK variability, with a particular focus on the influence of CYP2C9 and ABCB1 gene polymorphisms. Given that the average lifespan of platelets in circulation is 7–10 days [19], a population pharmacokinetic-pharmacodynamic (PPK-PD) method was employed to evaluate whether differences in AVA exposure across subpopulations translate into meaningful changes in platelet count profiles under various dosing regimens.
2. Results
2.1. Demographic Characteristics
This analysis included 5923 AVA concentration data points from 92 healthy participants. Among these individuals, 83 were male and 9 were female. The median age was 28, with a range from 18 to 45. Four major gene polymorphisms were analyzed in this study; one in CYP2C9 and three in ABCB1. For CYP2C9 polymorphisms, 90% of participants were homozygous for the wild-type allele (*1/*1), while 10% were heterozygous (*1/*3). No individuals were identified as homozygous for the variant allele (*3/*3). The genotype frequencies for the three ABCB1 variants were as follows:
For ABCB1 (C1236T), 14% of participants were homozygous wild-type, 51% were heterozygous, and 35% were homozygous variant.
For ABCB1 (C3435T), 40% were homozygous wild-type, 47% were heterozygous, and 13% were homozygous variant.
For ABCB1 (G2677T/A), 20% were homozygous wild-type, 67% were heterozygous, and 13% were homozygous variant.
The details of the demographic information of the participants in this study are summarized in Table 1.
2.2. PK Assessment
2.2.1. Food and Sex Effects on PK
The primary PK parameters of AVA under different food intake conditions and across sexes are summarized in Table 2. The C_max_ was significantly higher in the fed state compared to the fasting state, with a geometric least-squares mean ratio of 121.87% (95% CI: 105.45–140.85, p = 0.008), while AUC was minimally affected (Table S1). This suggests that food intake influences the PK profile of AVA in the Chinese population. Regarding sex differences, no statistically significant variation in AVA exposure was observed between males and females (Table S2).
2.2.2. Genotypes Effects on PK
All genetic variants were in Hardy–Weinberg equilibrium. The PK parameters across different CYP2C9 phenotypes and ABCB1 genotypes are summarized in Table S3. For CYP2C9 phenotypes, IMs exhibited significantly higher values for both t_1/2_ (25.68 vs. 17.72 h) and AUC_0-t_ (3704.04 vs. 2180.36 ng×h/mL) compared to NMs in the fed state, while C_max_ was not significantly affected by CYP2C9 status (Table S4). In the fasting state, similar results were observed, with t_1/2_ substantially increased in the IM group relative to the NM group (p < 0.001). However, exposure parameters such as C_max_ and AUC_0-t_ displayed an unexpected trend, with the NM group showing slightly higher values than the IM group, though these differences were not statistically significant (Table S4; Figure 1A,B and Figure S1).
Regarding the effects of ABCB1 genotypes on AVA pharmacokinetics, no significant differences were observed in C_max_ and AUC values across the ABCB1 (C3435T) genotypes (Table S5, Figure S2A,B). Similarly, no significant associations were found between the ABCB1 (G2677T/A) polymorphism and C_max_ or AUC parameters (Figure S2C,D). However, for ABCB1 (C1236T), a significant difference in AVA exposure was detected between heterozygous and homozygous genotypes for both AUC and C_max_ (Figure 1C,D). In both fasting and fed states, individuals with homozygous wild-type and homozygous mutant genotypes displayed similar exposure levels, with C_max_ ratios of 102.43% in the fasting state and 113.67% in the fed state, and AUC_0-t_ ratios of 108.67% (fasting) and 108.38% (fed). In contrast, the exposure differences between heterozygous and homozygous genotypes were notable (Table S7, Figure 1). The C_max_ ratio of TT/TC was approximately 70.96% in the fasting state and 93.27% in the fed state. For TC/CC, the C_max_ and AUC_0-t_ ratios in the fasting state were 144.35% and 144.04%, respectively; similar trends were observed in the fed state, with C_max_ and AUC values of 121.87% and 120.93%, respectively. These findings suggest that the ABCB1 (C1236T) polymorphism significantly influences AVA exposure. It warrants further investigation to explain its impact on drug response.
2.3. Population Pharmacokinetic Model of AVA
To further investigate the effects of food intake and genetic polymorphisms on AVA exposure, a PPK model was developed. A one-compartment model with nine transit compartments, along with first-order absorption and elimination, was selected as the final model. The final model provided precise parameter estimates, with an apparent clearance (CL/F) of 7.85 L/h, an apparent volume of distribution (Vd/F) of 199 L, and an absorption constant (Ka) of 0.582/h. Most relative standard errors were below 30% (Table 3), demonstrating the model’s reliability. Incorporating the food–genotype co-effect on the absorption fraction (Fa) reduced the OFV by 15.96, indicating that both food and genotype co-effects significantly impact AVA absorption extent. The bootstrap analysis showed the parameter estimates from the final model closely matching the median values and falling within the 95% confidence interval (Table 3). This alignment confirms the stability and reproducibility of the model. Goodness-of-fit (GOF) diagnostic plots (Figure 2) showed unbiased model predictions and successful convergence. Additionally, the visual predictive check (VPC, Figure 3) demonstrated that most observed values were within the 95% prediction interval, confirming that the final model had strong predictive performance.
2.4. Population Pharmacokinetic and Pharmacodynamic Simulation
Given that platelets have a short lifespan of 7–10 days in the circulation [19], it is important to investigate how different AVA exposure levels affect platelet counts in various groups with distinct exposure patterns. Simulation results for different AVA dosing regimens are summarized in Table 4 and illustrated in Figure 4. When dosed at 60 mg for five consecutive days, the maximum exposure difference between subpopulations was a 1.37-fold increase in C_max_ and AUC_τ_ (the comparison between the TC and non-TC under fasting state). Despite this, platelet counts showed no significant variation (61.56 × 10^9^ vs. 53.23 × 10^9^ for C_max_, 38,331.20 × 10^9^ vs. 35,907.80 × 10^9^ for AUC), indicating that dose adjustments based on ABCB1 (C1236T) genotype or fasting state are unnecessary. Similar results were observed with a 40 mg dose for five consecutive days, where the PK exposure difference remained 1.37-fold, and platelet counts were nearly identical in these two subpopulations. Taken together, these results indicate that, although AVA exposure differed significantly by genotype and food condition, the resulting platelet count responses were only minimally affected.
3. Discussion
AVA, a thrombopoietin receptor agonist, is widely prescribed as a second-line treatment for thrombocytopenia in patients with CLD [20,21]. In this study, a single dose of 20mg AVA was administrated to healthy Chinese participants; a large variability was found in the fasting state. The pharmacogenetic analysis found a difference in C_max_ and AUC across ABCB1 (C1236T) and CYP2C9 genotypes in both the fasting and fed state. To further quantify the effects of the food and genotype, a PPK-PD model was developed. The results showed that, although a 1.37-fold exposure difference was observed between ABCB1 (C1236T) homozygote and heterozygote in the fasting state, the resulting difference in platelet counts was minimal.
Food intake was found to significantly affect the variability of AVA’s PK parameters, especially C_max_, without altering the extent of absorption (Table S1). This aligns with findings from Nomoto et al. [1,9,10], who reported similar effects in a White population. The food intake influenced C_max_ but not mean PK values. The BSV for CL/F and Vd/F was notably higher in the fasting conditions compared to the fed states (62.4% vs. 36.6% for CL/F and 64.5% vs. 31.1% for Vd/F, respectively). Similar findings were also reported in the label of AVA, which directly supports the recommendation of taking medicine with meals. Since AVA is a Biopharmaceutical Classification System (BCS) Class II compound with low solubility [9], food may reduce PK variability by slowing gastrointestinal transit, thereby enhancing uniformity in AVA absorption and solubility. This mechanism explains the lower variability in the fed state [1].
AVA undergoes extensive metabolism primarily via CYP2C9, which accounts for approximately 44% of the administered dose [13]. Although in vitro studies suggest both CYP2C9 and CYP3A4 enzymes contribute equally, in vivo data indicate that CYP2C9 plays a more dominant role [9]. Previous pharmacogenetic studies showed that CYP3A polymorphisms had no significant impact on AVA PK, while CYP2C9 variants correlated with higher exposure in IMs than in NMs [1]. The allele frequency for *CYP2C93 was 3.26%, while *CYP2C91 accounted for 96.74% in this study, consistent with a previous report among Asian participants [22], which reported *CYP2C9**3 had almost a 3% frequency in Asian population. CYP2C9 IMs demonstrated higher exposure than NMs under fed conditions (Figure 2). However, in the fasting state, IMs exhibited lower exposure than NMs, likely due to high variability and the small sample size of IMs. Therefore, large numbers of clinical studies are needed to confirm these findings (Figure 1 and Table S4).
In addition to investigating CYP2C9 polymorphism effects on the AVA exposure, this was the first study to evaluate the effects of ABCB1 polymorphisms on AVA’s PK and PD characteristics. The ABCB1 polymorphism is known to influence the bioavailability of oral drugs [23,24], potentially affecting clinical outcomes [25,26]. For ABCB1 polymorphisms, three common variants were examined: C1236T, G2677T/A, and C3435T. The frequencies observed for each were similar to those reported in other Asian populations [27,28,29]. Specifically, for ABCB1 (C1236T), 46.74% were heterozygous (TC), 40.22% were homozygous variant (TT), and 13.04% were homozygous wild-type (CC). When comparing single-dose PK parameters across ABCB1 genotypes, the largest exposure difference was observed between the TC and CC genotypes in ABCB1 (C1236T), with a 1.44-fold difference (Table S7). While there was no significant difference in exposure parameters detected between the different genotypes of G2677T/A, and C3435T.
Although our findings suggest a potential impact of the C1236T variant on AVA exposure, the underlying mechanisms remain unclear. This effect may be attributable to educed P-gp activity in TC carriers, resulting in decreased efflux and increased systemic concentrations. However, existing evidence on the functional impact of ABCB1 polymorphisms is conflicting [26,30]. Studies have reported both increased [31,32,33] and decreased [34,35] ABCB1 mRNA or protein expression in relation to 3435T or 2677T alleles, depending on the population and tissue examined. The functional consequences of C1236T are even less consistent, with limited data suggesting possible effects on drug clearance for certain substrates [36]. Overall, the genotype–function relationship for ABCB1 remains poorly defined [16], and our findings warrant cautious interpretation and further mechanistic validation.
Given that AVA-induced platelet increases are evident 3–5 days after administration [1], with peak changes at 6–10 days, it is essential to assess how PK change translates into PD effects, especially in steady-state conditions. A PPK-PD model was developed to characterize the differences in PK and PD across genotypes. However, food intake had a substantial impact on the PK variability, and the effects of genetic polymorphisms differed between fasting and fed state. This indicated that food may play a more important role in AVA’s exposure and between-subjects variability. Thus, to better characterize the gene-food co-effects on AVA’s exposure, a more mechanistic model was developed. Although the PK data were obtained from healthy volunteers, the PD model was based on CLD patients, providing a clinically relevant PK-PD framework. We acknowledge that disease-related physiological changes may alter PK profiles; however, the primary objective of our analysis was not to predict absolute platelet counts in patients but to explore the relative influence of PK variability (e.g., due to genotype or food intake) on PD outcomes. This approach provides mechanistic insight into the robustness of platelet count outcomes despite inter-individual PK differences. The model not only considered the genotypes and food effects but also took the interaction between food and genotype into consideration. The results showed that, despite the significant exposure differences between ABCB1 (C1236T) heterozygotes and homozygotes, platelet counts did not differ significantly between these groups, suggesting that dosage adjustments are not necessary based on ABCB1 genotype alone.
This study has several limitations. First, the analysis population was derived from a bioequivalence study involving relatively homogeneous participants, which may limit the ability to identify certain covariates, such as body weight, that were identified in another study [10]. Second, the sample size for *CYP2C9**3 carriers was quite low (n = 6), which may have affected the reliability of the results regarding CYP2C9 IMs in the fasting state. While our study provides novel insights into the interplay between genotype, food intake, and AVA pharmacokinetics, the clinical implications of these findings require further validation. Future work should incorporate larger, more genetically diverse patient cohorts to assess whether PK variability may translate into PD alterations in real-world settings.
4. Materials and Methods
4.1. Study Population
This study included healthy volunteers enrolled from a single-center, two-sequence, four-period bioequivalence trial conducted at the Clinical Trials Unit of Hunan Province People’s Hospital (Changsha, Hunan). All trials were performed in compliance with the principles outlined in the Declaration of Helsinki for biomedical research involving human subjects. Informed consent was obtained from all participants for both clinical trial participation and pharmacogenetic analysis. Participants were free to withdraw from the study at any time. This study was approved by the Institutional Review Board (IRB) in the Hunan Province People’s Hospital (approval number: [2023]-32.1).
4.2. Study Design and Pharmacokinetic Assessments
Participants received a single 20 mg dose of AVA with 200 mL of water under both fasting and fed conditions. In the fed condition, subjects consumed a high-fat, high-calorie meal approximately 30 min prior to dosing, providing a total of 800–1000 kcal, approximately 150 kcal from protein, 250 kcal from carbohydrates, and 500–600 kcal from fat. This open-label, crossover study consisted of four periods with two sequences, separated by a 14-day washout. Blood samples were collected at pre-specified times: pre-dose (0 h) and at 1, 2, 3, 4, 5, 6, 7, 8, 9, 10, 11, 12, 16, 24, 48, 72, and 96 h post-dose. Samples were centrifuged at 3500 rpm for 10 min at 4 °C and stored at −70 °C until analysis.
AVA concentrations were quantified using ultra-performance liquid chromatography-tandem mass spectrometry (UPLC-MS/MS) with an AVA-D8 internal standard (UPLC I-Class and Xevo TQ-S, Waters Corporation, Milford, MA, USA). The analysis was performed on a Waters ACQUITY UPLC-BEH C18 column (1.7 μm, 2.1 mm × 50 mm) with a mobile phase of 2 mM ammonium acetate (0.1% formic acid) and acetonitrile as phase A and B, respectively, using isocratic elution at a flow rate of 0.4 mL/min. Detection employed an electrospray ionization source (ESI) in positive ion mode. The ion pairs monitored were m/z 649.44→266.95 for AVA and m/z 659.10→267.00 for AVA-D8, with a linear range of 1.000–400.000 ng/mL. The retention time for both the analyte and internal standard was 0.63 ± 0.1 min. Following current US FDA bioanalytical validation guidelines, this modified method for AVA quantification in plasma was validated and deemed reliable for pharmacokinetic studies.
4.3. Genotyping of CYP2C9 and ABCB1
CYP2C9 and ABCB1 DNA was extracted from blood samples using the Universal Genomic DNA Extraction Kit provided by GenMagBio (Beijing, China) and quantified using an Ultra-micro spectrophotometer-Nano Drop One provided by Thermofisher (Waltham, MA, USA). Genotyping was performed by Duxact Inc. (Changsha, China), focusing on *CYP2C9**1, *3 (rs1057910), ABCB1 (C1236T) (rs1128503), ABCB1 (G2677T/A) (rs2032582), and ABCB1 (C3435T) (rs1045642) variants. The TaqMan MGB Probe Method on a qPCR platform was used to identify SNPs. Volunteers were grouped based on their genotype; samples without a clear amplification profile were excluded from analysis. For CYP2C9, the *1/*1 carriers were classified into the normal metabolizer (NM) group, the individuals carrying the *1/*3 variant were classified into the intermediate metabolizer (IM) group, and the *3/*3 were assigned to the poor metabolizer (PM) group.
4.4. Population Pharmacokinetic Model
Non-linear mixed-effects modeling was conducted using NONMEM (version 7.5, ICON Development Solutions, San Antonio, TX, USA) with the first-order conditional estimation with interaction (FOCE-I) algorithm. Inter-individual variability (IIV) was modeled using an exponential approach, while residual variability was tested using proportional, additive, and combined error models, and the best performing one was selected. Covariate analysis included demographic data (e.g., age, weight, sex), lab test results (e.g., ALT, AST), clinical trial conditions (e.g., food intake), and genotype information. A stepwise covariate modeling strategy was used (forward selection: p < 0.05; backward elimination: p < 0.01). Covariates were selected based on statistical significance and clinical relevance.
Model evaluation was performed using successful convergence, objective function value (OFV), Akaike information criterion (AIC), parameter precision, goodness-of-fit (GOF) plots, visual predictive checks (VPCs), and non-parametric bootstrap analysis to confirm model robustness.
4.5. Simulations of PPK-PD
To investigate the potential impact of PK variability on the PD response of AVA, a previously published PD model developed in chronic liver disease (CLD) patients [10] was adopted and linked to our PK model derived from healthy Chinese participants. Ethnic sensitivity was accounted for by applying a 32% slope reduction for East Asians. This enabled simulation of platelet count trajectories under different PK profiles, stratified by food intake and ABCB1 genotype. Simulations were performed using a typical virtual patient, in which key covariates (e.g., genotype, food status) were varied to assess their impact.
Model simulations were conducted under two dosing scenarios (60 mg QD for platelet count <40 × 10^9^/L; 40 mg QD for 40–50 × 10^9^/L; both for 5 consecutive days) [7] to evaluate the impact of the genotypes (TC vs. non-TC) and food conditions on drug exposure and platelet count profiles. The key exposure parameters (PK: C_max_, AUC_τ_ in the last dose; PD: platelet C_max_, AUC_0-t_ from day 1 to day 40) were compared to reveal the exposure and response difference in different populations.
4.6. Statistical Analysis
Non-compartmental analysis was conducted using WinNonLin (Version 6.3, Certara, Pennsylvania, PA, USA) to calculate PK parameters, including terminal half-life (t_1/2_), maximum plasma concentration (C_max_), time to reach C_max_ (t_max_), area under the plasma concentration–time curve up to the last measurable concentration (AUC_0–t_), and AUC extrapolated to infinity (AUC_0–∞_). ANOVA, following natural log-transformation of major PK parameters, was used to evaluate the effects of food intake, sex, and genotype on AVA pharmacokinetics.
5. Conclusions
This study provides important insights into the PK and PD of AVA, particularly in relation to food intake and genetic variability in CYP2C9 and ABCB1. Our findings confirmed that food significantly reduces PK variability. Additionally, although CYP2C9 or ABCB1 gene polymorphism had statistically significant effects on AVA’s exposure, they had no clinically significant impact on AVA’s PD response in the Chinese participants. There was no need to adjust the doses according to the genotypes of CYP2C9 or ABCB1 for the Chinese participants.
The reference list from the paper itself. Each links out to its DOI / PubMed record.
- 1Nomoto M. Pastino G. Rege B. Aluri J. Ferry J. Han D. Pharmacokinetics, Pharmacodynamics, Pharmacogenomics, Safety, and Tolerability of Avatrombopag in Healthy Japanese and White Subjects Clin. Pharmacol. Drug Dev.2018718819510.1002/cpdd.34928339166 · doi ↗ · pubmed ↗
- 2Mc Fadyen J.D. Kaplan Z.S. Platelets Are Not Just for Clots Transfus. Med. Rev.20152911011910.1016/j.tmrv.2014.11.00625680870 · doi ↗ · pubmed ↗
- 3Fustolo-Gunnink S.F. Roehr C.C. Lieberman L. Christensen R.D. Van Der Bom J.G. Dame C. Del Vecchio A. Keir A.K. Curley A. Stanworth S.J. Platelet and Red Cell Transfusions for Neonates: Lifesavers or Trojan Horses?Expert. Rev. Hematol.20191279780010.1080/17474086.2019.165782431423859 · doi ↗ · pubmed ↗
- 4Hitchcock I.S. Hafer M. Sangkhae V. Tucker J.A. The Thrombopoietin Receptor: Revisiting the Master Regulator of Platelet Production Platelets 20213277077810.1080/09537104.2021.192510234097561 PMC 8292222 · doi ↗ · pubmed ↗
- 5Erickson-Miller C.L. Delorme E. Tian S.-S. Hopson C.B. Landis A.J. Valoret E.I. Sellers T.S. Rosen J. Miller S.G. Luengo J.I. Preclinical Activity of Eltrombopag (SB-497115), an Oral, Nonpeptide Thrombopoietin Receptor Agonist Stem Cells 20092742443010.1634/stemcells.2008-036619038790 PMC 2729672 · doi ↗ · pubmed ↗
- 6Broudy V.C. Lin N.L. AMG 531 Stimulates Megakaryopoiesis in Vitro by Binding to Mpl Cytokine 200425526010.1016/j.cyto.2003.05.00114693160 · doi ↗ · pubmed ↗
- 7DOPTELET® (Avatrombopag) Tablets, for Oral Use Available online: https://www.accessdata.fda.gov/drugsatfda_docs/label/2024/210238 s 009lbl.pdf(accessed on 26 May 2025)
- 8Deng J. Hu H. Huang F. Huang C. Huang Q. Wang L. Wu A. Yang J. Qin D. Zou W. Comparative Efficacy and Safety of Thrombopoietin Receptor Agonists in Adults With Thrombocytopenia: A Systematic Review and Network Meta-Analysis of Randomized Controlled Trial Front. Pharmacol.20211270409310.3389/fphar.2021.70409334393785 PMC 8355583 · doi ↗ · pubmed ↗