Markers Associated with Starch, Protein and Asparagine Content in Grain of Common Wheat
Kinga Rączka, Przemysław Matysik, Tadeusz Drzazga, Ada Dorczyk, Marta Olejniczak-Idczak, Dorota Tyrka, Mirosław Tyrka

TL;DR
This study identifies genetic markers linked to protein, starch, and asparagine levels in wheat grains, which can help improve wheat quality for processing.
Contribution
The study reports novel molecular markers and candidate genes influencing grain quality traits in wheat.
Findings
14 markers for grain protein content (GPC) were identified, with one explaining 10.2% of variation.
A gene encoding sucrose synthase was linked to starch content, and another gene linked to asparagine content was identified.
The findings offer molecular tools to enhance wheat grain quality.
Abstract
Background: Grain protein (GPC) and grain starch (GSC) content in common wheat determines suitability for further end-use processing and is an important quality factor. The level of free asparagine in grains (GFAC) significantly affects suitability for thermal processing. The aim of this genome-wide association study (GWAS) was to identify markers associated (MTA) with the levels of GPC, GSC and GFAC in elite winter wheat breeding lines, and to identify candidate genes. Methods: In total, 344 winter wheat lines were phenotyped and genotyped with DArTseq markers. Results: This GWAS revealed 14 MTAs for GPC, 40 for GSC and 43 for GFAC. The new markers were identified and explained from 6.3% to 12.2% of phenotypic variation. For GPC, the region adjacent to marker 4990459 (QGpc.rut.2D) explained 10.2% of the variation and was stable between two years. The novel gene TraesCS7A03G037500,…
Genes, proteins, chemicals, diseases, species, mutations and cell lines named across the full text — each resolved to its canonical identifier and authoritative record.
Click any figure to enlarge with its caption.
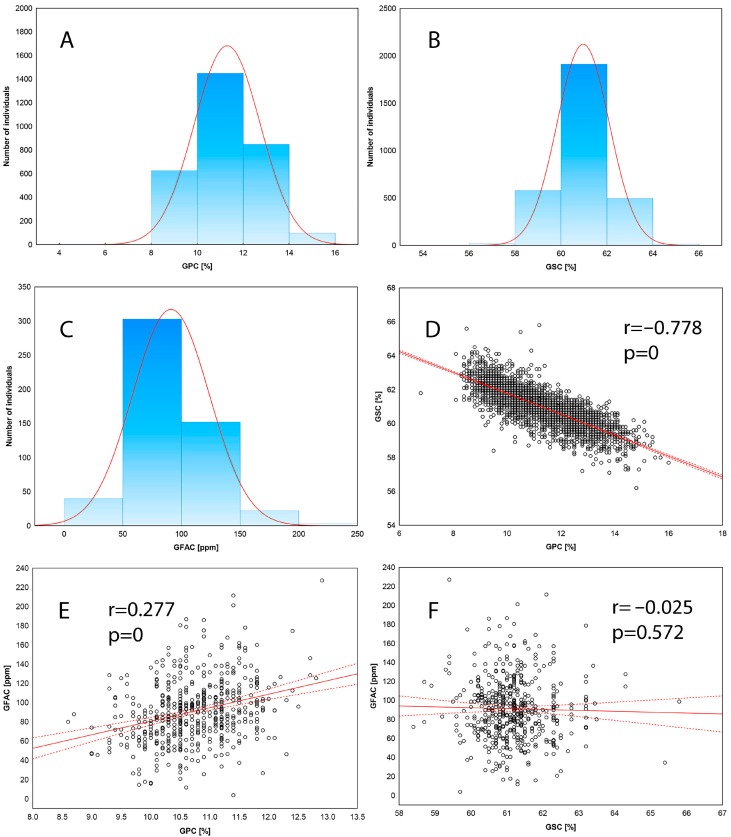 Figure 1
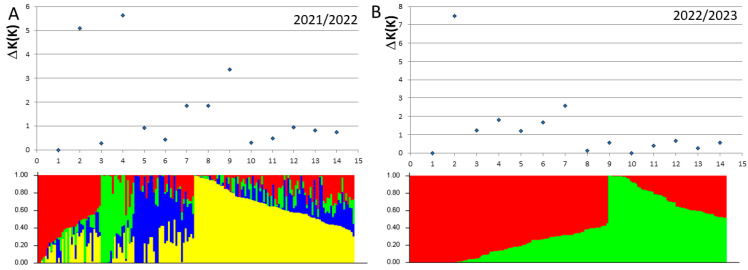 Figure 2
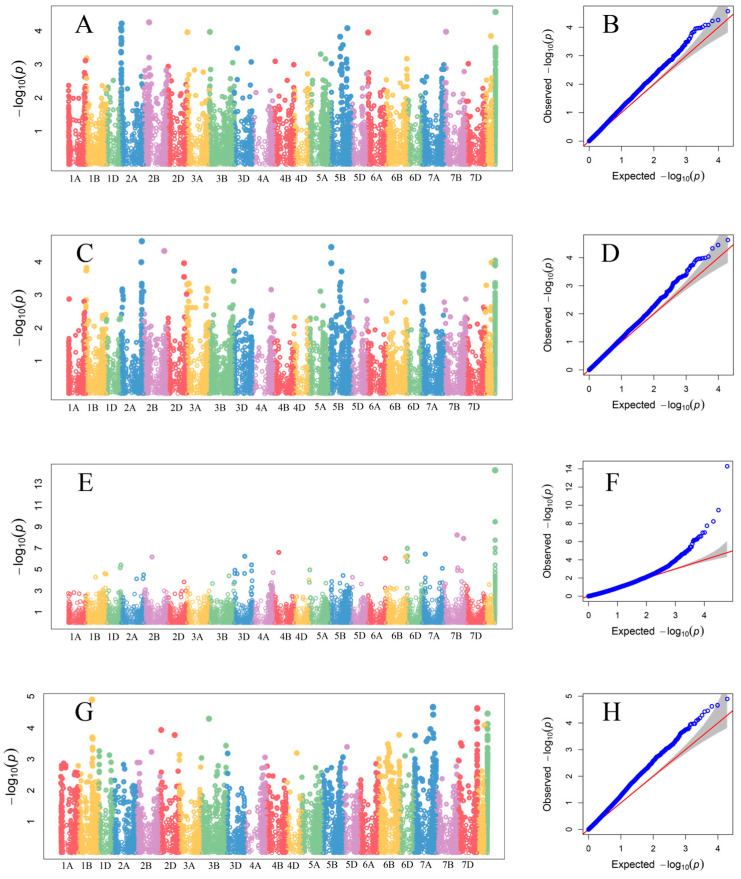 Figure 3
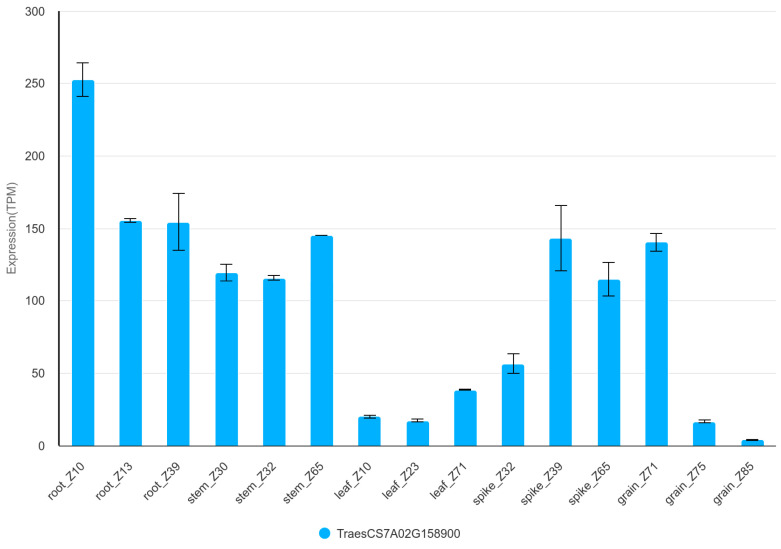 Figure 4
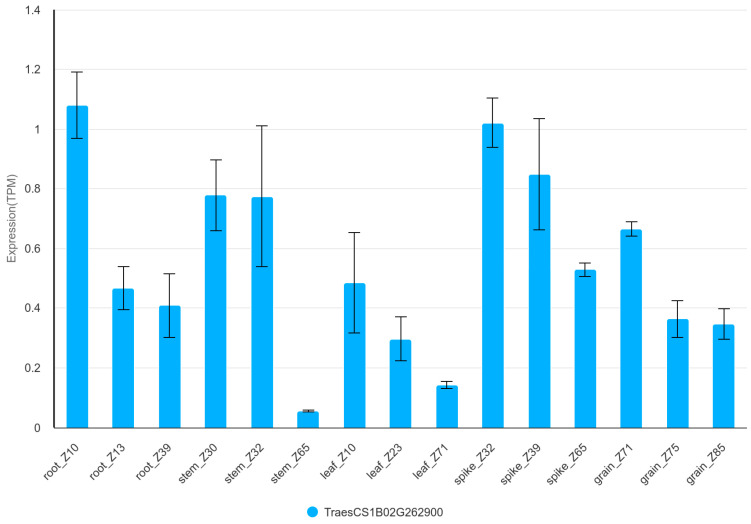 Figure 5
- —Ministry of Agriculture and Rural Development of Poland
Peer Reviews
No public reviews on file for this paper yet. If you reviewed it on a platform where reviews are public (OpenReview, ICLR, NeurIPS, ICML), you can paste yours below so the community can read it here.
Videos
No videos yet. Explain this paper in a talk, walkthrough, or lecture? Add one.
Taxonomy
TopicsWheat and Barley Genetics and Pathology · Phytase and its Applications · Food composition and properties
1. Introduction
Common wheat (Triticum aestivum L.) grown worldwide on more than 213 million hectares is, beside rice and corn, the third most important crop [1]. It is expected that the demand for this crop will increase by about 70 percent over the next 30 years [2]. Therefore, wheat yield improvement is a very important worldwide issue. Almost 60% of produced wheat is destined for food [3], and the main storage components of wheat grains are starch and proteins [2,4]. The content of starch and proteins is different in segments of wheat grain. The main (80–85% of the dry weight) source of starch in wheat grain is endosperm consisted in 65–80% of starch. An embryo and bran contribute to 2–3% and 13–17% of dry weight, respectively, and contain below 2% of starch [5,6]. Proteins are more evenly distributed in the wheat embryo (20–25%), bran (10–15%) and endosperm (7–15%) [6,7,8]. In wheat, the most important quality yield are related to GSC and GPC. Starch and grain protein content are quantitative, interdependent traits, dependent on both genetic predisposition and environmental conditions [9,10] such as crop rotation, annual rainfall, cultivation practices, soil fertility and nitrogen fertilizer [10]. The control of these traits takes place through the synchronized action of a number of loci [10,11]. Wheat produces transitional and storage starch with the enzymes coded by waxy (Wx) genes [9,12,13,14,15]. Genetic variation in genes involved in starch synthesis and accumulation during grain development directly affects wheat yield and quality of grains [16,17]. Similarly, the total protein content, its composition and the gliadin–glutenin ratio affects the quality of the flour and the bakery products [8,9,10,18,19].
Identification and utilization of loci responsible for GSC and GPC along with appropriate crop management appears to be a suitable agricultural strategy to increase yield of wheat [10]. GWAS and biparental mapping are the two main approaches to identify loci associated with GSC and GPC. GWAS on a panel of 372 diverse European wheat varieties resulted in identification of marker trait association (MTA) on chromosome 6A (QGpc.ink-6A) which controls 23.42% variation of GPC and 13.20% of GSC, but with the opposite allelic effects [10]. GSC specific effects were found on chromosomes 2A, 2B, 3A, 3B, 4A, 6A, and 6B [10,17]. Chromosomal localization of some of these effects overlaps with loci involved in amylopectin (2A, 2B, 3A, 3B, 4A, 5A, 5B, 6A, 6B, 7A and 7B) and amylose synthesis (1B, 2A, 2B, 3A, 4A and 5A) active during the grain development process [9,17]. Mapping of quantitative trait loci (QTL) on different biparental populations revealed QTLs associated with GSCs on chromosomes 1A, 1B, 1D, 2A, 2D, 3B, 3D, 4A, 4D, 5A, 5B, 5D, 7A, 7B, and 7D [9,17,20,21]. Also, the waxy genes encoding granule-bound starch synthase (GBSSI, EC 2.4.1.21) are located at three loci Wx-A1, Wx-B1 and Wx-D1, on chromosomes 7AS, 4AL and 7DS, respectively [12,13,22,23,24]. GWAS revealed loci associated with the GPC on chromosomes 1A, 1B, 1D, 2A, 2B, 2D, 3A, 5A, 5B, 5D, 6A, 6B and 7B [9,10,25,26]. Some Single Nucleotide Polymorpism (SNP) markers useful for breeding to increase GPC have been selected [9,10,25]. QTL mapping approaches for GPC revealed the most important effects on chromosomes 6B and 7B. In addition, QTLs affecting GPC during grain development were detected on chromosomes 1B, 2A, 3B, 3D and 7A [9].
Wheat used in the heat-processed bakery products is a source of acrylamide. Acrylamide is formed from free asparagine and reducing sugars (glucose, fuctose, maltose) [27,28,29,30,31,32,33,34,35] i.e., in the Maillard reaction [31,36]. The free asparagine (Asn) is an amino acid that together with glutamate and glutamine in higher plants is responsible for the storage and transport of nitrogen [37,38]. The GFAC of grain products depends on the genotype [27,31,39] and increases under sulfur-deficient conditions [40,41]. GWAS resulted in the identification of MTAs for GFAC on chromosomes 1A, 1B, 2A, 2B, 2D, 3B, 4A, 4B, 5A, 6A, 6B, 6D, 7A, and 7B [39,42,43,44,45]. Aspartate synthase is the enzyme responsible for asparagine synthesis in plants. It catalyzes the ATP-dependent transfer of the amide group of glutamine to aspartate. The products of the reaction are glutamate and asparagine [37]. In common wheat, the asparaginase synthetase gene family consists of 5 genes per genome [38,46,47].
The purpose of the present study was to identify MTAs for GSC, GPC, and GFAC in common wheat elite breeding lines in GWAS. Cultivars with elevated protein contents and reduced levels of free asparagine may be more suitable for the bakery industry. The knowledge of regions responsible for different level of GSC, GPC, and GFAC in modern germplasms can be exploited to improve genetic gains and the breeding of varieties with desired set of traits.
2. Materials and Methods
2.1. Plant Material
In total, 343 elite breeding lines and 3 reference cultivars of common winter wheat (Table S1) from on-going breeding programs were planted at three research stations located in Poland at Kobierzyce (KBP, N 50°58′34″, E 16°55′53″), Smolice (SMH, N 51°41′58″, E 17°10′29″) and Strzelce (STH, N 52°18′52″, E 19°24′20″) in 2021–2022 and 2022–2023 cropping seasons. Therefore, 6 environments were assigned kob22, kob23, smh22, smh23, sth22 and sth23 for experimental stations located in Kobierzyce, Smolice and Strzelce, respectively, and cropping seasons 2022 and 2023. The experiments were set up in a split-block design in three sets of 59–60 genotypes including 3 standard cultivars (Artist, Formacja, and Kilimanjaro in 2022, and Artist, Formacja and Symetria in 2023) and 18 incomplete blocks per set. Each block consisted of 10 randomly assigned genotypes, accounting for three repetitions per genotype. Kernels were harvested from a 10 m^2^ plots (8 rows, 12.5 cm apart, and 10 m long), stored and used for chemical analyses.
2.2. Phenotypic Data Collection
Near infrared spectroscopy (NIR) (FOSS Infratec Nova analyzer, Hilleroed, Denmark) was used to determine the GSC, and GPC in the [%] unit. The mean humidity of grains was 11.4%. The samples collected in Strzelce in 2022 were used for determination of GFAC in flour. The isolation of free asparagine was carried out according to [48] with some modifications. The amount of wheat flour and acid added was reduced 4-fold from 10 g and 30 mL to 2.5 g and 7.5 mL, respectively. GFAC was determined on Varioskan LUX spectrophotometer (Thermo Fisher Scientific, Waltham, MA, USA) in 96-well plates according to the instructions provided with the K-ASAM L-ASPARAGINE/L-GLUTAMINE/AMMONIA (RAPID) reagent kit (Megazyme Bray, Co. Wicklow, Ireland). The volume of sample added was increased from 10 to 25 µL. Incubation times were increased from 5 min to 36 min, and 2 × 75 min between the first (conversion of L-glutamine into L-glutamate), the second (ammonia is converted to L-glutamate in the presence of NADPH, glutamate dehydrogenase (GIDH) and 2-oxoglutarate) and the third reaction (hydrolysis to L-aspartate and ammonium ions by asparaginase).
2.3. Genotyping
DNA was isolated from 2-week-old seedlings according to CTAB (cetyltrimethylammonium bromide) method recommended by Diversity Arrays Technology Pty Ltd. (Bruce, Australia). The quality of samples was checked on 1.5% agarose and DNA concentration was determined with spectrophotometer. In total, 343 winter wheat lines were genotyped with DArTseq markers in 2022 or 2023 season. Analysis of 170 genotypes carried out in 2022 resulted in 19,483 DArTseq markers (8952 silicoDArTs, and 10,531 SNPs). For the panel of 174 lines, 61,317 DArTseq markers (25,934 silicoDArTs and 38,933 SNPs) were obtained in 2023. Markers with minor allele frequencies higher than 0.05 and missing rate lower than 0.05 (on average 8% and 19% of missing data in 2022, and 2023, respectively) were used for the analysis.
2.4. Data Analysis
The distribution of the data, descriptive statistics, correlations and ANOVA was obtained with Statistica 13.3 software (Tibco, CA, USA). For the genotypes studied, the BLUP (Best Linear Unbiased Prediction) and the heritability were calculated using the R package—“Phenotype” [49]. It is based on the functionality of the lme4 package, which is used to fit linear models with mixed effects [50]. The heritability was calculated according to the formula: H^2^ = V_G_/(V_G_ + V_E_), where V_G_ and V_E_ denote the genetic and environmental variance components, respectively [51]. Markers spaced every 5 Mbp were selected for the analysis of the population structure [52]. Evenly distributed 2097 and 2782 SNP markers were obtained for sets of genotypes analyzed in 2022 and 2023, respectively. STRUCTURE v 2.2 [53] software was used to calculate the population structure with K values ranging from 1 to 15, iterated 10,000 times.
The BLUP values were subjected to GWAS. General Linear Model (GLM), Mixed Linear Model (MLM), and Compressed Mixed Linear Model (CMLM) models of the GAPIT package were tested with iPat (Intelligent Prediction and Association Tool) [54]. False Discovery Rates were calculated for the p-values to select significant effects.
2.5. Identification of Candidate Genes
Positions of selected MTA loci with the lowest p-values accompanied by the highest or main effect were established on IWGSC v2.1 genome sequence in the Unit Resources Genomics-Info database (URGI) [55] using the sequences of significant SNP markers. For selected MTAs with the highest effects, flanking genes located within 5 Mbp window were selected. Gene ontology (GO) annotations were checked on Ensembl Plants (http://plants.ensembl.org/ (accessed on 14 April 2025) and Uniprot (https://www.uniprot.org/ (accessed on 14 April 2025). The expression profiles of selected genes with functions directly or indirectly related to the traits studied were retrieved from WheatOmics 1.0 [56].
3. Results
3.1. Phenotypic Data
Analysis of variance showed significant variation in the average starch and protein contents in grains and a significant influence of environment for GSC and GPC. The average GSC in 344 lines of wheat was 60.97% and varied between environments in a narrow range from 60.16 (smh22) to 62.27% (sth23) (Table 1). Higher variation of GPC was found. On average, grains contained 11.31% protein and the content varied from 9.61% (sth23) to 12.92 (smh22). The greatest variability was found for GFAC, which ranged from 26.67 to 227.16 ppm in the varieties studied. With two exceptions, the absolute values of skewness and kurtosis were lower than 1.0. This indicates that the distribution of the studied traits is close to normal, and GSC, GPC and GFAC belong to the quantitative traits controlled by multiple loci (Figure 1). The highest broad-sense heritability reaching almost 80% were obtained for GPC, while for GSC we found 70% and 45% in panels of wheat lines analyzed in 2022 and 2023, respectively. A strong negative correlation between GSC and GPC (−0.778, p < 0.001) indicates, that both processes of proteins and starch accumulation during wheat grain maturation are linked, and selection for low GSC will result in an increase of GPC. A weak positive correlation (0.277, p < 0.001) was observed for the GPC-GFAC pair.
3.2. Genotype Variation
A total of 19,483 and 61,317 DArTseq markers were used for association analyses in 2022 and 2023, respectively. Some of these markers had an ambiguous position on the reference genome (IWGSC v.2.1), while other markers were mapped (Figure S1). The distribution of DArTseq markers on wheat chromosomes which is not random, and a distal fragment are apparently better saturated.
The coverage of the wheat genome with markers in 2023 was more than 3 times higher than in 2022 (Figure S1). Although DArTseq markers covered the entire wheat genome in both years, only 13,607 markers were common in both years of analysis and panels of common wheat lines (Figure S2).
3.3. Population Structure
Subsets of 2,097 and 2,782 of DArTseq markers were used for the population structure analysis of common wheat panels analyzed in 2022 and 2023, respectively. To avoid overrepresentation of genetic diversity deposited in distal regions of chromosomes, markers with the lowest number of missing data were selected from 5Mbp linkage blocks. Different genetic structure of elite breeding lines was found in subsequent years (Figure 2). In 2022 year, 170 lines were divided into four subpopulations represented by 86, 34, 32 and 18 lines. The panel of lines surveyed in 2023 consisted of two subpopulations represented by 111 and 63 lines (Table S1).
3.4. GWAS Results
In total, 12 chromosomal regions associated with changes in protein content were found in the studied breeding lines using the GLM model (Figure 3). No major genes affecting GPC were identified and the markers explained from 6.8% to 10.2% of total variation (Table 2 and Table S2). The marker-trait association (MTA) effect of QGpc.rut.2D was stable for both panels of lines tested. Most MTAs were significantly associated with protein content only in the selected environments.
Genome-wide association studies for GSC revealed 40 MTAs (Table S3, Figure 3 and Figure S3) clustered in 35 QTLs, with DArTseq markers showing minor allele frequency (MAF) above 0.05. QGsc.rut.3D.4 was common for both panels of advanced breeding lines. Three models (GLM, MLM, and CMLM) produced consistent results for 16 MTAs (Table 3) identified for GSC measured in 2023 year. Selected markers explained from 6.8% to 12.2% (QGsc.rut.7A.4) of variation (Table S3).
In total, 43 markers associated with free asparagine content were identified on 15 chromosomes using the GLM model in 2022 (Figure 3, Table 4 and Table S4). These markers explained from 6.3% to 11.9% of the variation (QGfac.rut.1B.1). Distribution of MTAs was not random, and 6 markers have been located in the first homoeologous group on 1B in the fragment of 470–495 Mbp and on 1D in area of 368–423 Mbp. Similarly, the distribution of MTAs between chromosomes 2B and 2D was in the corresponding regions of 31 Mbp and 35 Mbp and 517 Mbp and 497 Mbp, respectively. Further, 3 MTAs have been located in the beginning of chromosomes belonging to the third 3 group. Two clusters of markers were also found. The first comprised 5 markers mapped in the 245–375 Mbp on chromosome 6B. The second group included 8 MTAs located on the long arm of chromosome 7A (Table 4).
3.5. Candidate Genes
Most of the markers associated with the traits studied were related to selected loci on the wheat genome, and it was not possible to distinguish narrow regions of the chromosome saturated with MTAs where candidate genes are located. The search for candidate genes was limited to regions adjacent to the selected markers, which included the nearest 5 genes upstream and downstream. For GPC, region adjacent to 4990459 marker (QGpc.rut.2D) which explained 10.2% of the variation and was stable between years was characterized, but no genes directly affecting GPC were identified (Table S5). For GSC, two markers 1280335 and 980786 from the region of QGsc.rut.7A.2, has been selected. These markers in spite of low frequency, overlapped with existing MTA (1127783). Sucrose synthase gene (TraesCS7A03G0375000) was identified in the region of QGsc.rut.7A.2 which is involved in the sucrose metabolism process. Finally, three MTAs with the GFAC were selected 4989859 (QGfac.rut.1B.1), 1081766 (QGfac.rut.3B.2), and 3953081 (QGfac.rut.7A.6), explaining 11.9%, 10.1%, and 11.2% of variation in GFAC, respectively. NAD(P)H dehydrogenase subunit H was identified near the region of QGfac.rut.1B.1 and can be indirectly related with nitrogen metabolism.
4. Discussion
The resulting locations of the 14 MTAs were compared with markers identified to date for GPC (Table S6). The cluster of 4 markers located in the 0.9–18.2 Mbp region on chromosome 2A (IWGSC v1.0) is a new region that does not overlap with previously described markers from this chromosome (located in the terminal region of the chromosome). Similarly, new GPC-related regions have been identified by the markers QGpc.rut.5B.1 (331 Mbp, v1.0), QGpc.rut.5B.2 (357 Mbp, v1.0), QGpc.rut.6A (4.7 Mbp, v1.0), 7B (66 Mbp, v1.0), and QGpc.rut.2D. The remaining markers QGpc.rut.3A, QGpc.rut.3B, QGpc.rut.5B.4 and QGpc.rut.5B.3 are located within a 50 Mbp window relative to the previously described markers (Table S6).
Most of the markers associated with GSC identified within this study have not been described before. New MTAs for GSC were found on chromosomes 1B, 2D, 3D, 5A, 5B, 7A and 7B. Markers QGsc.rut.4A.1 and QGsc.rut.4A.2 were located in the previously reported regions [17]. The locations of the other GSC-associated MTAs also do not match with the markers reported in the literature. Markers associated with variation in asparagine content in grains identified on chromosomes 2D (QGfac.rut.2D.1) and 7B (QGfac.rut.7B.9) were located on 13.7 Mbp and 0.4 Mbp, respectively, away from previously described markers [42]. Four markers (QGfac.rut.4A, QGfac.rut.7A.1, QGfac.rut.7D.1, and QGfac.rut.7D.2) were found within the 50 Mbp window in respect to the already reported regions (Table S6) [42,43].
The genes indirectly related to protein biosynthesis in wheat grain have been identified on chromosome 2D (Table S6). They encode enzymes which are involved in the plant’s response to the stress factor. Xyloglucan endotransglucosylases/hydrolases (XTH) are the key enzymes involved in cell wall remodeling, a process that includes relaxation and structural changes essential for the plant’s adaptation to stress [57]. The defense mechanisms may disturb the metabolic balance, including protein synthesis. The panel of diseases tolerance related genes in this region includes disease resistance protein RPM1 [58], NB-ARC domain-containing protein, disease resistance N-terminal domain-containing protein [59], and cytochrome P450 which modulates plant defense against Fusarium head blight [60]. Some of the enzymes in the P450 family also affect seed development and size [61].
For GSCs, the protein directly involved in the starch biosynthetic pathway is sucrose synthase (SuS). This enzyme catalyses the reaction to convert sucrose into UDP-glucose and fructose [62], then UDP-glucose is converted to G1P [15]. The highest activity of this enzyme occurs at the time of increased starch synthesis and is mainly related to the endosperm development in Triticum aestivum [62]. The gene TraesCS7A03G0375000 (IWGSC v2.1) corresponds to TraesCS7A02G158900 (IWGSC v1.0) is located in the region of QGsc.rut.7A.2 set by markers 1280335 and 980786. This gene shows the highest level of expression in the root (>150 TPM), with slightly lower levels in the stem, spike and grain (Figure 4 and Figure S4). The lowest expression values are observed in the leaves (<50 TPM) [63]. In grain, the highest expression activity occurs early in grain development—10DPA (Figure S5) [64]. In the embryo, expression is higher than in the endosperm up to 14 DPA. After 25 DPA, it decreases significantly. In the endosperm, it remains at a similar level (Figure S6) [65].
In the case of GFAC, gene TraesCS1B03G0736700 indirectly linked to the free asparagine content in the grain was identified on chromosome 1B. This gene coding NAD(P)H dehydrogenase is involved in the mitochondrial electron transport chain as the so-called complex I [66]. Metabolism of nitrogen is associated with this pathway as an element essential for the synthesis of amino acids and proteins [67]. Expression analysis of TraesCS1B03G0736700 (TraesCS1B02G262900 v1.1) shows that the gene is active in root, stem, leaf, spike and grain, respectively. Overall, the highest level of expression is observed in the spike (Figure 5 and Figure S7) [63]. Expression level of this gene is higher in the embryo (>1 TPM) than in the endosperm (<0.25 TPM) and remains at similar levels between 14 and 25 DPA (Figures S8 and S9) [65].
5. Conclusions
Association studies revealed 14 MTAs for GPC, 40 for GSC and 43 for GFAC, respectively. Polyploid nature of wheat and presence of homoeologous chromosomes introduce some level of uncertainty into physical mapping of markers to reference genome. However, beside several markers with overlapping position mainly new markers have been identified. In elite wheat breeding lines, main genes affecting important agronomically traits were possibly already fixed. Therefore only minor loci have been found that explained from 6.3% to 12.2% of phenotypic variation. The novel gene TraesCS7A03G037500, encoding sucrose synthase involved in starch biosynthesis, was identified in the proximity of QGsc.rut.7A.2 which opens further opportunity for better understanding of starch biosynthesis and accumulation processes. The reported findings provide valuable insights for elucidating inheritance of GCS. Identified MTAs provide molecular markers for reduction of free asparagine and an increase of protein content in wheat grains.
The reference list from the paper itself. Each links out to its DOI / PubMed record.
- 1FAOSTAT Available online: https://www.fao.org/faostat/en/#home(accessed on 14 April 2025)
- 2Vitale J. Adam B. Vitale P. Economics of Wheat Breeding Strategies: Focusing on Oklahoma Hard Red Winter Wheat Agronomy 20201023810.3390/agronomy 10020238 · doi ↗
- 3Abedi T. Mojiri A. Cadmium Uptake by Wheat (Triticum aestivum L.): An Overview Plants 2020950010.3390/plants 904050032295127 PMC 7238532 · doi ↗ · pubmed ↗
- 4Shewry P.R. Hey S.J. The Contribution of Wheat to Human Diet and Health Food Energy Secur.2015417820210.1002/fes 3.6427610232 PMC 4998136 · doi ↗ · pubmed ↗
- 5ŠramkováZ. GregováE. Šturdík E. Chemical Composition and Nutritional Quality of Wheat Grain Acta Chim. Slovaca 20092115138
- 6Khalid A. Hameed A. Tahir M.F. Wheat Quality: A Review on Chemical Composition, Nutritional Attributes, Grain Anatomy, Types, Classification, and Function of Seed Storage Proteins in Bread Making Quality Front. Nutr.202310105319610.3389/fnut.2023.105319636908903 PMC 9998918 · doi ↗ · pubmed ↗
- 7Shewry P.R. Van Schaik F. Ravel C. Charmet G. Rakszegi M. Bedo Z. Ward J.L. Genotype and Environment Effects on the Contents of Vitamins B 1, B 2, B 3, and B 6 in Wheat Grain J. Agric. Food Chem.201159105641057110.1021/jf 202762 b 21863876 · doi ↗ · pubmed ↗
- 8Wieser H. Koehler P. Scherf K.A. The Two Faces of Wheat Front. Nutr.2020751731310.3389/fnut.2020.51731333195360 PMC 7609444 · doi ↗ · pubmed ↗