Overexpression of CDCA2 in Diffuse Large B-Cell Lymphoma Promotes Cell Proliferation and Bortezomib Sensitivity
Hanne Due, Asta Brogaard, Issa Ismail Issa, Maja Zimmer Jakobsen, Cathrine Sylvester, Anne Krogh Nøhr, Louiza Bohn Thomsen, Martin Kristian Thomsen, Rasmus Froberg Brøndum, Karen Dybkær

TL;DR
This study shows that high CDCA2 expression in DLBCL patients improves survival with bortezomib treatment and that CDCA2 influences bortezomib sensitivity in lymphoma cells.
Contribution
The study identifies CDCA2 as a novel marker linked to bortezomib response in DLBCL and demonstrates its functional role in drug sensitivity.
Findings
High CDCA2 expression in DLBCL patients correlates with better survival when treated with RB-CHOP.
CDCA2 knockout reduces DLBCL cell proliferation and bortezomib sensitivity in vitro and in vivo.
CDCA2 is overexpressed in DLBCL compared to non-malignant tissue and in specific subtypes like GCB and double-expressor patients.
Abstract
Numerous clinical trials have attempted to improve first-line R-CHOP treatment of diffuse large B-cell lymphoma (DLBCL) through the addition or substitution of drugs. The REMoDL-B trial, testing the addition of bortezomib (RB-CHOP), revealed that ABC and molecular high-grade DLBCL patients benefit from bortezomib. The aim of this study was to achieve a better understanding of the bortezomib response in DLBCL through a functional investigation of clinically identified markers. A retrospective analysis of transcriptional and clinical data from the REMoDL-B trial was conducted to identify genes associated with bortezomib response, identifying CDCA2. DLBCL patients with high expression of CDCA2 had a superior survival outcome when treated with RB-CHOP in comparison to R-CHOP, whereas no difference in outcome was observed for patients with low CDCA2. Moreover, CDCA2 was found to be…
Genes, proteins, chemicals, diseases, species, mutations and cell lines named across the full text — each resolved to its canonical identifier and authoritative record.
Click any figure to enlarge with its caption.
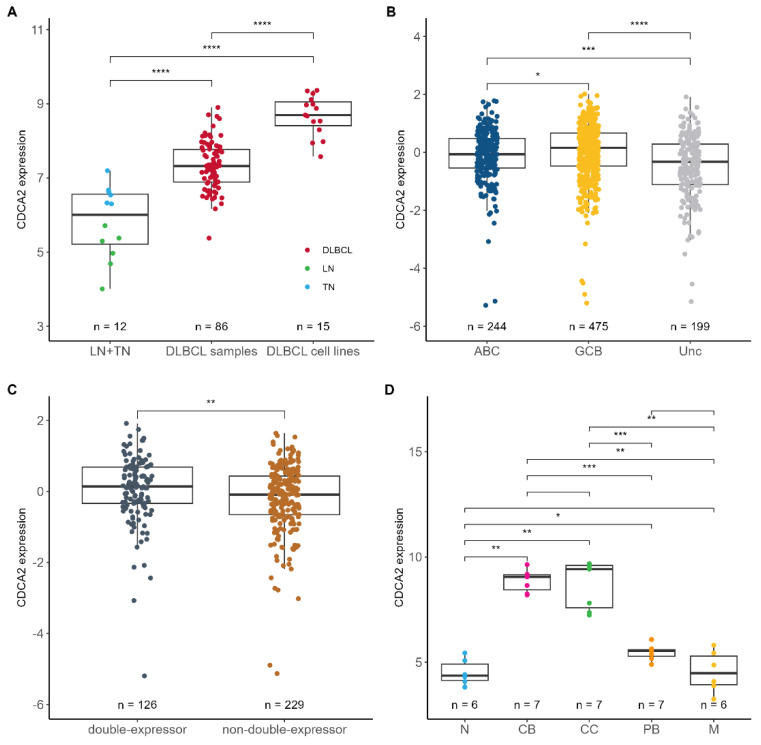 Figure 1
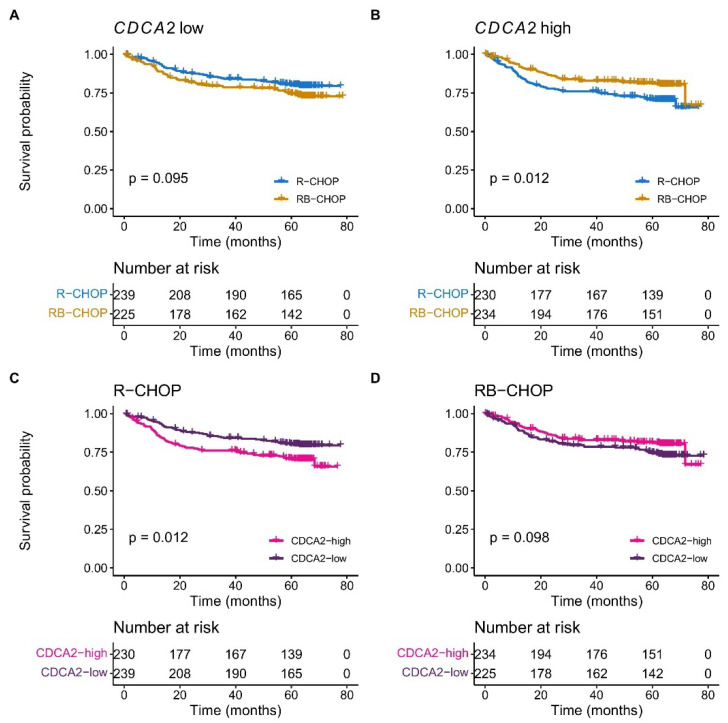 Figure 2
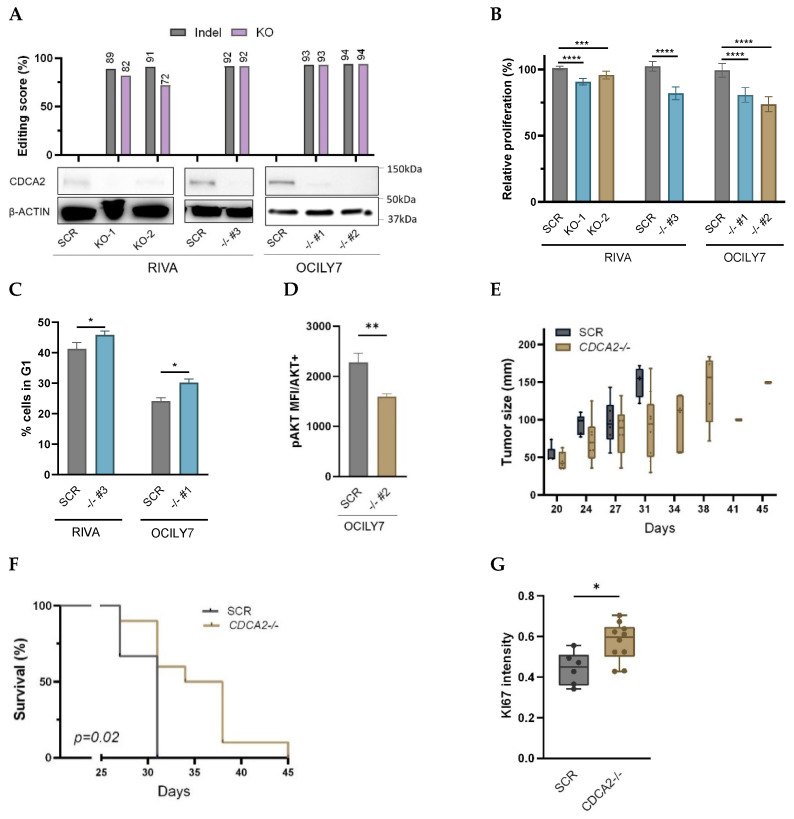 Figure 3
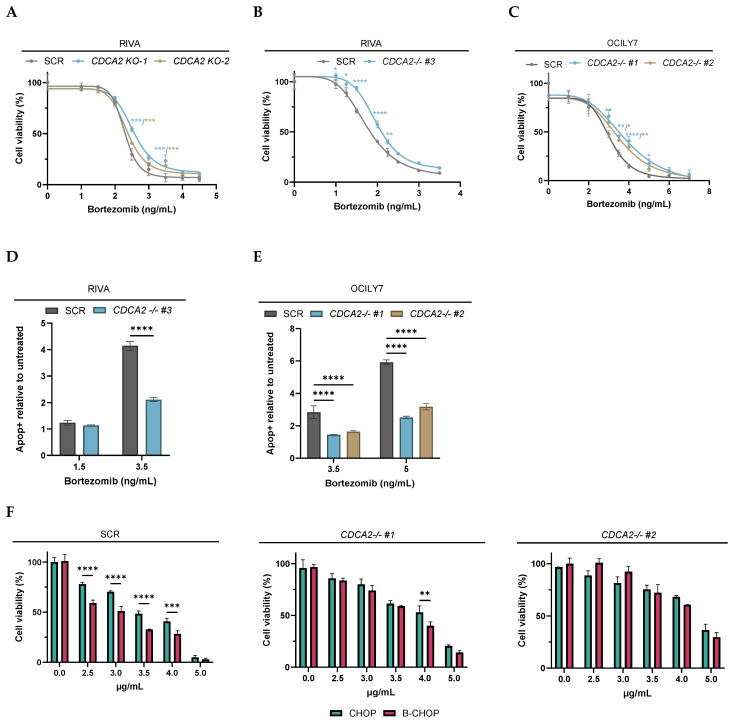 Figure 4
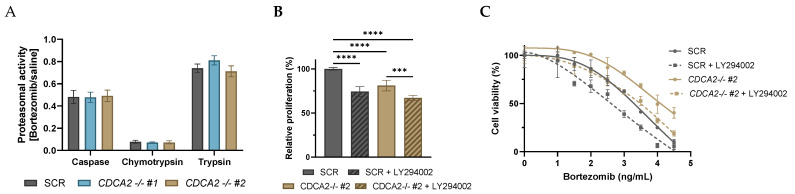 Figure 5
- —The Danish Cancer Society
- —A.P. Moeller Foundation
Peer Reviews
No public reviews on file for this paper yet. If you reviewed it on a platform where reviews are public (OpenReview, ICLR, NeurIPS, ICML), you can paste yours below so the community can read it here.
Videos
No videos yet. Explain this paper in a talk, walkthrough, or lecture? Add one.
Taxonomy
TopicsLymphoma Diagnosis and Treatment · Chronic Lymphocytic Leukemia Research · CNS Lymphoma Diagnosis and Treatment
1. Introduction
Molecular heterogeneity is characteristic of a diffuse large B-cell lymphoma (DLBCL), causing differences in clinical outcomes depending on the cytogenetic, genetic, and transcriptional profile [1,2,3,4,5]. The initial discovery of molecular heterogeneity arose from gene expression profiling (GEP) and showed that DLBCL can be divided into cell of origin subgroups, with expression profiles resembling normal germinal-center B-cells and in vitro-activated B-cells, defined as GCB- and ABC-DLBCL, respectively. These molecular subgroups display distinct pathogenesis and clinical outcomes, with inferior prognosis in ABC-DLBCL patients [1]. In addition, DLBCL can be subclassified based on translocations of MYC, BCL2, and/or BCL6, defining high-grade B-cell lymphoma, also referred to as double-hit and triple-hit lymphoma [6]. GEP-based approaches have also been applied to identify MYC-driven subgroups of DLBCL, including the double-hit signature and molecular high-grade (MHG), both of which partially overlap with double- and triple-hit lymphomas [7,8]. More recently, comprehensive investigations of the mutational landscape of DLBCL have led to the discovery of several genetic subclasses [3,4,9,10].
Although the standard treatment with R-CHOP (rituximab, cyclophosphamide, doxorubicin, vincristine, prednisone) cures up to 60% of patients, recurrent and progressive diseases constitute a significant clinical challenge, where most relapsed/refractory patients die [11,12]. Multiple clinical trials have tested the addition of novel agents targeting aberrant intracellular pathways of the malignant B-cells, most with limited effect [13,14,15,16]. The REMoDL-B trial tested R-CHOP vs. R-CHOP + bortezomib (RB-CHOP) in newly diagnosed DLBCL patients stratified by cell of origin [15,16] and documented a significantly improved 5-year overall and progression-free survival for ABC- and MHG-DLBCL patients treated with bortezomib in combination with R-CHOP [16].
To achieve a better understanding of the molecular determinants of the bortezomib response we re-analyzed transcriptional and clinical data of the REMoDL-B trial and described for the first-time the aberrant expression and prognostic significance of CDCA2 in DLBCL. Through knockout of CDCA2, we showed the functional impact of CDCA2 on DLBCL cell proliferation, cell cycle progression, and response to proteasome inhibitor treatment in single and combination drug studies.
2. Results
2.1. CDCA2 Is Upregulated and Associated with Bortezomib Response in DLBCL
To identify genes displaying prognostic impact in interaction with bortezomib, the REMoDL-B data (Supplementary Table S1) was analyzed by multiple Cox proportional hazards regressions. The analysis tested all expressed genes with overall survival as the outcome and included an interaction term between gene expression and the treatment arm. Identified genes were involved in a variety of biological processes, including cell cycle, transcription, and Wnt signaling among others (Supplementary Table S2). One of the strongest interactions to bortezomib response was found in CDCA2, which displayed a different effect on the outcome in the R-CHOP and RB-CHOP treatment arm (p = 0.08). Cell Division Cycle Associated 2 (CDCA2) is a cell cycle related protein, which has been documented to be upregulated in other types of cancer [17,18,19,20]. Therefore, CDCA2 mRNA expression was examined in non-malignant and DLBCL samples, which showed higher levels of CDCA2 in DLBCL compared to normal tissue specimens (p ≤ 0.001) (Figure 1A). Consistently, the CDCA2 expression level was significantly higher in DLBCL cell lines than in normal B-cell compartments (p ≤ 0.001). CDCA2 expression was not associated with clinical factors including disease stage and international prognostic index (IPI) (Supplementary Figure S1A–D); however, GCB-DLBCL patients displayed increased CDCA2 expression in comparison to ABC and unclassified patients (p ≤ 0.05) (Figure 1B). Moreover, higher CDCA2 levels were observed in MYC/BCL2 double-expressors (p ≤ 0.01) (Figure 1C), constituting of 36% GCB subclassed patients. The difference in CDCA2 mRNA levels between ABC and GCB-DLBCL patients prompted us to examine its expression in refined B-cell subsets including normal B-cell differentiation subsets and B-cell-associated gene signature (BAGS) classification of DLBCL patients. A higher expression of CDCA2 was observed in normal centroblasts and centrocytes compared to naïve, memory, and plasmablast B-cells from healthy tonsils (p ≤ 0.01), and likewise, the BAGS-classified centrocyte and centroblast subgroups of DLBCL tumors [2] displayed higher CDCA2 levels than the other subtypes, although they were not statistically significant (Figure 1D, Supplementary Figure S1F).
A Kaplan–Meier survival analysis revealed a superior outcome in DLBCL patients with a high CDCA2 expression when treated with RB-CHOP in comparison to R-CHOP (p = 0.012), whereas no difference in survival was observed for patients with low expression of CDCA2 (p = 0.095) (Figure 2A,B). In multivariate Cox proportional hazards regression analyses, CDCA2 displayed prognostic impact independently of IPI and ABC/GCB in R-CHOP treated patients, whereas no prognostic significance was observed in RB-CHOP treated patients (Figure 2C,D, Supplementary Table S3A,B), suggesting CDCA2 as a marker of a bortezomib response. Moreover, the prognostic value of CDCA2 was independent of double-expressor status (Supplementary Table S4A,B).
2.2. Knockout of CDCA2 Suppresses DLBCL Cell Proliferation
To elucidate the biological function of CDCA2 in DLBCL, RNP and lentiviral-based CRISPR-mediated knockout (KO) of CDCA2 was performed. Indel analysis showed heterogenous indel populations with knockout scores of 72 and 82 in RNP-transfected RIVA cells and monoclonal knockouts with scores >90 in lentiviral transduced OCILY7 and RIVA cells (Figure 3A, Supplementary Figure S2A,B). Protein depletion was documented by Western blotting (Figure 3A). For verification of control, the proliferation rates of scramble control (SCR) and parental wildtype cells were compared and revealed no difference (Supplementary Figure S3A). Knockout of CDCA2 suppressed the proliferation of DLBCL cells significantly compared to SCR, with the most prominent effect observed in monoclonal knockout cells (Figure 3B). In addition, indel distribution in RNP-transfected CDCA2-KO cells changed over time with decreases in indel and knockout scores, as result of the overgrowth of cells without CDCA2 knockouts (Supplementary Figure S2C,D), supporting slower proliferation rates of CDCA2-KO cells.
Transcriptional profiling of CDCA2-KO clones and SCR was performed to explore the pathways affected upon loss of CDCA2. Gene set enrichment analysis (GSEA) indicated that CDCA2 is closely related to the G2/M checkpoint and to targets of the E2F transcription factor which play a prominent role during the G1/S transition of the cell cycle (Supplementary Figure S4). Additionally, CDCA2 is associated with the PI3K/AKT signaling pathway, which is also important for the regulation of cell cycle progression [21]. In agreement, flow cytometry analysis showed that loss of CDCA2 affected the cell cycle transition between the G1- and S-phase, resulting in a significantly increased percentage of cells in G1 compared to the control (Figure 3C, Supplementary Figure S5A). Moreover, a phospho-flow analysis showed significantly less AKT Ser473 phosphorylation in CDCA2-KO cells compared to SCR (Figure 3D, Supplementary Figure S5B), documenting the direct impact of CDCA2 on the PI3K/AKT pathway.
DLBCL xenografts were established to explore effects of CDCA2 loss in vivo. The tumor growth was significantly reduced in CDCA2-KO xenograft tumors in comparison to SCR tumors, resulting in longer survival time (Figure 3E,F). Indel analysis documented stable knockout of CDCA2 in tumors of CDCA2-KO xenografts (Supplementary Figure S6A,B). Tumors were analyzed by immunohistochemistry (IHC), and increased expression of Ki-67 was observed in CDCA2-KO tumors in comparison to SCRs (Figure 3G, Supplementary Figure S7A,B).
2.3. CDCA2 Impacts Bortezomib Response in DLBCL Cells
The findings from the analysis of REMoDL-B data prompted us to investigate the role of CDCA2 in bortezomib response in single and combination dose–response screens. No difference in response was observed between parental wildtype and SCR (Supplementary Figure S3B,C). Compared to SCR, CDCA2-KO cells demonstrated significantly less sensitivity to bortezomib over a range of concentrations with a more modest response in the polyclonal CDCA2-KO cell populations compared to the monoclonal CDCA2-KO clones (Figure 4A–C). In concordance, lower apoptotic levels were observed in CDCA2-KO cells compared to SCR upon bortezomib exposure (Figure 4D,E, Supplementary Figure S8). Moreover, CDCA2-KO cells were less sensitive to carfilzomib, a 2nd generation proteasome inhibitor (Supplementary Figure S9), showing a general effect of CDCA2 on proteasome inhibitors. Combinatory drug screens using CHOP and B-CHOP showed that SCR cells possessing physiological levels of CDCA2 were more sensitive to B-CHOP than CHOP, whereas CDCA2-KO cells displayed no difference in response to the two regimens (Figure 4F), illustrating CDCA2 to be cardinal and specifically mediating the bortezomib response.
Next, we set out to decipher the mechanism through which CDCA2 impact bortezomib response. CDCA2 did not affect the proteasomal inhibiting effect of bortezomib as no difference in chymotrypsin, trypsin, and caspase activity of the proteasome was observed upon bortezomib treatment between CDCA2-KO and SCR cells (Figure 5A). This suggests alternative mechanisms by which CDCA2 modulates bortezomib response. As CDCA2 was documented to affect PI3K/AKT signaling at the transcriptional and phosphorylation levels, the impact of this pathway was examined. Applying the PI3K inhibitor, LY294002, a reduction in cell proliferation was observed in both CDCA2-KO and SCR cells; however, it was observed to a greater extent in SCR cells with a 25% reduction compared to 16% of CDCA2-KO cells (Figure 5B). Combinatory dose–response analysis of LY294002 and bortezomib revealed that inhibition of the PI3K pathway sensitizes cells to bortezomib irrespective of presence or absence of CDCA2 (Figure 5C), suggesting that CDCA2 affects the bortezomib response through mechanisms other than PI3K/AKT. The sensitizing effect of LY294002 is equal in SCR and CDCA2-KO cells, despite having a different reducing impact on cell proliferation, showing that bortezomib response through PI3K is not driven by proliferation.
3. Discussion
In this study, we demonstrate, for the first-time, the aberrant expression of CDCA2 in DLBCL samples and the functional impact of CDCA2 in DLBCL cells. Overexpression of CDCA2 has been reported in colorectal, prostate, and liver cancer, among others [17,18,19,20], and it was reported to be positively correlated to the disease stage [18,19,20]. However, CDCA2 expression did not correlate with stage or prognostic index in our data. Interestingly, higher levels of CDCA2 were observed in normal germinal-center B-cells, indicating that CDCA2 plays a role in normal B-cell development. In line, DLBCL patients of the molecular GCB cell of origin subclass displayed higher CDCA2 expression than ABC-DLBCL patients.
The prognostic impact of CDCA2 mRNA expression was documented, suggesting CDCA2 expression as indicator of bortezomib response. Further investigation of additional clinical DLBCL cohorts could provide more information on the predictive biomarker potential of CDCA2, yet the REMoDL-B trial is, to our knowledge, the only comprehensive study of bortezomib treatment in DLBCL. Moreover, as DLBCL is a highly heterogeneous disease [1,2,3,4,5] it is unlikely that a single gene can predict the response to a given treatment and therefore further assessment of the biomarker potential is out of scope for this study. Our study should thus be considered useful for improved biological understanding of bortezomib response rather than as a single gene prognostic biomarker candidate.
The REMoDL-B trial showed subclass-specific responses to bortezomib addition, where the improved outcome of ABC-DLBCL is explained by the inhibition of the constitutive NF-ΚΒ signaling observed in this subclass [22]. This mechanism is unlikely to be the explanation for the treatment efficacy observed in MHG-DLBCL, which has been suggested to be attributed to MYC-driven proteolytic stress, sensitizing cells to bortezomib [16]. We observed higher CDCA2 expression in DLBCL patients classified as MYC/BCL2 double-expressors, who display a more aggressive disease, as it is an adverse prognostic indicator [23,24]. It could be speculated that a high CDCA2 expression is surrogate for these aggressive tumors, thus the improved clinical outcome observed upon bortezomib addition was a result of more extensive treatment of this adverse prognostic subgroup. However, double-expressor status was not of prognostic significance [16].
For functional examination of CDCA2, knockouts were established to obtain the greatest phenotypic effect in DLBCL cells, which endogenously express high levels of CDCA2. CDCA2 affected DLBCL cell proliferation with a reduction upon the loss of CDCA2. In agreement with other studies [17,25,26], we found CDCA2 to be involved in G1/S phase cell cycle transition, which has been suggested to be mediated by regulation of CCND1 [17,25,26]. In DLBCL xenograft mice, loss of CDCA2 reduced the tumor growth rate, in agreement with the slower proliferation confirmed in cell culture studies [17,25,27]. A higher Ki-67 expression was observed in CDCA2-KO tumors, suggesting genetic redundancy. Correlation between CDCA2 and Ki-67 expression have been examined in various cancer types, yet reporting contradictory findings [17,18,25]. CDCA2 and Ki-67 organize the mitotic chromosome periphery in a similar manner—by recruiting protein phosphatase 1 (PP1) to chromatin during the anaphase. The regulatory mechanisms of PP1 are identical for CDCA2 and Ki-67 [28], suggesting redundancy between these two genes.
The PI3K/AKT pathway plays a key role in modulating cell proliferation by regulating CCND1 and is crucial in DLBCL pathogenesis [29]. This study shows that the loss of CDCA2 reduces pAKT and inhibition of this pathway in SCR cells reduced the proliferation levels more when compared to CDCA2-KO cells. The link between proliferation, CDCA2, and PI3K signaling has been reported in other cancer types [17,27]. Moreover, we found that, despite this pathway influencing the bortezomib response, it is not the sole mechanism through which CDCA2 exerts its action. Inhibition of the PI3K/AKT pathway has previously been shown to confer bortezomib sensitivity in DLBCL cells [30] and while this is contradictory to our observation of reduced sensitivity upon CDCA2-KO which also diminished pAKT, it can be explained by PI3K/AKT signaling being regulated by several other genes than CDCA2.
In dose–response screens, we applied the CHOP treatment alone and in combination with bortezomib and documented CDCA2 to mediate the bortezomib response. In agreement with our findings from the analysis of the REMoDL-B data showing superior clinical outcomes of high-CDCA2-expressing patients when treated with RB-CHOP, the SCR cells possessing naturally high levels of CDCA2 displayed greater sensitivity to B-CHOP than to CHOP. In parallel to the clinical observations, the cell viability of CDCA2-KO cells was equally affected by CHOP and B-CHOP treatment in accordance with the lack of difference in outcome between the two treatment arms for DLBCL patients with low CDCA2 expressions. As CDCA2 does not affect the proteasomal activity and the PI3K/AKT pathway was disproved as sole mechanisms of action, it is reasonable to believe that the impact on bortezomib response is mediated by the high involvement of CDCA2 on proliferation. Clinically, it is the ABC and MHG molecular subclasses of DLBCL which benefit from addition of bortezomib [16], and as these subclasses constitute highly proliferative and aggressive tumors it can be assumed that high proliferation increases the susceptibility to bortezomib.
In summary, our present data are the first to demonstrate overexpression of CDCA2 in DLBCL. Functional studies confirmed a direct link between CDCA2 and DLBCL cell proliferation and bortezomib response. Moreover, we found that DLBCL patients with high expression of CDCA2 displayed superior clinical outcomes upon the addition of bortezomib to the standard R-CHOP treatment.
4. Materials and Methods
4.1. Clinical Cohorts
This study includes data from the REMoDL-B trial (R-CHOP, n = 469; RB-CHOP, n = 459) (Supplementary Table S1) and local data of normal lymph nodes (n = 6) and tonsils (n = 6), sorted B-cell subsets from tonsils, and diagnostic DLBCL biopsies (n = 86). Data summary and analysis are outlined in Supplementary Methods.
4.2. CRISPR/Cas9 Knockout
An ABC- and GCB-DLBCL cell line was selected for functional studies to reflect the REMoDL-B trial (RIVA and OCILY7, respectively). Transfection and lentiviral delivery were applied for CRISPR-mediated knockout of CDCA2 as outlined in Supplementary Methods. To validate knockout, DNA was extracted (Qiagen, #69506, Hilden, Germany) and the knockout site was PCR-amplified. Amplicons were Sanger sequenced (Eurofins Genomics, Cologne, Germany) and analyzed for indels [31]. Western blot analyses were performed as previously described [32], using 20–40 µg protein.
4.3. RNA-Sequencing
RNA-sequencing of OCILY7 SCR and CDCA2 knockout (CDCA2-KO) cells were performed in technical duplicates, as previously described [33]. GSEA was performed using hallmark gene sets from the Molecular Signatures Database for the human species [34]. DESeq2 v.1.36.0 [35] was used to estimate log2 fold changes in differentially expressed genes. Subsequently, gage v.2.46.1 [36] was used to identify enriched hallmark gene sets, considering direction of effect. Gene sets with less than 15 or more than 500 genes were excluded from the analysis.
4.4. Flow Cytometry
Analysis of cell cycle and AKT/AKT phosphorylation (Ser473, pAKT) was performed on ethanol fixed samples, whereas apoptosis was analyzed in unfixed samples using flow cytometry (SONY, SH800 Cell Sorter, Tokyo, Japan). Procedures are outlined in Supplementary Methods.
4.5. MTS Assays
Proliferation and dose response screens were performed as previously described [32,37] using seeding concentration of 0.25 × 10^6^ cells/mL. Drug information outlined in Supplementary Methods. For combinatory drug studies, rituximab was omitted to minimize complexity and risk of bias, as addition of human serum is required for rituximab to exert its cytotoxic effect through the complement system.
4.6. Proteasome Activity Assay
Cells (15,000) were seeded in 50 µL media, in 96-well plates, prior to the addition of 10 µL of saline or bortezomib (3.5 ng/mL). After 5 h of exposure, 60 µL enzyme-specific reagent (Cell-Based Proteasome-Glo^TM^, Promega, Singapore) was added and luminescence was measured by the Omega Fluostar plate reader (BMG LABTECH, Ortenberg, Germany). The setup included technical triplicates in biological triplicates.
4.7. Xenograft Mice
OCILY7 CDCA2-KO or SCR cells were subcutaneously injected into flanks of SCID mice. Tumor sizes were measured every 3rd-4th day and mice were sacrificed upon humane endpoint (n_SCR_ = 6, n_CDCA2-KO_ = 10). IHC and indel analysis was performed. Extended information provided in Supplementary Methods.
4.8. Statistical Analysis
Statistical analyses of clinical data were performed with R v.4.4. Flow data was analyzed using FlowJo v. 10.10. Cell cycle phases were defined using a univariate cell cycle model with the Watson–Pragmatic statistic. Mean fluorescence intensity (MFI) was determined with a statical feature in FlowJo. Statistical analyses of in vitro and in vivo studies were performed using GraphPad v.10.0. One-way or two-way ANOVA were performed for comparison of means between samples and p-values were adjusted using Bonferroni multiple comparison testing. * p ≤ 0.05; ** p ≤ 0.01; *** p ≤ 0.001; **** p ≤ 0.0001.
The reference list from the paper itself. Each links out to its DOI / PubMed record.
- 1Alizadeh A.A. Elsen M.B. Davis R.E. Ma C.L. Lossos I.S. Rosenwald A. Boldrick J.C. Sabet H. Tran T. Yu X. Distinct types of diffuse large B-cell lymphoma identified by gene expression profiling Nature 200040350351110.1038/3500050110676951 · doi ↗ · pubmed ↗
- 2Dybkær K. Bøgsted M. Falgreen S. Bødker J.S. Kjeldsen M.K. Schmitz A. Bilgrau A.E. Xu-Monette Z.Y. Li L. Bergkvist K. Diffuse large B-cell lymphoma classification system that associates normal B-cell subset phenotypes with prognosis J. Clin. Oncol.2015331379138810.1200/JCO.2014.57.708025800755 PMC 4397280 · doi ↗ · pubmed ↗
- 3Chapuy B. Stewart C. Dunford A.J. Kim J. Kamburov A. Redd R.A. Lawrence M.S. Roemer M.G.M. Li A.J. Ziepert M. Molecular Subtypes of Diffuse Large B-cell Lymphoma are Associated with Distinct Pathogenic Mechanisms and Outcomes Nat. Med.20182467969010.1038/s 41591-018-0016-829713087 PMC 6613387 · doi ↗ · pubmed ↗
- 4Schmitz R. Wright G.W. Huang D.W. Johnson C.A. Phelan J.D. Wang J.Q. Roulland S. Kasbekar M. Young R.M. Shaffer A.L. Genetics and Pathogenesis of Diffuse Large B-Cell Lymphoma N. Engl. J. Med.20183781396140710.1056/NEJ Moa 180144529641966 PMC 6010183 · doi ↗ · pubmed ↗
- 5Morin R.D. Arthur S.E. Hodson D.J. Molecular profiling in diffuse large B-cell lymphoma: Why so many types of subtypes?Br. J. Haematol.202219681482910.1111/bjh.1781134467527 · doi ↗ · pubmed ↗
- 6Copie-Bergman C. Cuillière-Dartigues P. Baia M. Briere J. Delarue R. Canioni D. Salles G. Parrens M. Balhadj K. Fabiani B. MYC-IG rearrangements are negative predictors of survival in DLBCL patients treated with immunochemotherapy: A GELA/LYSA study Blood 20151262466247410.1182/blood-2015-05-64760226373676 · doi ↗ · pubmed ↗
- 7Sha C. Barrans S. Cucco F. Bentley M.A. Care M.A. Cummin T. Kennedy H. Thompson J.S. Uddin R. Worrillow L. Molecular high-grade B-cell lymphoma: Defining a poor-risk group that requires different approaches to therapy J. Clin. Oncol.20193720221210.1200/JCO.18.0131430523719 PMC 6338391 · doi ↗ · pubmed ↗
- 8Ennishi D. Jiang A. Boyle M. Collinge B. Grande B.M. Ben-Neriah S. Rushton C. Tang J. Thomas N. Slack G.W. Double-hit gene expression signature defines a distinct subgroup of germinal center B-cell-like diffuse large B-cell lymphoma J. Clin. Oncol.20193719020110.1200/JCO.18.0158330523716 PMC 6804880 · doi ↗ · pubmed ↗