Artificial Intelligence Approach in Machine Learning-Based Modeling and Networking of the Coronavirus Pathogenesis Pathway
Shihori Tanabe, Sabina Quader, Ryuichi Ono, Hiroyoshi Y. Tanaka, Akihisa Yamamoto, Motohiro Kojima, Edward J. Perkins, Horacio Cabral

TL;DR
This paper uses machine learning to model the coronavirus pathogenesis pathway and predict its activation states, which could help identify treatments.
Contribution
A novel AI-based prediction model for the activation states of the coronavirus pathogenesis pathway is developed.
Findings
The coronavirus pathogenesis pathway is activated in SARS-CoV-2-infected iPSC-derived cells and LUAD cells.
A prediction model was developed using Python 3.11 to predict pathway activation states.
The model may aid in identifying potential treatments for coronavirus infections.
Abstract
The coronavirus pathogenesis pathway, which consists of severe acute respiratory syndrome (SARS) coronavirus infection and signaling pathways, including the interferon pathway, the transforming growth factor beta pathway, the mitogen-activated protein kinase pathway, the apoptosis pathway, and the inflammation pathway, is activated upon coronaviral infection. An artificial intelligence approach based on machine learning was utilized to develop models with images of the coronavirus pathogenesis pathway to predict the activation states. Data on coronaviral infection held in a database were analyzed with Ingenuity Pathway Analysis (IPA), a network pathway analysis tool. Data related to SARS coronavirus 2 (SARS-CoV-2) were extracted from more than 100,000 analyses and datasets in the IPA database. A total of 27 analyses, including nine analyses of SARS-CoV-2-infected human-induced…
Genes, proteins, chemicals, diseases, species, mutations and cell lines named across the full text — each resolved to its canonical identifier and authoritative record.
Click any figure to enlarge with its caption.
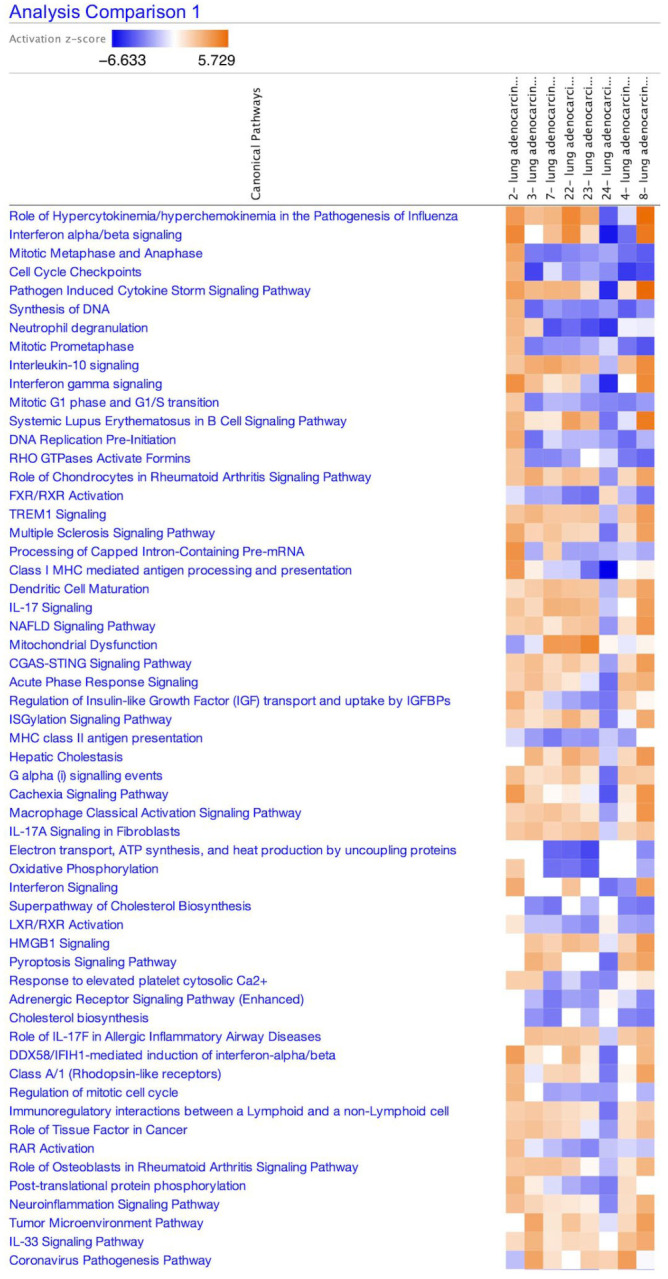 Figure 1
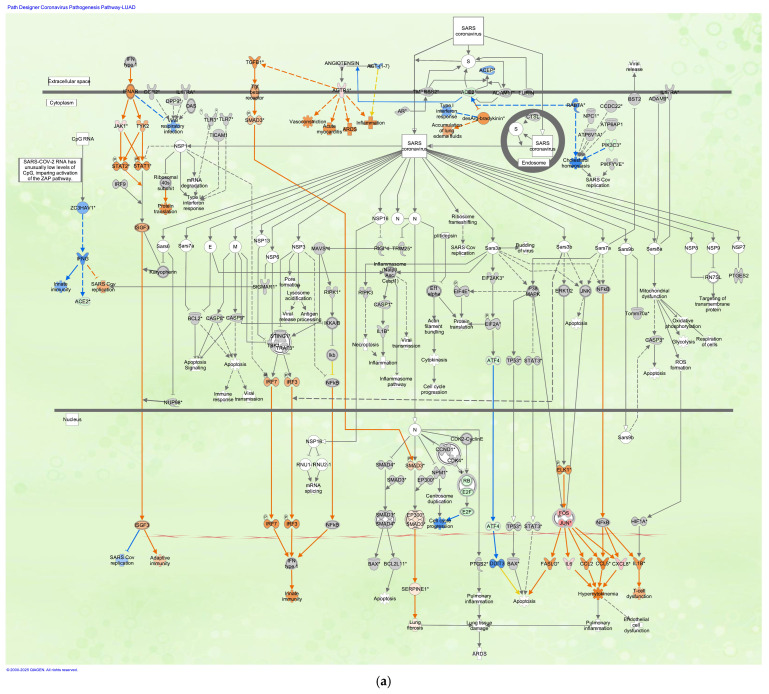 Figure 2
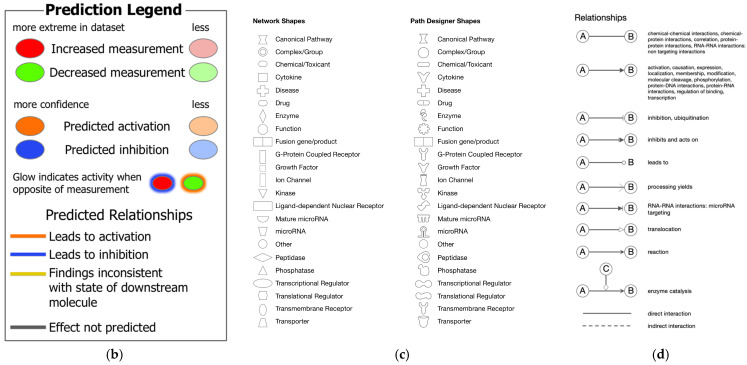 Figure 3
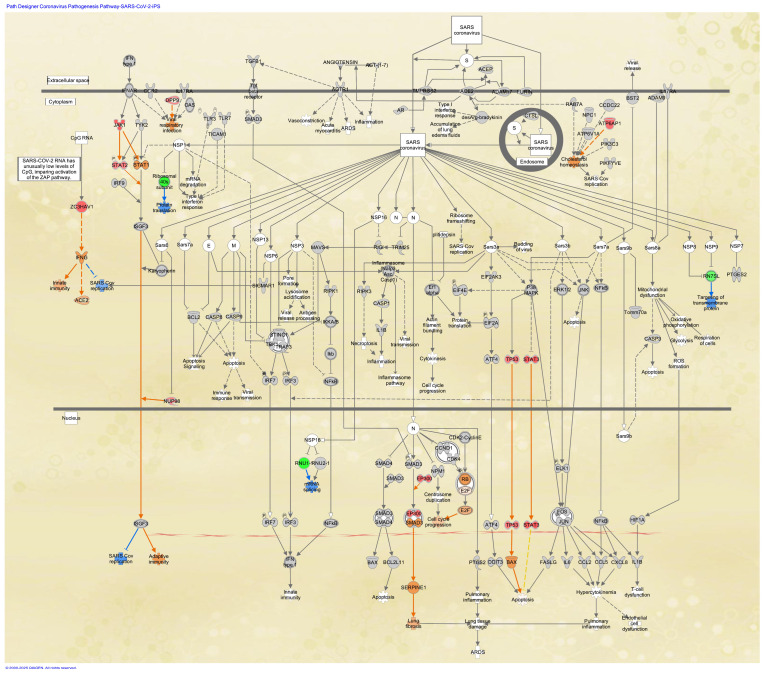 Figure 4
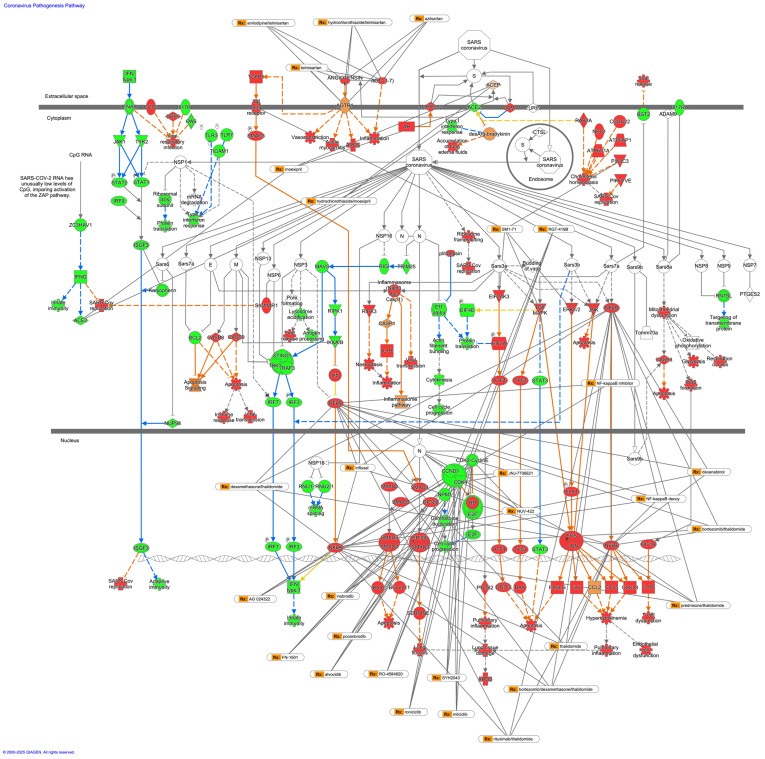 Figure 5
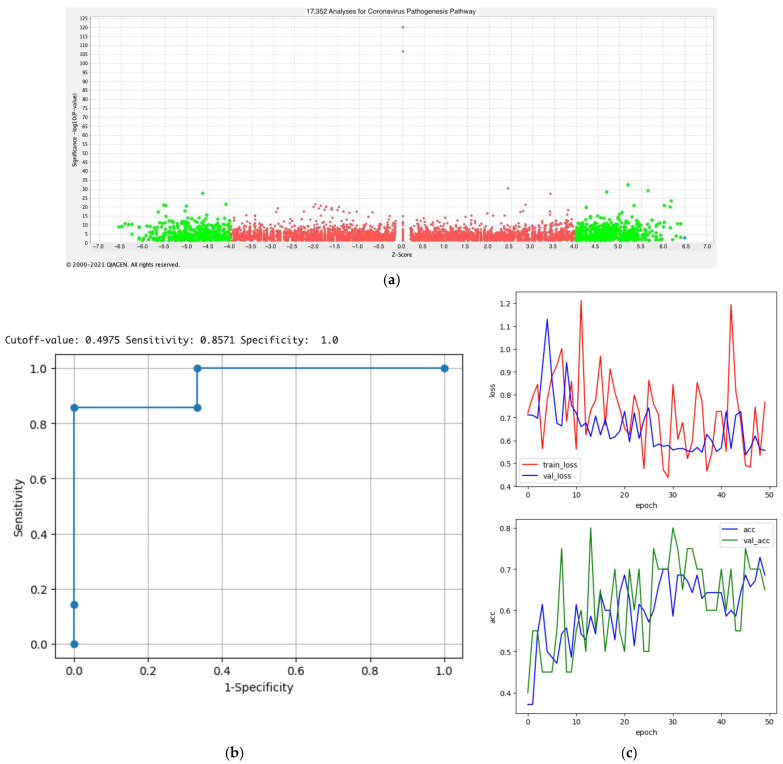 Figure 6
- —Japan Agency for Medical Research and Development
- —Japan Society for the Promotion of Science
Peer Reviews
No public reviews on file for this paper yet. If you reviewed it on a platform where reviews are public (OpenReview, ICLR, NeurIPS, ICML), you can paste yours below so the community can read it here.
Videos
No videos yet. Explain this paper in a talk, walkthrough, or lecture? Add one.
Taxonomy
TopicsCOVID-19 diagnosis using AI · SARS-CoV-2 and COVID-19 Research · COVID-19 Clinical Research Studies
1. Introduction
The COVID-19 pandemic, caused by severe acute respiratory syndrome coronavirus 2 (SARS-CoV-2), has raised challenges in discovering new therapeutic agents and understanding the molecular mechanisms of emerging diseases. The coronavirus pathogenesis pathway illustrates how SARS coronavirus infection triggers cellular reactions leading to SARS coronavirus replication, adaptive immunity, innate immunity, apoptosis, lung fibrosis, acute respiratory distress syndrome (ARDS), and endothelial cell dysfunction [1,2,3]. In the coronavirus pathogenesis pathway, several signaling pathways, such as the mitogen-activated protein kinase (MAPK) pathway, the apoptosis pathway, the unfolded protein response, and the interferon (IFN) type I pathway, are activated [3]. The coronavirus pathogenesis pathway defined with Ingenuity Pathway Analysis (IPA) includes various signaling pathways involving IFN type I, transforming growth factor (TGF) beta 1 (TGFβ1), the MAPK pathway, and nodes such as MAPK components (c-jun N-terminal kinase (JNK), extracellular signal-regulated kinase 1/2 (ERK1/2), and p38MAPK) and interleukin 1B (IL1B), angiotensin II receptor type I (AGTR1), and angiotensin-converting enzyme 2 (ACE2) [4,5,6,7,8]. Previous studies demonstrated that SARS-CoV-2 infection causes pulmonary disease and cardiovascular diseases [9,10]. Cardiac side effects of the mRNA-based vaccines for SARS-CoV-2 infection or coronavirus disease 2019 (COVID-19) have been reported and are of great concern [11,12]. Fatal adverse effects related to COVID-19 vaccines were investigated, and it was found that autopsy was very useful in defining the main characteristics of the vaccine-induced immune thrombotic thrombocytopenia after ChAdOx1 nCoV-19 vaccination [13]. Causality assessment of adverse events following immunization and COVID-19 vaccination is necessary to retrace the WHO guidelines adapted for COVID-19 [14]. A study has demonstrated that mRNA-based vaccines induce specific dysfunctions in isolated adult rat cardiomyocytes [15]. While post-COVID-19 syndrome, defined as the persistence or new onset of symptoms three months after the infection that leads to a significant daily life impairment [16], has correlated to the daily life impairment caused by somatic symptom disorder [17], the mechanism of the post-COVID-19 syndrome is unknown. A study demonstrates that post-COVID-19 lung fibrosis shares immunological characteristics with idiopathic pulmonary fibrosis and suggests that SARS-CoV-2 infection activates biological pathways common with idiopathic pulmonary fibrosis [18]. It is crucial to understand the mechanisms of the diseases and predict the activation states of disease pathways for the safer development of therapeutics or vaccines.
In this study, we developed a model to predict the activation states of the coronavirus pathogenesis pathway. We aimed to develop a model to predict changes in activation status based on gene expression in the coronavirus pathogenesis pathway using an artificial intelligence (AI) approach and machine learning. In our previous study, we found that the coronavirus pathogenesis pathway was activated in diffuse-type gastric cancer [19]. Diffuse-type gastric cancer is characterized by epithelial–mesenchymal transition (EMT), a cellular phenotypic transition associated with cancer metastasis and recurrence, for which the involvement of cell cycle regulation has been identified [20]. In this study, we also investigated the relationship between diffuse-type gastric cancer networks and SARS-CoV-2 analyses.
We previously conducted AI modeling on EMT and created a highly accurate prediction model of EMT regulation pathways using a commercially available, fully automated machine learning AI platform [21]. Considering the fact that this commercial AI platform is limited to licensed users, the current study aimed to create a prediction model of coronavirus pathogenesis pathway activation using the publicly available programming language Python, thereby facilitating data democratization.
2. Materials and Methods
2.1. Coronavirus Pathogenesis Pathway and the Activation Z-Score
The coronavirus pathogenesis pathway was analyzed using the Ingenuity Pathway Analysis (IPA) network pathway tool [19,22] (https://digitalinsights.qiagen.com/products-overview/discovery-insights-portfolio/analysis-and-visualization/qiagen-ipa/) (accessed on 16 May 2025). The activation z-score of the coronavirus pathogenesis pathway was calculated in the Ingenuity Knowledge Base [22]. Briefly, the activation z-score indicates the relation in the gene expression pattern of the molecules in the dataset and the pattern that is expected based on the available literature on the coronavirus pathogenesis pathway (https://qiagen.my.salesforce-sites.com/KnowledgeBase/KnowledgeNavigatorPage?id=kA41i000000L5nQCAS&categoryName=IPA) (accessed on 16 May 2025). The activation z-score is calculated in the IPA and defined for upstream regulator analysis as follows [22]:
where
All differentially expressed genes in a given dataset that are also present as nodes in the master network form a subset . Each gene in the dataset, D, can be either up- or downregulated, with the gene represented by the sign [22]. The causal analysis algorithms are based on a “master” network, which is derived from the Ingenuity Knowledge Base, and given by a directed multigraph , with nodes V representing mammalian genes, chemicals, protein families, complexes, microRNA species, and biological processes, and edges reflecting observed cause–effect relationships [22]. Edges are also associated with weights , reflecting the confidence in the assigned direction of the effect [22]. Further details are provided in the work of Kämer et al. [22].
A network is a graphical representation of the molecular relationships between molecules. Molecules are represented as nodes, and the biological relationship between two nodes is represented as an edge (line). All edges are supported by at least one reference from the literature, from a textbook, or from canonical information stored in the QIAGEN Knowledge Base. The intensity of the node color indicates the degree of up-(red) or down-(green) regulation. Nodes are displayed using various shapes that represent the functional class of the gene product (https://qiagen.my.salesforce-sites.com/KnowledgeBase/KnowledgeNavigatorPage?id=kA41i000000L5pXCAS&categoryName=IPA) (accessed on 16 May 2025).
2.2. Network Analysis
As of 2021, 106 analyses and 106 datasets from more than 100,000 pieces of data were found to be related to SARS-CoV in the IPA database. We filtered the 106 analyses associated with “SARS coronavirus 2” with the term “human,” with a total of 49 analyses being identified. The 49 analyses consisted of 22 analyses of lung adenocarcinoma (LUAD) and 27 analyses of non-LUAD data. The gene expression data of the analyses are publicly available in Gene Expression Omnibus (GEO) as GEO Series (GSE) (https://www.ncbi.nlm.nih.gov/geo/) (accessed on 16 May 2025). The data from the 22 analyses of LUAD included 13 analyses of LUAD infected with SARS-CoV-2 of the amlodipine series (GSE154613) [23], one analysis of LUAD bronchial epithelial Calu-3 cells infected with SARS-CoV Urbani strain (GSE17400) [24], and eight analyses of LUAD cells infected with SARS-CoV-2 (GSE147507) (ACE2-transfected A549 cells) [25,26]. We analyzed eight analyses of GSE147507 [25,26] and the data on LUAD bronchial epithelial cells infected with SARS-CoV (GSE17400) [24]. The 27 analyses of non-LUAD data included nine analyses of induced pluripotent stem cell (iPSC)-derived cardiac cells (GSE156754) [9,27].
2.3. Analysis Match
SARS-CoV-2 analyses data and diffuse-type gastric cancer data were compared using the Analysis Match function in the IPA database (https://qiagen.my.salesforce-sites.com/KnowledgeBase/KnowledgeNavigatorPage?id=kA41i000000L5vUCAS&categoryName=IPA) (accessed on 16 May 2025). Our previous finding showed a certain degree of correlation between diffuse-type gastric cancer data and the virus infection pathway [28]. The Analysis Match function identified the entities related to diffuse-type gastric cancer and SARS-CoV-2 datasets. The entities of the Analysis Math included upstream regulators (URs), master regulators in causal networks (CNs), and diseases and functions in downstream effects (DEs).
2.4. Activity Plot Analysis
The activity plot of the activation z-score of the coronavirus pathogenesis pathway in the IPA database identified more than 10,000 analyses as of 2021, of which 100 (50 activated and 50 inactivated) pathway maps of the coronavirus pathogenesis pathway were obtained and used as training data for machine learning. The details of training data are described in Section 2.5, Python Coding.
2.5. Python Coding
We created a model to predict the activation state using Python (GitHub: https://github.com/Shihori/AI/blob/68bbeaf7944ff8d1c3bbcb40fbf011c853cf4383/CNN_corona2_GitHub.ipynb) (accessed on 16 May 2025). The Python code was created with reference to the textbook “Machine Learning in Python: Machine Learning of Life Science Data” [29]. The Python code for convolutional neural network modeling, detailed in section six in the textbook, was used to create the prediction model of the activation states of the coronavirus pathogenesis pathway [29]. The 100 images of the coronavirus pathogenesis pathway (50 activated and 50 inactivated) obtained in the network pathway analysis with IPA were uploaded, among which 70, 20, and 10 images were used as training, validation, and test datasets in Google Colaboratory (binary classification). The model validation methodology is based on a split between training and test datasets. The Gradient-weighted Class Activation Mapping (Grad-CAM) technique was used to interpret the decision of the AI in distinguishing image activation by coloring the locus of the AI’s attention [29]. Subsequently, the model VGG16 for transfer learning was programmed in Python 3.11 (GitHub: https://github.com/Shihori/AI/blob/68bbeaf7944ff8d1c3bbcb40fbf011c853cf4383/CNN_corona2_GitHub.ipynb) (accessed on 16 May 2025) [29].
2.6. Statistical Analysis
The RNA sequencing data on diffuse-type gastric cancer were analyzed with IPA, as previously described [20]. The activation z-score in each network or pathway was calculated with IPA to show the level of activation [22].
3. Results
3.1. Molecular Network Analysis of SARS-CoV-2
The LUAD data were compared and analyzed with IPA because, as of 2011, 22 LUAD analyses related to the terms “human” and “SARS coronavirus 2” have been identified when searching with this form of analysis, and lung fibrosis was included in the coronavirus pathogenesis pathway. The data from the 22 analyses included 13 analyses of GSE154613 (amlodipine series) [23], one analysis of GSE17400 (Calu-3 cells infected with SARS-CoV Urbani strain) [24], and eight analyses of GSE147507 (ACE2-transfected A549 cells) [25]. The activation z-score of the coronavirus pathogenesis pathway in eight analyses of SARS-CoV-2-infected A549 cells in 0.2 or 2 multiplicity of infection (MOI) (GSE147507) is shown in Table 1. The heatmap of activation states of canonical pathways of the eight analyses of SARS-CoV-2-infected A549 cells (GSE147507) as of 2024 is shown in Figure 1.
3.2. Coronavirus Pathogenesis Pathway in LUAD Samples Infected with SARS-CoV
The coronavirus pathogenesis pathway was overlaid with data from the LUAD samples infected with SARS-CoV (Figure 2). The coronavirus pathogenesis pathway was overlaid with gene expression data of LUAD bronchial epithelial cell (Calu-3 cell line) samples infected with SARS-CoV Urbani strain in 0.1 MOI compared to mock-infected Calu-3 cells (GSE17400) (as of 2024).
3.3. SARS-CoV-2 Analysis Matched with Diffuse-Type Gastric Cancer
Another dataset related to SARS-CoV-2 included data from iPSCs infected with SARS-CoV-2. The findings of previous studies revealed a certain degree of correlation between a network of diffuse-type gastric cancer and RNA viral infection [19,28]. To further investigate the regulation mechanism of SARS-CoV-2-related networks and diffuse-type gastric cancer, a series of SARS-CoV-2-related analyses were compared to the analyzed gene expression data of diffuse-type gastric cancer. The five analyses related to SARS-CoV-2 (iPSC-derived cardiomyocyte infected with SARS-CoV-2 0.001 MOI vs. mock, iPSC-derived cardiomyocyte infected with SARS-CoV-2 0.01 MOI vs. mock, iPSC-derived cardiomyocyte infected with SARS-CoV-2 0.1 MOI vs. mock, iPSC-derived cardiac fibroblast infected with SARS-CoV-2 0.006 MOI vs. mock, and iPSC infected with SARS-CoV-2 0.006 MOI vs. mock) (GSE156754 https://www.ncbi.nlm.nih.gov/geo/query/acc.cgi?acc=GSE156754) (accessed on 16 May 2025) [9,27] were compared with the analysis result of gene expression data of diffuse-type gastric cancer using the Analysis Match function in IPA (as of 2022). The compared SARS-CoV-2 data comprised the RNA sequencing data of iPSCs or iPSC-derived cardiac cells infected with SARS-CoV-2 (GSE156754) in the IPA database. The upstream regulators (URs) identified in the analyses included TP53, let-7, CDKN2A, calcitriol, NUPR1, SMARCB1, MEF2D, decitabine, SPARC, and RB1 (Table 2). A similar activation z-score was observed in let-7 when the data of diffuse-type gastric cancer were compared to SARS-CoV-2 analyses in the IPA. The entity types identified included upstream regulators (URs), master regulators in causal networks (CNs), and diseases and functions in downstream effects (DEs) (Table 2).
3.4. Coronavirus Pathogenesis Pathway in Stem Cells
The coronavirus pathogenesis pathway was overlaid with the analysis of SARS-CoV-2-infected skin-derived iPSCs (GSE156754) [9,27] in the IPA database. The RNA sequencing data of iPSCs infected with 0.006 multiplicity of infection (MOI) of SARS-CoV-2 were compared to the data of iPSCs infected with mock (Figure 3). In the analysis, the expression of TP53, STAT3, JAK1, STAT2, EP300, ATP6AP1, DPP9, ZC3HAV1, and NUP98 was upregulated in iPSCs infected with SARS-CoV-2 compared to the mock infection (Figure 3).
3.5. Drugs That Interact with the Coronavirus Pathogenesis Pathway
Drugs that interact with the nodes in the coronavirus pathogenesis pathway were analyzed in the IPA network pathway analysis tool. The nodes in the coronavirus pathogenesis pathway, which are the target of drugs, are summarized in Table 3. The drugs interacting with the nodes in the coronavirus pathogenesis pathway included telmisartan, acetaminophen, and arsenic trioxide (Table 3). The drugs that have more than three target molecules are overlaid with the coronavirus pathogenesis pathway and colored by the expected activation state in Figure 4.
3.6. Prediction Modeling of the Activation States of Coronavirus Pathogenesis Pathway (Python Modeling)
In our previous study, we established AI models related to epithelial–mesenchymal transition (EMT) using the DataRobot platform [21]. We generated a model using Python coding in this study. The Python code for convolutional neural network modeling was used to create the prediction model of the activation states of the coronavirus pathogenesis pathway. The data used to formulate the prediction model included 100 images (50 activated and 50 inactivated images) of the coronavirus pathogenesis pathway (binary classification) (Figure 5a). Among the 100 images, 70, 20, and 10 were used as training, validation, and test datasets. The accuracy of the model tested with 10 datasets was 0.3 before transfer learning, which increased to 0.65 after transfer learning. The Grad-CAM technique was used to interpret the AI’s decision, distinguishing the activation of the images by coloring the locus of the AI’s attention. Subsequently, the model VGG16 for transfer learning was programmed in Python. The transfer learning model in Python was found to have an accuracy of 65.0% (Figure 5b). The code is available through GitHub: https://github.com/Shihori/AI/blob/68bbeaf7944ff8d1c3bbcb40fbf011c853cf4383/CNN_corona2_GitHub.ipynb (accessed on 16 May 2025).
The convolutional neural network model was compared to a graph neural network to demonstrate the significance of machine learning with images (https://github.com/Shihori/AI/blob/018d5cfa90265cf00c6b5cf2a66cd8a2a8009b50/GNN_corona2_GitHub_py.ipynb) (accessed on 16 May 2025). The graph neural network code was created by generative AI, Google Gemini 2.5 Flash. The accuracy of the graph neural network model was 0.4, which highlighted the significance of the transfer learning model in Python.
4. Discussion
In the coronavirus pathogenesis pathway, the TGFβ1-SMAD3 pathway leading to lung fibrosis is activated during coronavirus infection. The NFκB, FOS, and JUN pathways are activated, leading to hypercytokinemia and T-cell dysfunction. The gene expression of IL6 and CXCL8 is elevated during coronavirus infection. Interferon (IFN) type I signaling, leading to adaptive immunity, is also involved in the coronavirus pathogenesis pathway.
A model to predict the activation states of the coronavirus pathogenesis pathway using images was generated in the current study using Python. The activation state of samples analyzed with IPA differs under several different conditions. We previously created the model using a commercially available, fully automated machine learning AI platform. Although Python coding successfully predicted some of the data images, its accuracy is far from that of the commercially available, fully automated machine learning platform. Additional refinement of the model in Python is necessary in order to achieve higher accuracy. One of the factors responsible for the low accuracy of the current model may be the fact that the binary classification approach was used to train the model. A regression model involving the use of continuous values of activation z-score may improve the accuracy of the prediction model. The results of the Grad-CAM model may even aid in the identification of the specified locus of attention if the accuracy of the model is improved. Using the Grad-CAM model may be helpful for identifying the specific therapeutic targets of drugs. The activation state of a pathway is determined based on changes in signal intensity in the current study. The purpose of using “images” colored by changes in signal intensity and predicted activation state is that humans can easily interpret the pathway images with colors. The ultimate goal is to predict the activation state of a pathway based on changes in the expression of nodes in the path. The graph neural network model had lower accuracy compared to the convolutional neural network model, highlighting the significance of machine learning with images. Data augmentation by modifying the location of nodes in pathway images may also be a future investigation to enhance the accuracy of the model.
Although IPA is a widely used pathway analysis tool, the data sources and algorithms are proprietary, which may introduce potential biases in the prediction models created. Using other pathway analysis tools, such as Reactome (https://reactome.org) (accessed on 16 May 2025) or Kyoto Encyclopedia of Genes and Genomes (KEGG) (https://www.kegg.jp) (accessed on 16 May 2025), would be a future investigation [30,31]. The mechanistic validation of the predicted results is essential for the application of the AI-based machine learning model in clinical use. It would be crucial to have experimental evidence to confirm the biological validity of the novel targets of the coronavirus pathogenesis pathway.
Previous studies have suggested that the molecular network of gastric cancer and the RNA virus infection network interact [19,28]. Upstream regulators identified in the comparison of the diffuse-type gastric cancer and SARS-CoV-2 data included TP53, let-7, SMARCB1, MEF2D, decitabine, and SPARC, among which let-7 was activated in both diffuse-type gastric cancer and SARS-CoV-2, whereas TP53, SMARCB1, MEF2D, decitabine, and SPARC were activated in diffuse-type gastric cancer and inactivated in SARS-CoV-2. Decitabine is a nucleoside metabolic inhibitor approved in the United States and indicated for the treatment of adult patients with myelodysplastic syndromes that targets DNA methyltransferase (DNMT) [32,33]. The difference between the activation states of diffuse-type gastric cancer and SARS-CoV-2 may provide clues for the treatment of coronaviral diseases. The activation state of let-7 was activated in both diffuse-type gastric cancer and SARS-CoV-2. The authors of a previous study found that a small molecule, C1632, inhibits SARS-CoV-2 replication by blocking the interaction between LIN28 and pri/pre-let-7 to promote the maturation of let-7 [34]. It has been established that let-7 directly inhibits IL-6 expression [35]. IL-6 levels are significantly elevated in COVID-19 patients [36]. These insights identified in the network analyses of SARS-CoV-2 and diffuse-type gastric cancer samples may aid in treatment identification.
5. Conclusions
In conclusion, we developed a model for predicting the activation state of the coronavirus pathogenesis pathway using a Python approach [33]. The accuracy of the model with transfer learning was 65.0%. The limitation of our study is that the accuracy of the prediction model needs to be improved. The newly developed model for predicting the activation state of the coronavirus pathogenesis pathway may aid in predicting the responsiveness of drugs to treat diseases caused by new coronaviruses. In the future, it will be necessary to study the relationship between the molecular network activation state and the pathological mechanism to find therapeutic approaches for the treatment of various diseases.
The reference list from the paper itself. Each links out to its DOI / PubMed record.
- 1Quan C. Li C. Ma H. Li Y. Zhang H. Immunopathogenesis of Coronavirus-Induced Acute Respiratory Distress Syndrome (ARDS): Potential Infection-Associated Hemophagocytic Lymphohistiocytosis Clin. Microbiol. Rev.20203410112810.1128/CMR.00074-2033055229 PMC 7566897 · doi ↗ · pubmed ↗
- 2Kosyreva A. Dzhalilova D. Lokhonina A. Vishnyakova P. Fatkhudinov T. The Role of Macrophages in the Pathogenesis of SARS-Co V-2-Associated Acute Respiratory Distress Syndrome Front. Immunol.20211268287110.3389/fimmu.2021.68287134040616 PMC 8141811 · doi ↗ · pubmed ↗
- 3Fung T.S. Liu D.X. Human Coronavirus: Host-Pathogen Interaction Annu. Rev. Microbiol.20197352955710.1146/annurev-micro-020518-11575931226023 · doi ↗ · pubmed ↗
- 4Bakadia B.M. He F. Souho T. Lamboni L. Ullah M.W. Boni B.O. Ahmed A.A.Q. Mukole B.M. Yang G. Prevention and treatment of COVID-19: Focus on interferons, chloroquine/hydroxychloroquine, azithromycin, and vaccine Biomed. Pharmacother.202113311100810.1016/j.biopha.2020.11100833227708 PMC 7831445 · doi ↗ · pubmed ↗
- 5Hejenkowska E.D. Mitash N. Donovan J.E. Chandra A. Bertrand C. De Santi C. Greene C.M. Mu F. Swiatecka-Urban A. TGF-β1 Inhibition of ACE 2 Mediated by mi RNA Uncovers Novel Mechanism of SARS-Co V-2 Pathogenesis J. Innate Immun.20231562964610.1159/00053360637579743 PMC 10601633 · doi ↗ · pubmed ↗
- 6Kyriakopoulos A.M. Nigh G. Mc Cullough P.A. Seneff S. Mitogen Activated Protein Kinase (MAPK) Activation, p 53, and Autophagy Inhibition Characterize the Severe Acute Respiratory Syndrome Coronavirus 2 (SARS-Co V-2) Spike Protein Induced Neurotoxicity Cureus 202214 e 3236110.7759/cureus.3236136514706 PMC 9733976 · doi ↗ · pubmed ↗
- 7Lokau J. Garbers Y. Vicente M.M. Dittrich A. Meltendorf S. Lingel H. Münster-Kühnel A.K. Brunner-Weinzierl M. Garbers C. Long-term increase in soluble interleukin-6 receptor levels in convalescents after mild COVID-19 infection Front. Immunol.202415148874510.3389/fimmu.2024.148874539835136 PMC 11743636 · doi ↗ · pubmed ↗
- 8Monteonofrio L. Florio M.C. Al Ghatrif M. Lakatta E.G. Capogrossi M.C. Aging- and gender-related modulation of RAAS: Potential implications in COVID-19 disease Vasc. Biol.20213 R 1R 1410.1530/VB-20-001433537555 PMC 7849461 · doi ↗ · pubmed ↗