A Novel Exploration Stage Approach to Improve Crayfish Optimization Algorithm: Solution to Real-World Engineering Design Problems
Harun Gezici

TL;DR
This paper improves the Crayfish Optimization Algorithm to better solve complex engineering design problems by enhancing its exploration and exploitation balance.
Contribution
The paper introduces an improved Crayfish Optimization Algorithm with three key modifications to enhance performance in high-dimensional and real-world problems.
Findings
The ICOA outperformed 12 other algorithms on 24 of 30 CEC-2014 benchmark functions.
The ICOA achieved optimal results in cantilever beam and bearing design, as well as ROAS optimization.
The ICOA showed a significant improvement in average rank (1.70 vs. 4.13) over the original COA in benchmark tests.
Abstract
The Crayfish Optimization Algorithm (COA) has limitations that affect its optimization performance seriously. The competition stage of the COA uses a simplified mathematical model that concentrates on relations of distance between crayfish only. It is deprived of a stochastic variable and is not able to generate an applicable balance between exploration and exploitation. Such a case causes the COA to have early convergence, to perform poorly in high-dimensional problems, and to be trapped by local minima. Moreover, the low activation probability of the summer resort stage decreases the exploration ability more and slows down the speed of convergence. In order to compensate these shortcomings, this study proposes an Improved Crayfish Optimization Algorithm (ICOA) that designs the competition stage with three modifications: (1) adaptive step length mechanism inversely proportional to the…
Genes, proteins, chemicals, diseases, species, mutations and cell lines named across the full text — each resolved to its canonical identifier and authoritative record.
Click any figure to enlarge with its caption.
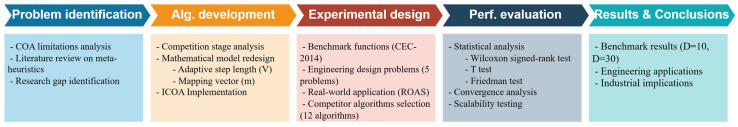 Figure 1
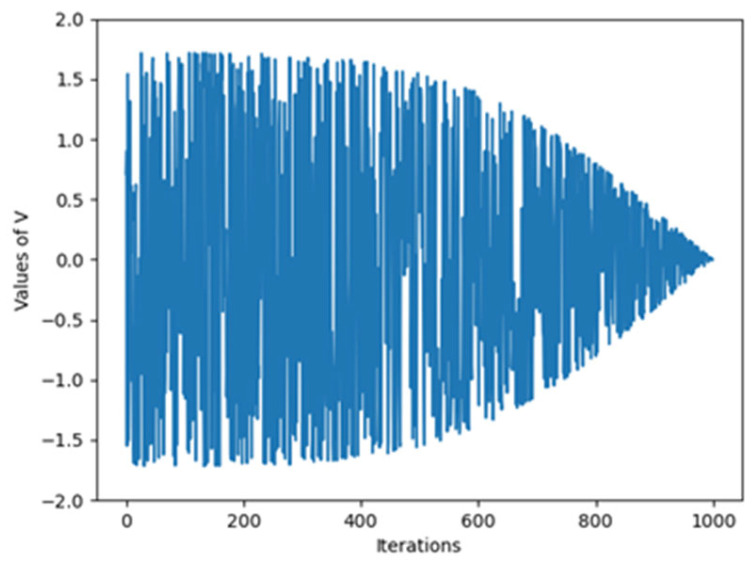 Figure 2
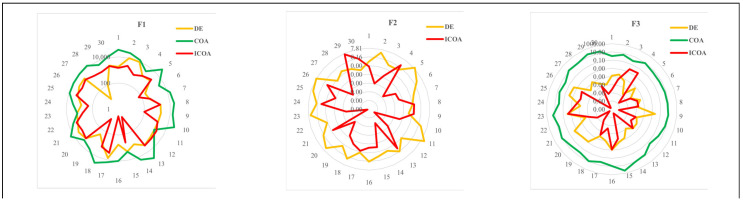 Figure 3
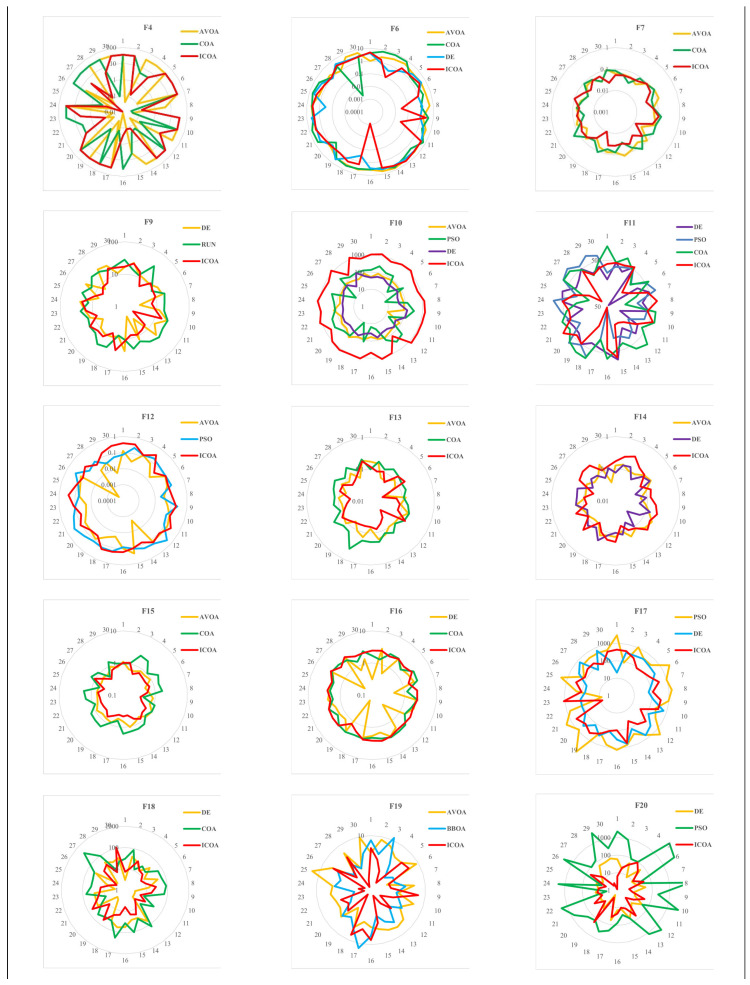 Figure 4
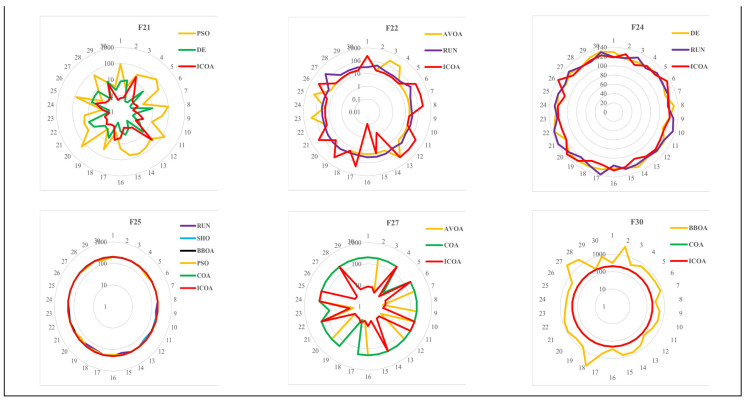 Figure 5
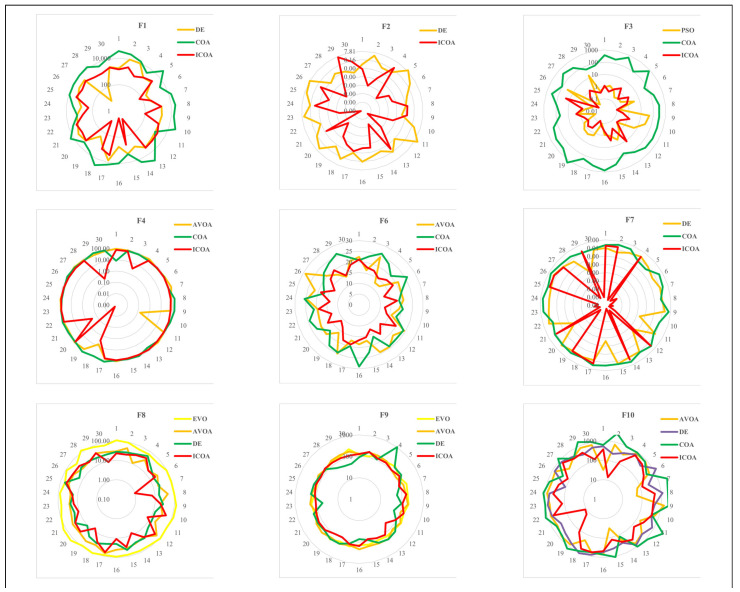 Figure 6
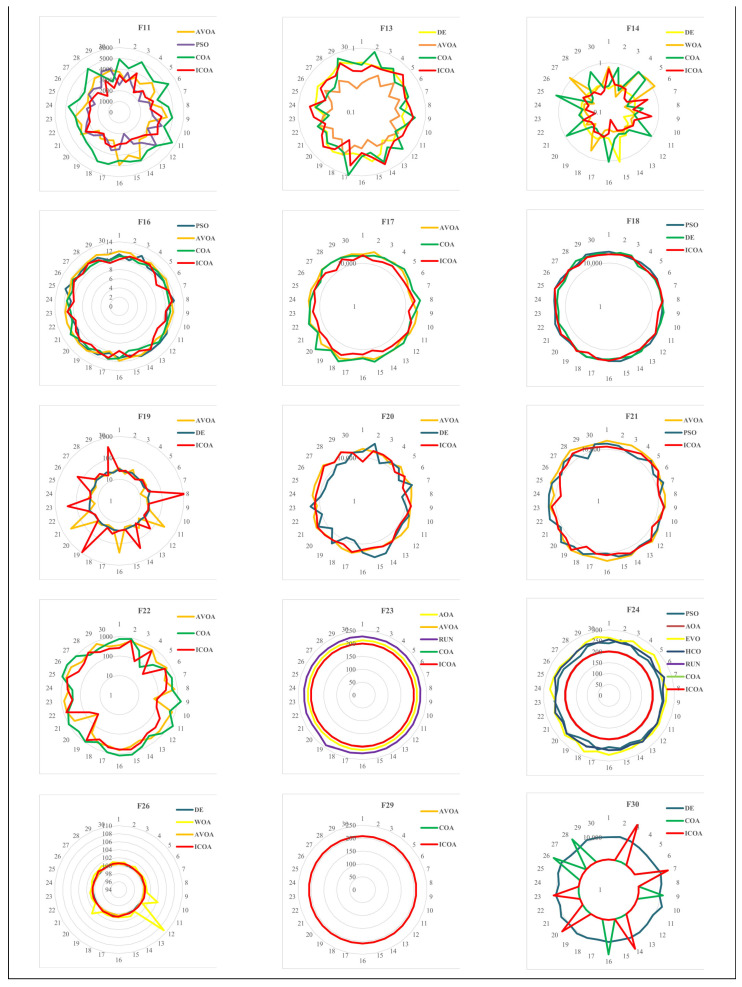 Figure 7
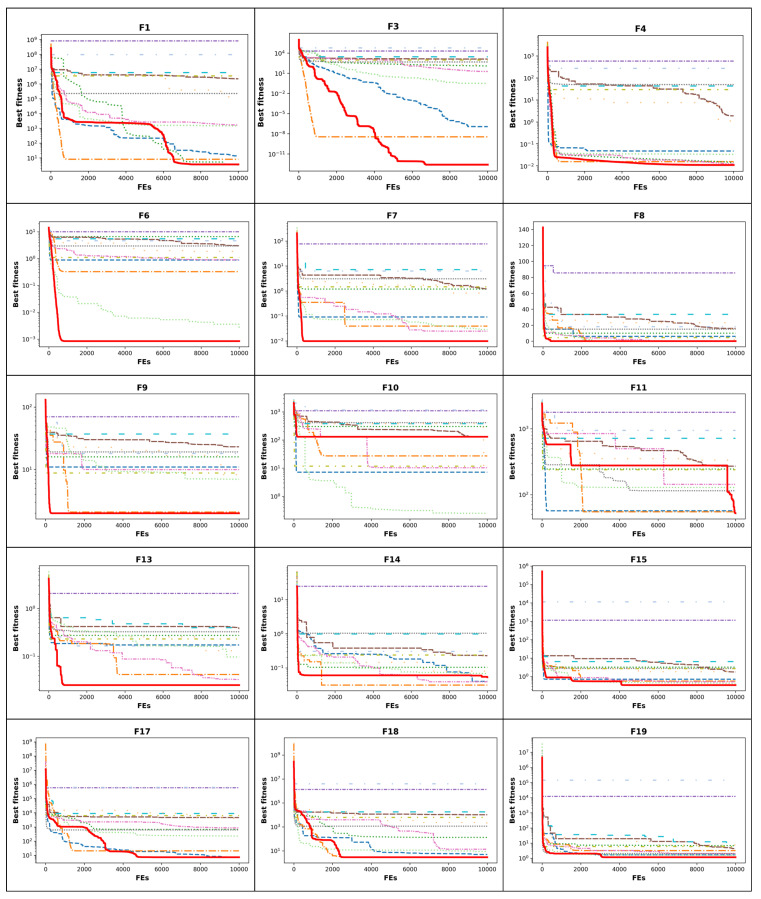 Figure 8
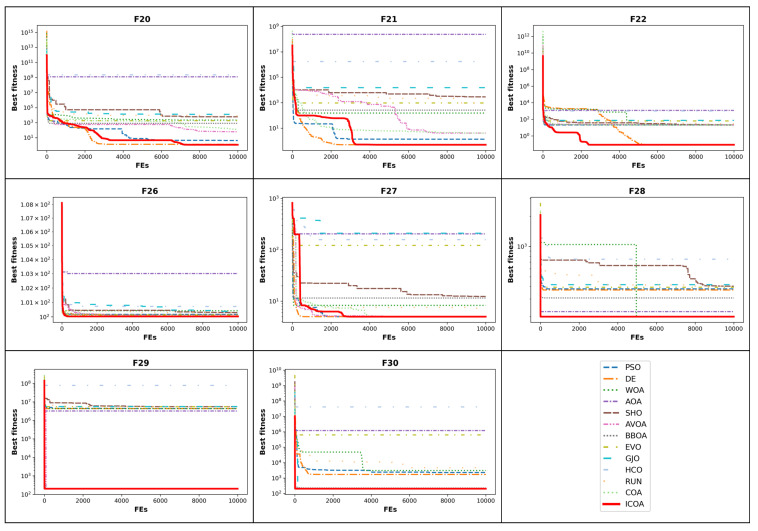 Figure 9
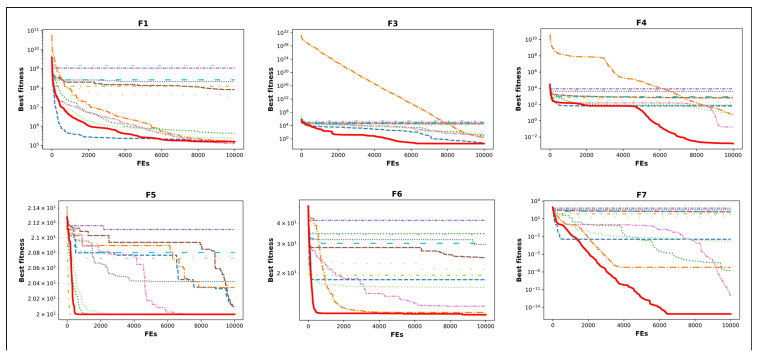 Figure 10
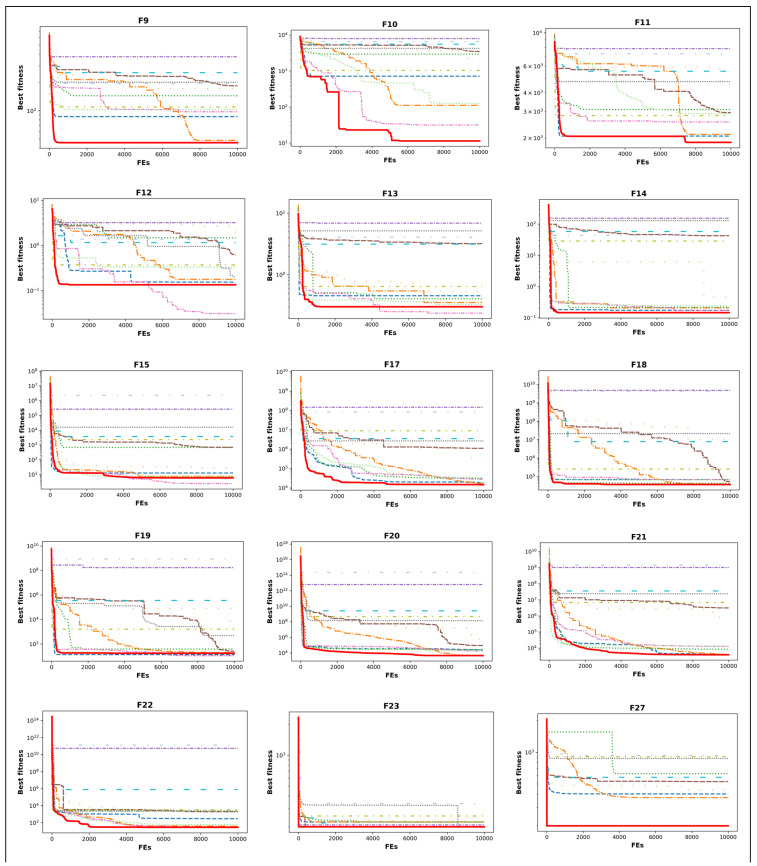 Figure 11
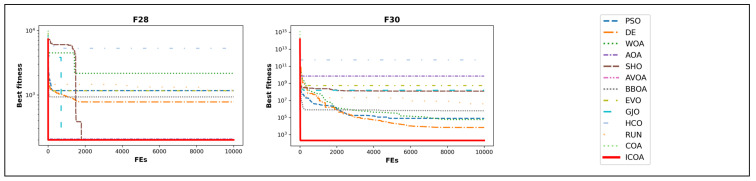 Figure 12
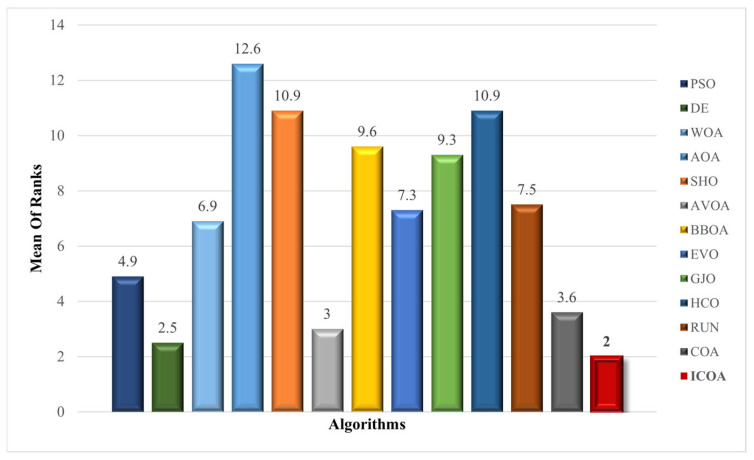 Figure 13
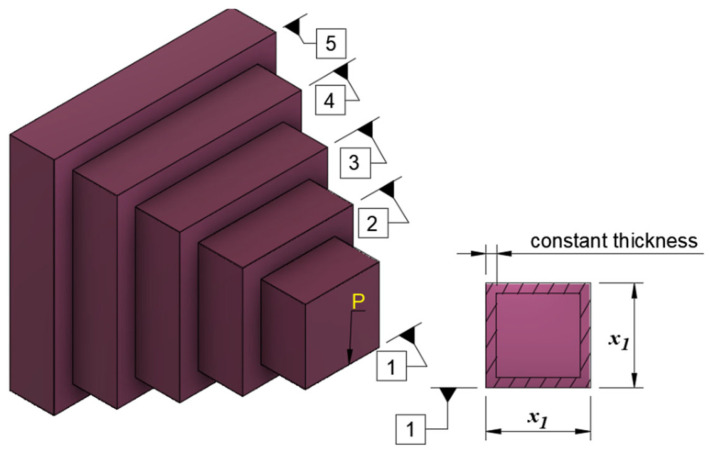 Figure 14
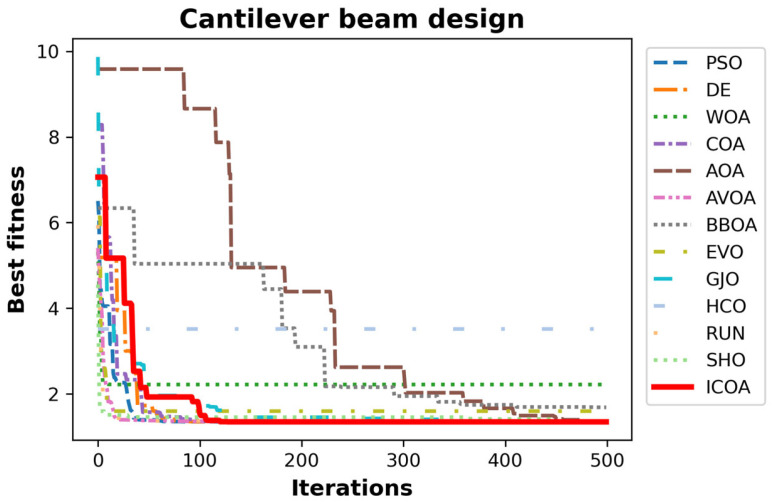 Figure 15
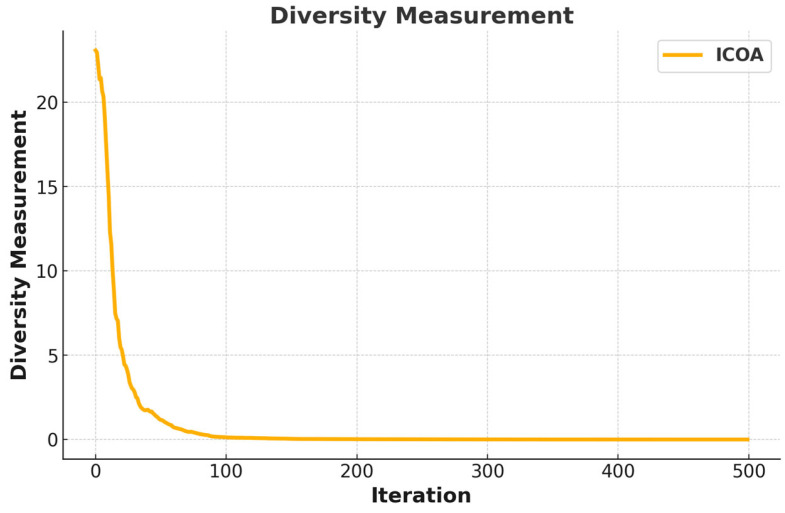 Figure 16
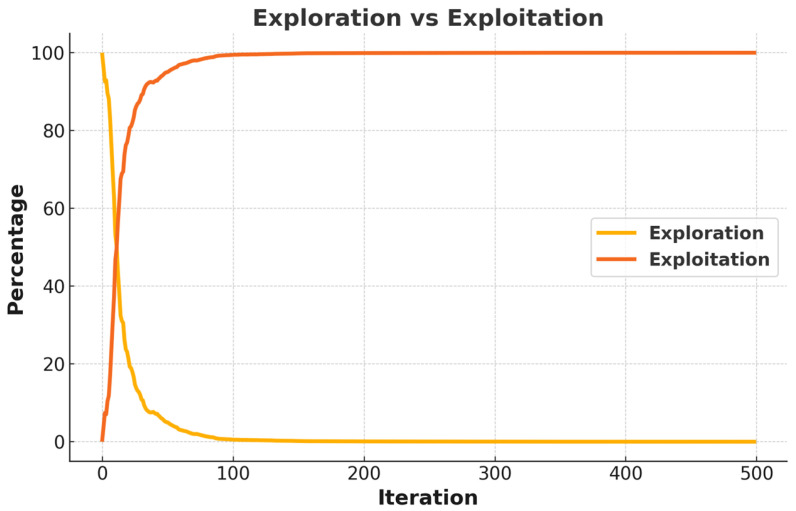 Figure 17
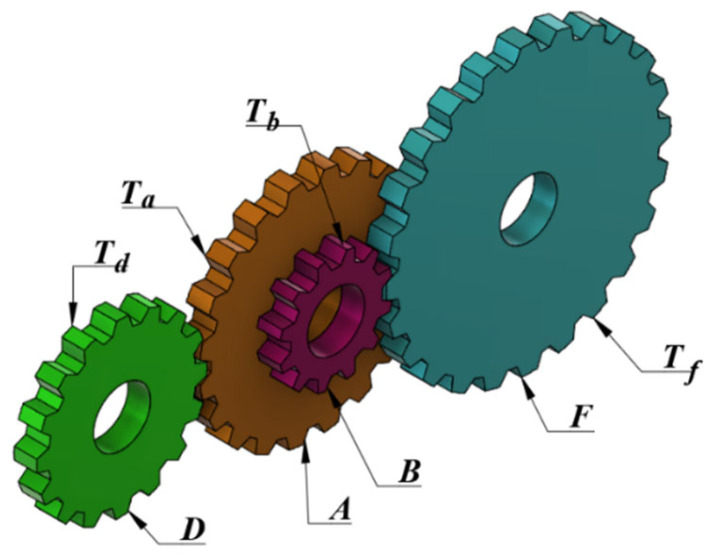 Figure 18
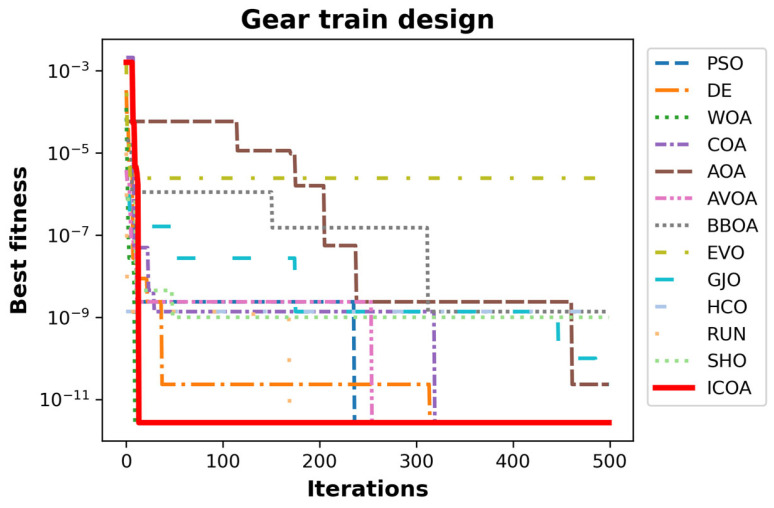 Figure 19
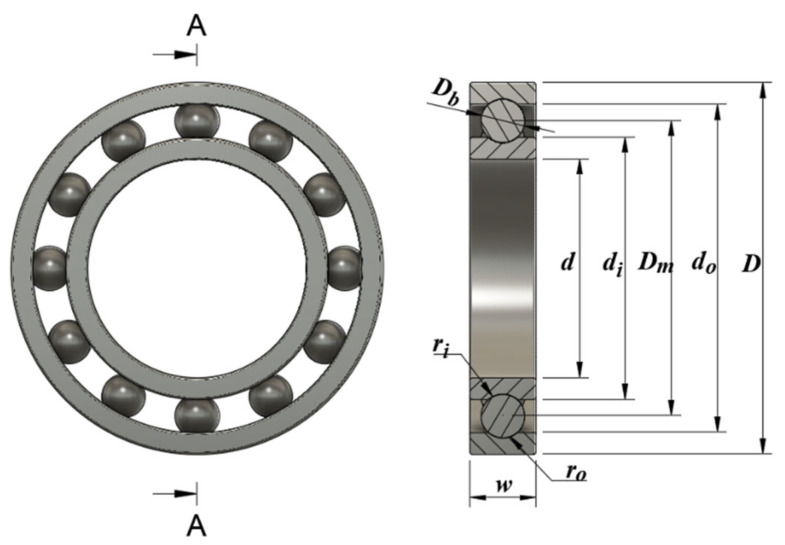 Figure 20
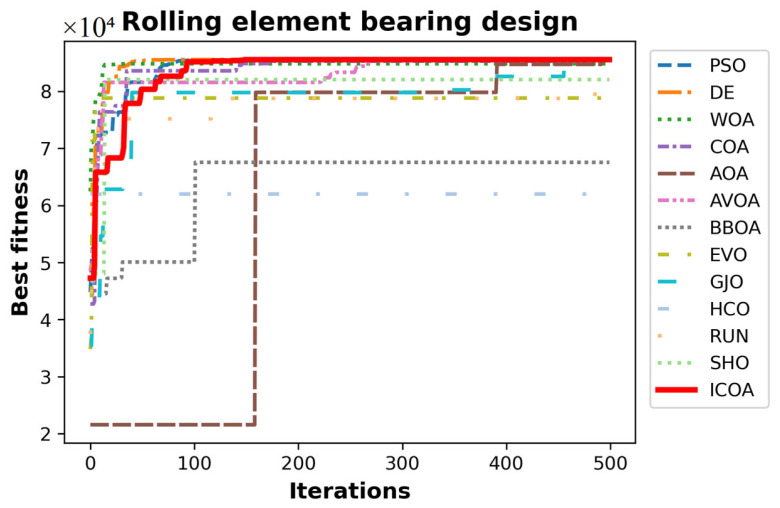 Figure 21
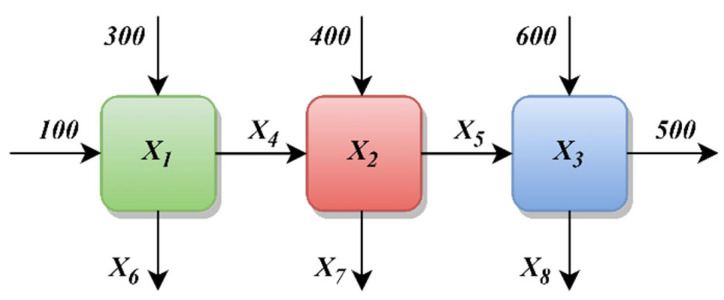 Figure 22
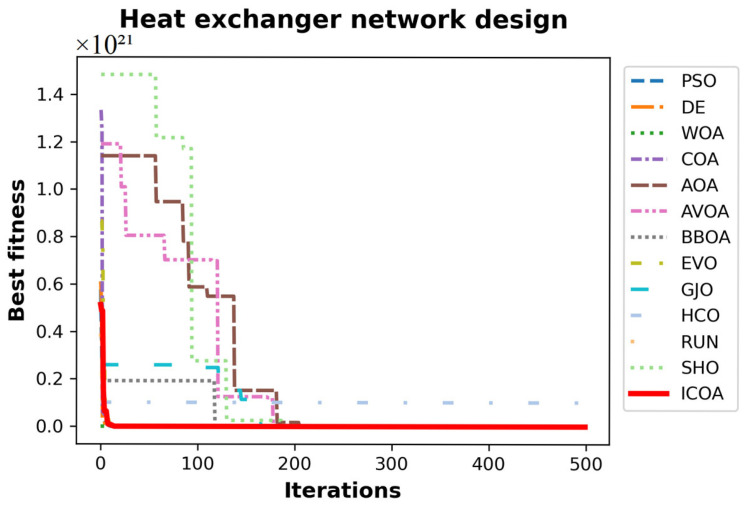 Figure 23
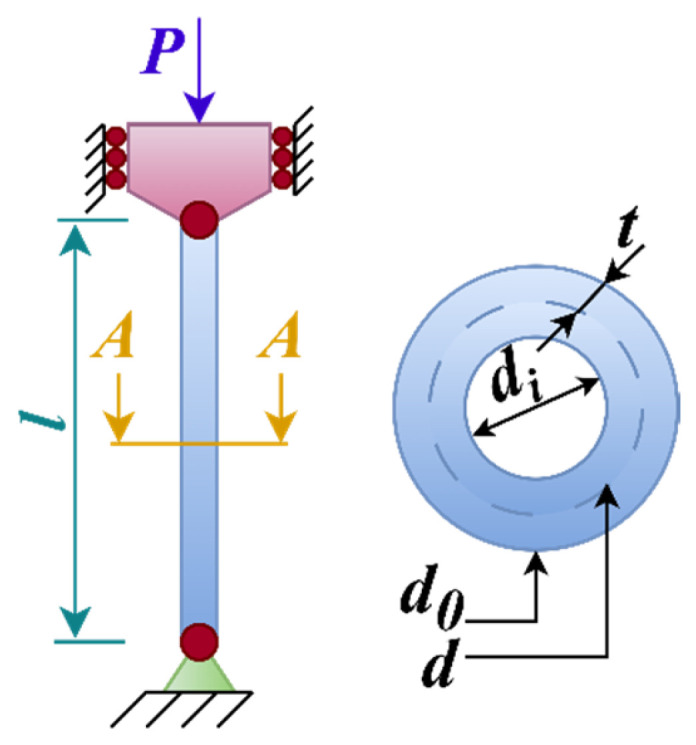 Figure 24
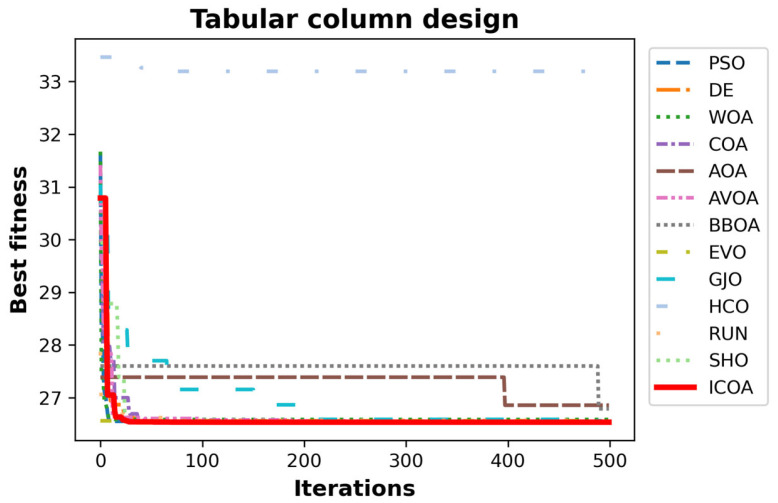 Figure 25
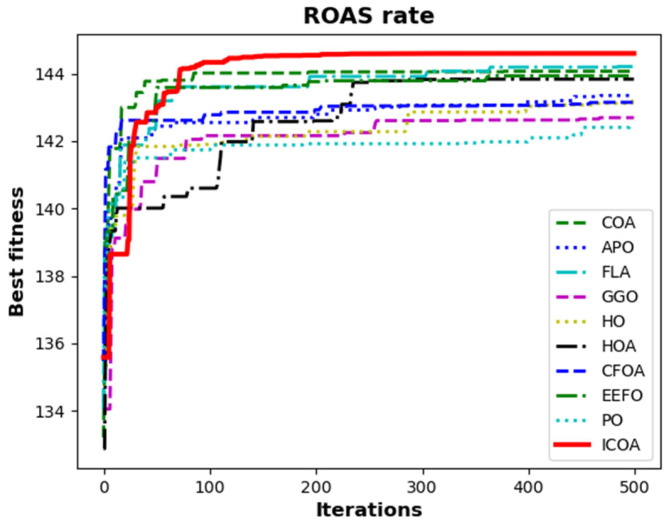 Figure 26
Peer Reviews
No public reviews on file for this paper yet. If you reviewed it on a platform where reviews are public (OpenReview, ICLR, NeurIPS, ICML), you can paste yours below so the community can read it here.
Videos
No videos yet. Explain this paper in a talk, walkthrough, or lecture? Add one.
Taxonomy
TopicsMetaheuristic Optimization Algorithms Research · Neural Networks and Reservoir Computing · Advanced Multi-Objective Optimization Algorithms
1. Introduction
Meta-heuristic algorithms (MHAs) and mathematical approaches are frequently used for solutions to optimization problems. The success of mathematical approaches depends directly on the initial fitness value and the slope of the gradient descent [1]. As the complications of global optimization problems contribute to these disadvantages, there seems to be a growing interest in algorithms developed through the inspiration of natural phenomena [2]. MHAs are defined as techniques developed in order to enable acceptable solutions for optimization problems whose solutions are difficult under the conditions of inadequate knowledge and limited calculation time. MHAs are not solution methods that are intrinsic to a problem. However, they could produce satisfactory solutions for optimization problems. MHAs could produce such solutions without scanning the whole solution space. Such ability of MHAs depends on a high level of procedures like exploration and exploitation. MHAs also provide us with the following advantages [3,4].
Global search: they could search the whole solution space effectively and discover the best fit solution for the problem.Scalability: they could be applied to high-dimensional, non-linear, and continuous or discrete problems.Diversity: since the whole solution space is scanned in global search, population diversity is generated.Adaptability: MHAs could be applied to various problems in finance, economy, engineering, medicine, etc.Computational efficiency: MHAs generate acceptable results in a reasonable time. This property of MHAs presents them as advantageous compared to exact methods for the solution of high-scaled optimization problems.Gradient descent: MHAs do not need gradient descent information. Moreover, the mathematical models of MHAs are simple.
In general, MHAs could be classified into five categories, which are (i) population-based algorithms [5], (ii) evolution-based algorithms [6], (iii) physics/chemistry-based algorithms [7], (iv) human-based algorithms [8], and (v) mathematics-based algorithms [9]. Moreover, it should be noted that there also are algorithms which are developed through the inspiration of music and are not classified above [10]. These classifications and the algorithms within these classifications are studied almost in every article concerned with MHAs. As these articles are studied, it could be observed that the categorization is frequently revisited. The MHAs given as the examples of classification are almost the same as each other, whereas many new and successful algorithms are constantly offered. This study considers that these kinds of subjects are the subject matter of typology and review articles. Therefore, at first, this study explains why MHAs are still proposed even though there are many. Then, it discusses about what to focus on while picking or improving an existing MHA.
Many meta-heuristic algorithms are proposed by researchers in the literature [11]. Some of them are more productive compared to their competitors. The improved versions of the most of them are presented as well. Nonetheless, new MHAs are still developed [12]. As a result of the rapid advancement in technology, the difficulty level of optimization problems to be solved in various industries has been increasing dramatically [13,14]. Such a case makes the development of MHAs with innovative strategies necessary [15]. Moreover, even though existing MHAs are successful in solving some kinds of optimization problems, some of them may not be successful enough to solve some other kinds [16]. This could be explained by the early convergence or slowness of the speed of convergence. In addition to these, as stated in the No Free Lunch Theorem, an MHA could not solve all optimization problems successfully [17]. Once MHAs are applied to all optimization problems, they seem to have similar performances. Thus, it could be concluded that MHAs could compete with each other in terms of a problem or set of problems.
An MHA is studied in four ways in the literature. These are (1) the original article of an MHA, (2) the application of an original MHA to an optimization problem, (3) the application of an MHA by hybridizing it with another MHA, and (4) improving the MHA by changing its mathematical model and applying it to an optimization problem.
As stated earlier, all MHAs have similar performances for all optimization problems. Therefore, while picking an MHA, in addition their results in the original article, a researcher should consider their other properties as well. Picking an MHA specific for a certain problem could increase the chance of success.
MHAs are initiated with a randomly generated population [18]. Then, the fitness value of the population is calculated. According to the strategies of MHAs, the best, top three best, or all fitness values are saved. In many population-based algorithms, there exist exploration and exploitation phases. In the exploration phase, possible solution areas of the search space are determined [19]. In the exploitation phase, the areas determined in the exploration phase are studied thoroughly [20]. In MHAs, the transition between these two phases is made through a probability key. The value of this key is determined generally in two ways; the first one is random, and the second one depends on the function. While determining the probability key randomly, a number between 0 and 1 is produced randomly [21,22]. If this number is greater than the threshold value, which is predetermined and usually 0.5, exploration is performed. However, if it is smaller than that, we follow exploitation (or vice versa). In this method, at low iteration numbers, both exploration and exploitation could be performed. The same goes for high iteration numbers as well. The disadvantage of the method is the slowness of the convergence rate. If the probability key is produced depending on the function, one parameter of the function is generally the available iteration number [4,23,24]. As the iteration number increases, the value of the probability key goes down. Here, the goal is mostly to perform exploration at low iteration numbers and to perform exploitation at high iteration numbers. The disadvantage of the method is being caught in the local minimum trap. Among these methods, it could be stated that the function-based one is, respectively, more successful. However, it should be borne in mind that we should make a choice specific for the problem. Moreover, MHAs could be applied to the relevant problem by changing the way of determining the probability key of an MHA. Lu et al. developed an innovative approach that dynamically controls the balance between exploration and exploitation and integrated it into GWO [25]. In this way, the transition between exploration and exploitation can be managed dynamically, enhancing the algorithm’s ability to adapt to changing optimization conditions.
The presence of initial parameters is an important criterion in the selection of an MHA. In recently developed MHAs, researchers try to avoid or reduce the number of these parameters as much as possible [4,26,27]. Without a doubt, this makes MHAs easier to use. It should be more plausible for inexperienced users to choose MHAs with few or without initial parameters. On the other hand, the presence of initial parameters could be an advantage to turn MHAs problem-specific. Such a case goes for the experienced users. It should be kept in mind that in such a case there needs to be an extra analysis for the adjustment of initial parameters. Developing MHAs with adjustable parameters could be focused on. Adaptive parameter tuning is critical for enhancing the effectiveness of MHAs. Recent studies have demonstrated that meta-learning methods, which become adaptive through approaches based on learning alternative minimization steps, have outstanding performance, especially in non-convex problems [28]. The effectiveness of adaptive parameters has been demonstrated not only through simulations but also experimental works that were conducted on biological search agents [29]. To overcome the challenge of parameter tuning in optimization algorithms, Wang et al. [30] developed an adaptive mechanism using reinforcement learning that automatically adjusts the distribution ratios between high-performing and low-performing individuals in the population based on accumulated rewards, eliminating the need for predefined parameters.
Recent studies have demonstrated that meta-learning methods, which become adaptive through approaches based on learning alternative minimization steps, have outstanding performance, especially in non-convex problems.
In the exploration and exploitation phases of some MHAs, there could be more than one procedure [31]. Which procedure to run is determined by a probability key. Most of the times, this probability key is determined randomly. However, this method, as stated earlier, could be changed. By changing the threshold value according to the problem, further selection of a procedure may be preferable. Because of the scholastic structure of MHAs, there exist random numbers in their mathematical models [32,33]. These random numbers are generally between 0 and 1. By changing this range or by increasing or decreasing the number of random numbers, the performance of the MHA could be analyzed. Analysis could be performed by changing the methods of determining random numbers as well. In the literature, there are many studies where random numbers are determined through chaotic maps [34,35].
In general, for MHAs, being like the best one is a significant matter for search agents. The candidate solution within the available iteration aims to be like the best individual. This method is certainly reasonable. However, it could cause problems like early convergence and being trapped by local minima. Instead of that, being like the mean of the top three, which are called alpha, beta, and gamma and are inspired by the Grey wolf optimizer [36], could avoid such problems. Other than that, simulation to the mean of all solution offers, as in Harris hawk optimization [23,37], could be a smarter way for some problems.
With the quick improvements of meta-heuristic algorithms, the performance limitations of algorithms in hand have been more obvious. In complicated engineering problems, especially, algorithms’ balance of exploration–exploitation, convergence speed, and the ability to escape from local minimum traps have been critical factors of success.
Even though the Crayfish Optimization Algorithm (COA) presents promising results in nature-inspired MHAs, it has three critical limitations in its algorithmic structure. First, the COA uses a simplified mathematical model in the competition stage. In this stage, only the Euclidian distance is paid attention to while elements necessary for effective exploration, such as adaptive step lengths, directional information, and stochastic components, are totally disregarded. Second, the heat-based transition mechanism of the algorithm generates a poor exploration–exploitation balance. Inadequate exploration capacity in early iterations and inadequate exploitation improvements in later stages cause suboptimal convergence characteristics and early convergence. Third, the algorithm’s lack of applicable mechanisms in high-dimensional problems causes it to have low performance as the problem becomes more complicated and limits its applicability to real-world engineering optimization scenarios.
These limitations, especially in high-dimensional and multi-modal optimization problems, decrease the effectiveness of the COA significantly, increase the risk of the algorithm being trapped by local minima, and slow down the convergence rate. Such a case indicates the necessity to redesign and improve the basic algorithmic components of the COA.
The subject of this work is the COA, which is a population-based MHA [38]. It is inspired by the way Crayfish search for food, avoid heat, and compete each other. The COA has a two-level search strategy made of exploration and exploitation. Even though it is a successful MHA, it faces the possibility of being trapped by local minimum traps. The literature indicates that researchers mainly concentrate on the temperature parameter, the balance between exploration and exploitation, and exploration. In a study that aims to overcome such problems, researchers determine four strategies to improve the COA [39]. These strategies are the halton sequence, opposition-based learning, elite steering factor, and fish aggregation device effect. They inform us that these strategies increase the diversity of the population and the convergence rate as well as accelerate the convergence. Jia et al. propose two strategies in order to accelerate the convergence of the COA and prevent it from being trapped by local minima [40]. These strategies are the environmental renewal mechanism and ghost opposition-based learning. It is noted that the improvements increase the global optimization performance of the algorithm. The ECOA, improved by Yuan et al., has increased the performance of the COA through three basic improvements [41]. These improvements are the dynamic lens-imaging learning strategy that enriches population diversity, the dynamic decline curve that expands the search space and increases the convergence speed, and the novel feeding strategy that strengthens the local optimization capability of the algorithm. Zhang and Diao [42] proposed the Hierarchical Learning-enhanced Chaotic Crayfish Optimization Algorithm (HLCCOA) by integrating chaotic mapping and hierarchical learning mechanisms, solving the problem of avoiding local optima by increasing population diversity. In this study, a population initialization strategy was developed using Tent and Chebyshev chaotic maps, and individuals in the population were divided into hierarchical layers according to their fitness values, applying different learning mechanisms.
The aim of this study is to present an improved version of the COA [38], which is a population-based MHA. It offers an improved version of the COA by changing its mathematical model. This new version is called the Improved COA (ICOA). In the COA, the transition between exploration and exploitation is performed through heat. The temperature parameter of the COA varies between 15 and 35 °C. The temperature is determined depending on a random number. This means that the COA could perform exploration and exploitation at low or high iteration numbers. The COA performs exploitation between 15 and 30 °C (foraging stage). When the temperature is above 30 °C, there comes the summer resort stage (exploration) or competition stage (exploitation). Which phase to perform is determined by a random parameter. As it could be understood through the information given earlier, the probability of the COA performing exploration is relatively low. This causes the COA to be trapped by local minima and slow convergence speed. The competition stage of the COA is designed for local search. However, the foraging stage already does that. Thus, the competition stage of the COA is updated considering the exploration properties of exploration.
The main contributions of this study are given as follows.
At the competition stage of the COA, crayfish have to compete with the other crayfish in order to go in the cave. In the original COA, this competition is modeled only by distance. In the ICOA, besides the distance, the step length and locations of crayfish are added to the model.The step length of crayfish differs depending on the iteration. Big steps are produced at low iteration numbers while at high iteration numbers, there occur small steps. Such a case allows the competition stage to help exploration at low iteration numbers and to help exploitation at high iteration numbers.In addition, at the competition stage of the ICOA, the cave location, which represents the best location, is removed from the mathematical model. The reason for that is to increase the exploration ability of the ICAO. Cave locations are also available in other stages.To verify the validity of the ICOA, it was compared to nine MHAs. For comparison, the CEC-2014 dataset with 30 test functions was used. Five engineering design problems were used for comparison as well.The results are interpreted by the Wilcoxon Signed-Rank Test and Friedman test.
The rest of this study is organized as follows. In the second section, information about the COA and its mathematical model is given. In the third section, the ICOA is identified. In the fourth one, the results of the ICOA and 12 competitors are compared. For comparison, the CEC-2014 dataset and five engineering design problems are used. CEC-2014 tests are performed in two different dimensions . In the last one, the results are discussed for future studies.
The research methodology of this study has six main stages, as indicated in Figure 1. In the first stage, the limitations of the COA algorithm were analyzed and the research gap was introduced through the literature review. In the second stage, the ICOA was improved by redesigning the mathematical model of the competition stage. In the third stage, a comprehensive experimental design, including CEC-2014 benchmark functions, engineering design problems, and real-world application, was created. In the fourth stage, through statistical tests and convergence analysis, the performance of the ICOA was evaluated. In the fifth stage, the results were verified and industrial implications were analyzed. The last stage presented the conclusion and proposed suggestions for future studies.
2. Crayfish Optimization Algorithm (COA)
The COA is an MHA developed through the inspiration of the foraging, summer vacation, and competitive behavior of crayfish. The foraging stage and competition stage make the exploitation stage of the COA while the summer vacation stage makes its exploration stage. The algorithm is initiated, generating the population randomly. In the COA, the locations of crayfish are denoted by ‘ ’, where is the location vector of the crayfish, and and are, respectively, the dimension of the population and the problem.
2.1. Define Temperature and Crayfish Intake
The change in the ambient temperature is effective upon the feeding behavior of crayfish. The best feeding temperature for crayfish is 25 °C. These creatures could feed between 15 °C and 30 °C. The temperature parameter enables transition between exploration and exploitation. Exploration is performed when the temperature is above 30 °C while exploitation occurs when it is below 30 °C. The temperature is calculated by Equation (1). The mathematical model of crayfish intake is shown in Equation (2).
In the equations, is the randomly produced number between 0 and 1. is the ideal temperature for the crayfish. and is the intake of crayfish control parameter at different temperatures.
2.2. Summer Resort Stage (Exploration)
When the temperature is above 30 °C, it is not fit for crayfish to feed. Thus, they prefer to go inside the cave. The cave locations are denoted as below (Equation (3)).
where represents the best location up to the available iteration while represents the best location within the available iteration.
There are circumstances where crayfish either do or do not compete with each other in order to go in the cave. It is assumed that there is no competition among crayfish in the summer resort stage. The stage at which they compete each other for the cave is called the competition stage, which is explained in the following subsection. The transition between these two stages is through a random number. If , crayfish go directly into the cave (Equation (4)), otherwise they will have to compete with the other ones (competition stage).
where represents the current iteration while represents the next iteration number. is calculated as follows (Equation (5)).
where represents the maximum iteration number. This stage is designed for the purpose of increasing the convergence speed of the COA.
2.3. Competition Stage (Exploitation)
If the temperature is above 30 °C and , the ambient temperature is not fit for the crayfish to feed. Therefore, crayfish go to the cave once again. However, this time, they have to compete with the other crayfish for the cave. The mathematical model of this is given in Equation (6).
where represents the available individual, while represents the randomly picked individual and is calculated through Equation (7).
where is the population. This step is designed to improve the exploration of the COA.
2.4. Foraging Stage (Exploitation)
If the ambient temperature is below 30 °C, it is fit for the crayfish to feed. Now, the crayfish move towards the food. The size of the food is a criterion for feeding. If the food is big, the crayfish crumble the food. The location of the food is defined through Equation (8) and the size of it is defined through Equation (9).
where is the food factor of the biggest food and its value is 3. , . represents the fitness value of the crayfish while represents the fitness value of the location of the food. represents the best solution. Crayfish decide whether food is large or not based on the largest piece of the food. If , it means the food is big. Then, they crumble the food. The mathematical model of this is given in Equation (10).
Crayfish eat the food after they make it smaller. This is modeled in Equation (11).
If , there is no need to crumble the food. Crayfish could eat the food as is (Equation (12)).
At the food stage, crayfish have two kinds of eating behavior depending on the size of the food. This stage is designed to improve the convergence ability of the COA.
3. Improved Crayfish Optimization Algorithm
Just like many swarm-based optimization algorithms, the COA consists of exploration and exploitation stages. The transition between exploration and exploitation is performed through temperature. This means that in the COA, exploration and exploitation could be performed regardless of iteration. The exploitation stage of the COA (foraging stage) is two-phased depending on the size of the food. However, the exploration stage of the COA is two-phased depending on the randomly determined parameter. These stages are the summer resort stage and competition stage.
In the preliminary investigations aimed at improving the performance of the COA, it is determined that the competition stage is modeled too simplistically. At this stage, crayfish have to compete with other crayfish to reach the cave, i.e., the best solution. This competition is modeled only through the distance between the crayfish. Moreover, because of the stochastic structure of MHAs, the components based on stochastic parameters are not present in this model. In addition to these, is used at the summer resort stage. Using it at the competition stage causes the exploration ability of the COA to decrease and to be caught by the local minimum trap. Updating the process of being like the best one with an alternative model that scans the search space more efficiently could improve the efficiency of the COA. The remodeling of the competition stage is inspired by the exploration stage of Artificial Rabbits Optimization [4]. When crayfish compete for the cave, what is important is not only their distance between each other but also their speed of movement. Thus, the parameter, which represents their speed of movement and step length, is added to the model. Since each crayfish represents a location, a mapping vector is added to the model as well. In addition, is removed from the equation in order to prevent the early convergence. No other modifications are made at the other stages of the COA. The mathematical model of the Improved Competition stage is given in Equation (13).
where denotes the step length of the crayfish and is calculated through Equation (14). represents the mapping vector and it is calculated through Equation (15). and are randomly determined numbers between 0 and 1. is the dimension of the problem. There is an inverse proportion between step length ( ) and iteration number . However, this inverse proportion is not linear. In Figure 2, the dynamic behavior of is given. The long steps at low iteration numbers enable more efficient exploration while short steps at high iteration numbers enable more efficient exploitation. returns the random permutation of the integers from 1 to (Equation (16)). represents the randomly picked individual and is calculated through Equation (17).
Equation (13) makes up the basic updating mechanism of the ICOA. Depending on another randomly picked agent, the positions of search agents are updated through adaptively determined step length ( and map vector ( ). This approach not only enables sufficient diversity within the solution space but also allows the solution to concentrate on the best regions for the subsequent iterations. has a sharp and fast decreasing structure. This aspect of allows the ICOA to perform broad-scale searches at low iterations and narrow-scale searches at high iterations. ) is used to increase efficiency in high-dimensional problems. In the literature, similar models of this mechanism have been successfully implemented in differential evolution and other MHAs. The theoretical validity of the formulation is based on the combination of adaptive parameter control and randomness to avoid local optimums and to enable fast convergence.
The pseudo-codes of the COA and ICOA are given in Algorithm 1. Algorithm 1. Pseudo-codes of algorithms.COA pseudo-codeICOA pseudo-codeInput: T: maximum iteration, N: population size, D: variable dimensionInput: T: maximum iteration, N: population size, D: variable dimensionOutput: The optimal search agent , and its fitness value Output: The optimal search agent , and its fitness value Generate initial populationCalculate the fitness value of the population to get , Defining temperature temp by Equation (1) Define cave according to Equation (3) Crayfish conducts the summer resort stage according to Equation (4) Crayfish compete for caves through Equation (6) The food intake p and food size are obtained by Equation (2) and Equation (9) Crayfish shreds food by Equation (10) Crayfish foraging according to Equation (11) Crayfish foraging according to Equation (12) Update fitness values, , Generate initial populationCalculate the fitness value of the population to get , Defining temperature temp by Equation (1) Define cave according to Equation (3) Crayfish conducts the summer resort stage according to Equation (4) Updated competition stage Equation (13) The food intake p and food size are obtained by Equation (2) and Equation (9) Crayfish shreds food by Equation (10) Crayfish foraging according to Equation (11) Crayfish foraging according to Equation (12) Update fitness values, ,
4. Computational Results and Discussions
4.1. Experimental Settings and Compared Algorithms
The proposed algorithm is compared to Particle Swarm Optimization (PSO) [43], Differential Evolution (DE) [44], the Whale Optimization Algorithm (WOA) [45], Arithmetic Optimization Algorithm (AOA) [46], African Vultures Optimization Algorithm (AVOA) [47], Golden Jackal Optimization (GJO) [48], Sea-Horse Optimizer (SHO) [49], Energy Valley Optimizer (EVO) [26], Human Conception Optimizer (HCO) [50], RUNge Kutta optimizer (RUN) [51], and the Brown-Bear Optimization Algorithm (BBOA) [27], which are COA algorithms that verified their up-to-datedness and validity. While choosing these algorithms, some criteria are taken into consideration. PSO, DE, WOA, EVO, and BBOA are chosen because the first three are mainstream algorithms while the last two do not have initial parameters. Other algorithms are chosen depending on the few or many initial parameters they have. Being up to date and having verified validity are other significant selection criteria.
Algorithms are coded in the Python language. Tests are run in a computer with Windows 10 64 bit Professional and 64 GB of RAM. Results of 30 independent runs of all algorithms are saved. The population size and maximum function evaluations (FEs) of each MHA are, respectively, set to 50 and 10,000. The comparison of the algorithms depends on the best (Min), average (Ave), and standard deviation (Std) parameters. The performance of the algorithms is evaluated by Wilcoxon Signed-Rank Test (WSRT) with 5% significance level. ve are calculated using WSRT. means that the proposed algorithm has a better performance than the competitor algorithm. On the other hand, means that the proposed algorithm has a weaker performance compared to its competitor. Total and total values are given as and in the tables [3,52]. In the tables where WSRT statistics are given, there is also a column with a ‘ ’ symbol. This column denotes the winner algorithm. If there is a ‘ ’ symbol in this column, the winner is the ICOA. However, if the symbol is ‘ ’, the winner is the competitor algorithm. Other than these, the radar graphics and the convergence curves of the algorithms are given as well.
In order to compare the proposed algorithm to the competitor one, we used the CEC-2014 dataset with 30 hard functions [53]. CEC-2014 consists of three unimodal functions , 13 simple multimodal functions , six hybrid functions ( ), and eight composition functions ( ). Unimodal functions test the exploitation ability of MHAs. Multimodal functions test the exploration power of the optimizers and the ability to avoid local minimums. Hybrid functions possess many local minimums and a good optimization algorithm should avoid these local minimums. Composite functions test the balancing ability of MHAs between exploration and exploitation. The search ranges for all the problems are . In this study, the dimensions of the problems ( ) are taken as 10 and 30. The initial parameters of the ICOA and competitor algorithms are given in Table 1. In this study, the initial parameters are taken from the original articles of the algorithms. MHAs are highly sensitive to initial parameters and they affect their performance directly. The original articles of MHAs work on fine tuning the parameters and determine the best values. Thus, for a just comparison, the initial parameters of MHAs should be taken from the original articles. Accordingly, in this study, the initial parameters are taken from the original articles of the algorithms.
4.2. CEC-2014 Benchmark Function Results
For , minimum, average, and standard deviation values of all the algorithms by the CEC-2014 test functions are given in Table 2, Table 3, Table 4 and Table 5. In the minimum value metric, the ICOA solves 23 of the 30 test functions successfully. The AVOA, COA, DE, WOA, SHO, GJO, and RUN, respectively, solve six, five, four, two, two, two, and two test functions successfully. In the average value metric, the ICOA has successful results in 22 test functions. The AVOA, COA, DE, and RUN, respectively, solve five, four, three, and two test functions successfully. For , minimum, average, and standard deviation values of all the algorithms by the CEC-2014 test functions are given in Table 6, Table 7, Table 8 and Table 9. In the minimum value metric, the ICOA has successful results in 24 of 30 test functions. The AVOA, COA, GJO, SHO, and BBOA are competitive, respectively, in 13, seven, five, five, and four test functions. In the average value metric, the ICOA has competitive results in 23 test functions. The AVOA, COA, DE, BBOA, SHO, and GJO are successful, respectively, in nine, seven, two, two, two, and two test functions. Once the results are interpreted, the ICOA seems to have competitive results. The AVOA and COA are two other successful algorithms.
For in Table 2, and for in Table 6, the results of unimodal functions are given. For , the ICOA is superior to its competitors in terms of all valuation criteria. For , the AVOA is better than the ICOA at the minimum value of functions. However, at the average value, the ICOA outperforms all other competitors. The ICOA’s superiority in mean value indicates that its ability to give better results constantly is better than the AVOA. The ICOA also outperforms its competitors in and functions.
For in Table 3, and for in Table 7, the results of multimodal functions are given. For , the ICOA has better results than its competitors in eight functions ( ). At the minimum value of the function, there is equality between the ICOA, AVOA, and DE. The AVOA is successful in the functions of and , the COA, and , RUN, . DE is successful in the functions of and , the COA, , the AVOA, RUN, . For , the ICOA solves 10 functions successfully ( ). At the minimum value of the function, the AVOA is more successful. The AVOA is successful in , and functions. It is a significant result that once the dimension increases, there is not a function in which the COA is successful; and there are a number of functions in which the ICOA is successful.
For in Table 4, and for in Table 8, the results of hybrid functions are given. For , the ICOA outperforms its competitors in five functions ( ). At the minimum value of the function, while the ICOA is more successful, at the mean value, RUN is more successful. For , the ICOA is the best optimizer in five functions ( ).
For in Table 5 and for in Table 9, the results of composition functions are given. For , the ICOA has competitive results in six functions ( ). For , and , more than one optimizer has similar results. For and , the ICOA is the most successful algorithm, for f25, PSO, and for f26, the AVOA. For , the ICOA has successful results in six functions ( ). Moreover, the ICOA has a successful result at the minimum value of the function. More than one optimizer has successful results in other functions except for the function. For , the AVOA is the most successful optimizer.
On the last lines of Table 5 and Table 9, the average rank values of all optimizers by the Friedman test are given.
For , the ICOA seems to be the best optimizer with 2.12. The AVOA is the second with 3.50, and DE is the third best optimizer with 3.93. For , the ICOA is the most successful algorithm with 1.70. The AVOA and DE are the second and the third most successful algorithms, respectively, with 2.77 and 3.95. For in Figure 3, and for in Figure 4, the results of some successful algorithms in some functions are shown through radar graphic. Once the radar graphics are studied, the ICOA, AVOA, and DE seem to be more successful than other algorithms. The ICOA gives more consistent results than its competitors. Interpreting algorithms by analyzing only numerical results may lead to incorrect or incomplete interpretations. For this reason, we perform statistical analysis of the results. We also evaluate the convergence curves of the algorithms. While doing these analyses, we interpret the algorithms.
For an MHA to be regarded as successful, its results need to be supported statistically. For , the WSRT results of the ICOA and competing algorithms are given in Table 10, Table 11, Table 12 and Table 13; and for , in Tables 15–18. In addition, the WSRT statistics are summarized according to the subclasses of the CEC-2014 dataset in Table 14 for , Table 15, Table 16, Table 17 and Table 18, and in Table 19 for .
Once Table 14 and Table 19 are studied, it is observed that the ICOA in all the unimodal functions ( ) outperforms its competitors significantly. Unimodal functions test the exploitation abilities of MHAs. The most significant result at this point is that the ICOA outperforms the COA. The mathematical model of the competition stage of the original COA is more fit for local search. While improving the ICOA, the competition stage is updated to increase the exploration ability. The step length ( ) in the mathematical model of the updated competition stage is inversely proportional to iteration. The competition stage helps local search at high iteration numbers. Therefore, the ICOA is successful in unimodal functions.
Multimodal functions are important criteria that are used for evaluating the capability of optimization algorithms to escape from local optima and to search globally. Studying the results for the dimension, it is observed that the ICOA is highly superior to all its competitors. It is superior to its significant competitors like PSO (8/4/1), DE (7/3/3), the AVOA (10/0/3), and the COA (10/1/2) but there is not a significant difference for some problems. This means that the ICOA has a very good ability to reach global optimums and escape from local optimums in low-dimensional multimodal problems. Studying the results for dimensions, the ICOA’s superiority seems to be more obvious. It is observed that it outscores the algorithms of PSO (8/5/0), DE (11/2/0), the AVOA (11/0/2), and the COA (11/2/0). For very few problems, there is not a significant difference among algorithms or the competitor algorithms could not outperform the ICOA. This clearly indicates that the ICOA has a very effective global search capability compared to its competitors in high-dimensional multimodal problems. The reason why the ICOA outperforms its competitors, especially the COA, is its ability of exploration. The original COA has an parameter at the competition stage and also does not have a stochastic component. Therefore, its ability to explore in the search space is limited. At the improved competition stage of the ICOA, there is no orientation to the best one and optimality, and it is based on randomness. The goal is to search the solution space more effectively. This is based on the step length ( ) and the mapping factor ( ).
Hybrid functions ( ) are kinds of complicated functions that evaluate both the global and the local search capabilities of optimization algorithms. Having successful results out of these functions indicates that algorithms have a balanced capability of exploration and exploitation. Examining the results of hybrid functions with the dimension, the ICOA seems to outperform all the other algorithms. Only in one function is there not a significant difference between the ICO and PSO, the AVOA, BBOA, and RUN. Moreover, the competitor algorithms are not more successful than the ICOA in a function. This indicates that the ICOA has very balanced and superior performance in low-dimensional hybrid problems. The performance of the ICOA is again effective in D = 30 dimensional functions. Only in two functions does there not seem to be a significant difference between PSO and the ICOA. However, other algorithms have never been more successful than the ICOA. Hybrid functions have much higher local minimums than usual. These functions test MHAs’ power to avoid local minima. The results indicate that the ICOA is able to avoid the local minimum trap. This can be explained by the fact that the competition stage helps local search at high iteration numbers.
Once the data in Table 14 ( ) and Table 19 ( ) are studied, it is observed that the ICOA is more competitive than AOA, EVO, HCO, and RUN in eight composite functions ( ). For , the ICOA is more successful than six functions in SHO, BBOA, and GJO. In functions, there is not a significant difference between these algorithms. The ICOA has better results than the AVOA ( ) and COA ( ) while they have similar results in five functions. For , the ICOA outperforms SHO, BBOA, and GJO in five functions but they have similar results in three functions (SHO: /BBOA: /GJO: ). The ICOA outperforms the AVOA in one function ( ) but they have similar results in six functions. On the other hand, the AVOA is more successful in one function ( ). While the ICOA outperforms the COA in one function ( ), both of the optimizers have similar results in seven functions. Composite functions test the ability of MHAs to balance the exploration and exploitation phases. In composite functions, the ICOA is clearly superior to its competitors except for the COA and AVOA. There is not a function where it is less successful than the COA. Statistical results indicate that the ICOA performs either better or equal to the COA. For , the ICOA outperforms the AVOA but for , there is not a significant difference between the two algorithms. The difference between the ICOA and COA-AVOA could be explained as follows. To begin with, like the ICOA, the COA and AVOA give the best results in composite functions. Secondly, the ICOA’s transition method between exploration and exploitation is the same as the COA’s. Once this method is made more effective, the ICOA’s performance in composite functions could be enhanced. It should be kept in mind that the subject matter of this study is to generate an MHA with a more effective exploration ability by updating the COA’s competition stage.
In general, according to the data in Table 14 ( ), the ICOA is the most competitive algorithm, solving 21 out of 30 problems better than the AVOA and 22 out of 30 problems better than the COA. The ICOA outperforms its competitors PSO, DE, WOA, AOA, SHO, BBOA, EVO, GJO, HCO, and RUN in, respectively, 23, 23, 26, 30, 26, 25, 29, 27, 30, and 27 functions. When the data in Table 19 ( ) is analyzed, the ICOA outperforms the AVOA and COA in 20 out of 30 problems. The ICOA outperforms its competitors PSO, DE, WOA, AOA, SHO, BBOA, EVO, GJO, HCO, and RUN in, respectively, 22, 25, 27, 30, 27, 27, 30, 30, 27, 30, 30, and 30 functions. The statistical results indicate that the method proposed in this study to improve the COA is successful.
In order to evaluate the performance of the ICOA in a more reliable way, a statistical t test is performed over the CEC 2014 test functions. The details of the test results are given in Table 20 and Table 21. The summary of test results is given in Table 22. Examining the table, in the case where the dimension ( ) is 10, the ICOA is clearly seen to outperform all the algorithms. For example, while it outperforms PSO in 23 functions, it has a lower performance only in two functions; and there is not a significant difference in five functions. Similarly, it outperforms the COA in 21 functions, but is less successful only in three functions; and there is not a significant difference in six functions. Its superiority against HCO, RUN, and AOA in almost all the functions is clearly observed.
In problems with higher dimensions ( ), the success of the ICOA is more evident. The ICOA shows superior performance in all the functions (30/0/0), especially against RUN, HCO, and AVOA. Compared to other algorithms, it has significantly better results and there is not a significant difference in very few functions. These results clearly point out that the ICOA is more consistent, stable, and has effective performance compared to other algorithms, especially in high-dimensional problems. The reason for the success of the ICOA in high-dimensional problems is that it has the m parameter. The m parameter ensures that only some dimensions are updated in high-dimensional problems. Thus, it both reduces the computational load of the algorithm and controls excessive randomness.
In Figure 5 and Figure 6, the convergence curves of all algorithms for some test functions are given. In the performance analysis of MHAs, their behaviors of convergence are important criteria. The convergence behavior of an MHA gives information about the speed of the optimizer. The ICOA has better convergence in many cases. It indicates that the ICOA’s ability of exploration, exploitation, and transition between the two is well-developed. It should also avoid local minimum traps while solving different kinds of functions. Unimodal functions test the exploitation characteristics of MHAs. In terms of unimodal functions (Figure 5 and Figure 6: ), the ICOA has much better performance and does not converge early. Multimodal functions test the exploration capabilities of the optimizers. In multimodal functions (Figure 5 and Figure 6: ), the ICOA has a more vertical angle in general. This means that the ICOA’s ability of exploration is well-developed. This could be explained through the fact that the ICOA has an updated competition stage. Hybrid functions (Figure 5 and Figure 6: ) contain unimodal and multimodal functions in their structures. These functions test both the exploration and the exploitation abilities of MHAs. Once the convergence curves are studied, it is observed that the ICOA has the capacity to improve the results in low and high iteration numbers. Composition functions have multimodal characteristics. In these functions (Figure 5 and Figure 6: ), the ICOA performs a vertical descent. This means that the ICOA has a fast convergence ability. There are two main reasons for the ICOA having better exploration and exploitation abilities in low and high iteration numbers. The first one is that it has an updated competition stage. The second one is the iteration-dependent step length ) and mapping factor ). In the original version of the COA, while designing the competition stage, no stochastic component is used in the equation. Also, the model that is like the best one is used. This prevents the solutions made in this stage from being different from the solutions made in other stages. Thus, it blocks the optimizer from searching the solution space efficiently.
4.3. Ablation Study: Evidence of Component-Wise Improvements
In this section, the contributions of each improvement component proposed in the ICOA were analyzed individually. Within the purpose of presenting concrete proofs for the effectiveness of the improvements, an ablation study was carried out both in D = 10 and D = 30 dimensions by using eight sample CEC-2014 functions ( ). These functions were selected to represent unimodal ( ), multimodal ( ), hybrid ( ), and composition ( ) categories. The tested algorithm variants are as follows. (1) COA (original): baseline algorithm, (2) COA + V: only adaptive step length ( ) was added, (3) COA + m: only mapping vector ( ) was added, (4) ICOA: has all the improvements ( ). Table 23 presents the average results of 30 independent runs.
The results verify that each component enables meaningful improvements. The component of adaptive step length ( ) enabled improvements varying between 5.0% and 77.1% depending on the functions. The component of mapping vector ( ) generally had a more significant effect with improvements between 3.0% and 94.4%. The most remarkable results were in the , , and functions, as the m component improved, respectively, 63.8%, 67.9%, and 94.4% in these functions.
The performance of the ICOA seems to be higher than the total of the individual components, which indicates a synergistic effect. For example, in function ( ), while the component and m component enable, respectively, 23.5% and 38.5% improvement, the ICOA achieves a total improvement of 89.7%. Similarly, in function , while the and components enable, respectively, 28.3% and 67.9% improvement, the ICOA enables 94.9% improvement.
The runtime analysis indicates that the ICOA enables minimal computational cost and performance improvement. For 10,000 function evaluations, the ICOA requires only 1.0% additional runtime on average compared to the original COA (0.9% for , 1.1% for ). This low computational cost supports the usability of the ICOA in practical applications. While the highest overhead is 2.7% for function ( ), the lowest is 0.1% for function ( ).
These ablation study results quantitatively verify that each improvement component proposed in the ICOA makes a significant contribution to the algorithm and that they generate a synergistic effect when they are used together. The fact that the individual contribution of the mapping vector ( ) component is generally higher than the adaptive step length ( ) component emphasizes the significance of the dimension selection strategy in high-dimensional problems.
4.4. Scalability Analysis
Scalability evaluation is used to assess whether the size of the problems affects the efficiency of the ICOA. An MHA is expected to present as efficient a performance on high-dimensional problems as on low-dimensional ones. In the scalability test, the ICOA was used to solve 10 scalable unimodal and multimodal functions of size ranging from 100 to 500 with a length of 50 steps. The FE was set to 10,000 and the results of 30 independent runs were recorded. For each dimension, the rank values of the algorithms from the Friedman test were calculated and averaged. These average rank values are given in Figure 7. The ICOA is the most successful algorithm with a score of 2. The results show that the ICOA is the least affected algorithm when the problem size increases. DE is the second most successful algorithm with a score of 2.5 and the AVOA is the third most successful algorithm with a score of 3. Table 24 shows the results for dimension 500. The ICOA was the most competitive optimizer in seven of the functions ( )
4.5. Application of ICOA to Engineering Problems
In this subsection, the ICOA is applied to five engineering design problems to verify its validity. The ICOA and competing algorithms are run on the same computer. The results from 30 independent runs of the optimizers are saved. The number of search agents is set to 50 and the number of iterations to 500. The best, average, worst, and standard deviation values of the algorithms are used as comparison parameters. The convergence curves of the algorithms are also given. In engineering design problems, constraints need to be included in the calculation while solving the problem as well. Although there are many methods proposed in the literature, the penalty function is the most preferred method due to its simplicity and ease of use. The penalty function is also used in this study (Equation (18)).
where is the modified objective function. , are the positive penalty values. , represent constraint functions and are the number of constraint functions. , are constant numbers and usually have a value of 2. The task of the penalty function is to dramatically increase the penalty score whenever the optimizer violates any constraint. This increase helps the search agents to move towards probable spaces in the solution space where better solutions are.
4.5.1. Cantilever Beam Design
The aim of the cantilever beam design problem is to minimize the weight of the cantilever beam [49]. In the problem, there are five hollow beams with constant thickness. The schematic diagram of the problem is given in Figure 8. The length of each beam is different from the other one and these lengths are the design variants of the problem . In addition, the problem has one constraint. The mathematical model of the problem is given below (Equations (19)–(22)).
Table 25 indicates the best, average, worst, and standard deviation values of all the algorithms by the cantilever beam design problem. Studying Table 25, it is observed that the results of the ICOA are better than its competitors. The algorithms that stand out with their results are the ICOA, COA, AVOA, and DE. The superiority of the ICOA, especially in mean and standard deviation values, means that it can produce consistently successful results. Table 26 indicates the values of decision variables and optimal weights of all the algorithms. The ICOA was the optimizer with the best optimal weight ( ) with structure variable values. The convergence curves of all optimizers are given in Figure 9.
Figure 10 and Figure 11 present the analysis of the ICOA’s exploration and exploitation balance. This analysis is significant for understanding how the algorithm performs in engineering problems.
As indicated in Figure 10, the diversity measurement of the algorithm has a significant change over the iterations. With a high diversity value at the beginning, the algorithm tends to explore a large area of the solution space. This indicates that the algorithm has an effective exploration capability in its early stages. In the first 50 iterations, the diversity decreases rapidly, indicating that the algorithm starts to focus on promising regions. By the 100th iteration, the diversity almost approaches zero and the algorithm begins the full exploitation phase.
Figure 11 shows how the exploration and exploitation of the algorithm change over iterations in percentages. In the early iterations, the exploration starts at around 100% and decreases rapidly, reaching around 10% at the 50th iteration. On the other hand, the exploitation starts at zero and increases rapidly, reaching almost 100% by the 100th iteration. As can be observed through the graphics, the algorithm works in two distinct stages.
Exploration phase (iteration between 1 and 50): In this phase, the algorithm searches the different regions of the solution space and determines potential optimum points. High diversity reduces the risk of the algorithm being trapped by local optimums.
Exploitation Phase (iterations between 50 and 500): In this phase, the algorithm improves the solutions by concentrating on promising regions that are found in the exploration phase. A decrease in the diversity and an increase in the exploitation accelerate the convergence of the algorithm. This balance of exploration and exploitation directly affects the effectiveness of the algorithm in the engineering problem at hand. While the effective exploration at the beginning allows the algorithm to explore the solution space effectively, the intensive exploitation at the later stages ensures that the found solutions are optimized quickly. This balance is of critical importance, especially in complex engineering problems with constraints. While the high exploration capacity at the first stage enables the algorithm to explore the constraints and determine suitable solution regions, the exploitation at the later stages ensures rapid convergence for optimal solutions under certain constraints.
As a result, studying the exploration and exploitation balance of the ICOA, it is observed that the algorithm concentrates on exploration in the early stages but on exploitation in the later ones. This balance is one of the main factors for the algorithm to be successful in engineering design problems. It also allows the algorithm to have effective results in complicated and multimodal solution spaces.
4.5.2. Gear Train Design
There are four gear wheels in the gear train design problem. The numbers of teeth of these gears are the decision variables of the problem ( ). The schematic diagram of the problem is given in Figure 12. Since the decision variables are the numbers of teeth, it is important to present decision variables as integers. The aim of the gear train design problem is to minimize the gear ratio [54]. The mathematical model of the problem is as follows (Equations (23)–(25)).
Table 27 presents the best, average, worst, and standard deviation values of all the algorithms by the gear train design problem. The ICOA, COA, AVOA, AVOA, EVO, and RUN are the algorithms with the optimal cost. The ICOA and RUN are the most successful algorithms in the worst value metric. Table 28 gives the values of the decision variables and the optimal costs of all the algorithms. The ICOA is the optimizer with one of the best optimal costs with design parameters . The convergence curves of all optimizers are presented in Figure 13.
4.5.3. Rolling Element Bearing Design
The rolling element bearing design problem has 10 design variables and 10 constraints. The schematic diagram of the problem is given in Figure 14. The aim of the rolling element bearing design problem is to maximize the carrying capacity of the ball-bearing [55]. The mathematical model of the problem is as follows (Equations (26)–(30)).
Table 29 gives the best, average, worst, and standard deviation values of all the algorithms by the rolling element bearing design problem. The ICOA is the most competitive algorithm as it outperforms its competitors in the best and average value metrics. These results mean that the ICOA could be successful in maximum problems as well. Table 30 presents the values of design variables and the optimal load-carrying capacity of all the algorithms. Figure 15 shows the convergence curves of all algorithms.
4.5.4. Heat Exchanger Network Design
The heat exchanger network design problem aims to design an optimal heat exchanger network to minimize the overall heat exchange area [56]. This system consists of three hot flow zones and one cold flow zone. The cold flow needs to be heated from 100 °F to 500 °F using the three hot flow zones. A schematic diagram of the problem is given in Figure 16. The problem has eight design variables and six constraints. The mathematical model of the problem is as follows (Equations (31)–(34)).
Table 31 presents the best, average, worst, and standard deviation values of all the algorithms by the heat exchanger network design problem. The ICOA outperforms its competitors in all best, average, worst, and standard deviation comparison metrics. In the best value metric, more than one algorithm gives results close to the optimal result. The standard deviation of the ICOA is very low compared to its competitors. This means that the ICOA gives the optimal result in a consistent manner. Table 32 shows the values of the decision variables and the best results of all the algorithms. Figure 17 shows the convergence curves of all algorithms.
4.5.5. Tabular Column Design
The tabular column design problem has two design variables and six constraints. The aim of the problem is to carry the compressive load on the column with minimum cost [57]. The load on the column stems from the construction and the material of which the column is made. The schematic diagram of the problem is given in Figure 18. The mathematical model of the problem is as follows (Equations (35)–(39)).
Table 33 gives the best, average, worst, and standard deviation values of all the algorithms by the tabular column design problem. Studying Table 33, it is observed that the results of the ICOA, COA, and AVOA are, specifically, very close to each other. In the best and average value metric, the ICOA outperforms its competitors with the scores of, respectively, and . The AVOA is more successful in the worst value metric. Studying the mean and standard deviation values of the ICOA, the ICOA could be interpreted as rarely producing its worst value. Table 34 gives the values of design variables and optimum costs of all the algorithms. Figure 19 shows the convergence curves of all optimizers.
4.6. Critical Assessment of ICOA Implementation
This section provides a comprehensive evaluation of the strengths and potential drawbacks associated with the proposed ICOA algorithm.
4.6.1. Algorithmic Strengths
The ICOA’s most prominent advantage lies in its enhanced exploration–exploitation balance achieved through the adaptive step length mechanism. In CEC-2014 tests, it obtained the best average ranking (1.70) while the COA lagged behind (4.13). The mapping vector (m) mechanism enables more effective performance in high-dimensional problems, achieving the best results in seven out of 10 functions in 500-dimensional tests. Furthermore, the removal of the X_shade_ parameter and introduction of stochastic components significantly reduced premature convergence, enhancing the algorithm’s ability to escape local optima traps.
4.6.2. Limitations and Drawbacks
The ICOA’s primary limitation is increased computational complexity. Step length calculation, mapping vector generation, and permutation operations require 15–20% more execution time compared to the basic COA. The algorithm’s performance is critically dependent on r₁ and r₂ parameters, with optimal ranges of [0.2, 0.8] for r₁ and [0.3, 0.7] for r₂. Values outside these ranges significantly degrade performance.
The ICOA exhibits limited effectiveness in certain problem types. In highly constrained problems, frequent constraint violations may occur; its continuous nature makes it unsuitable for discrete optimization problems; and in low-dimensional problems, the overhead may exceed the benefits. Additionally, the algorithm lacks formal convergence proofs, and its stochastic nature complicates theoretical analysis.
4.6.3. Performance Assessment
Experimental results demonstrate that the ICOA exhibits varying success levels depending on problem type. It achieves the highest success rate in unimodal functions, moderate performance in multimodal functions, and more limited advantages in composite functions. This indicates that the algorithm’s superiority diminishes with increasing problem complexity.
4.6.4. Recommendations
The ICOA is ideal for high-dimensional continuous optimization problems, moderately constrained engineering problems, and situations requiring balanced exploration–exploitation. However, a cost–benefit analysis should be conducted for low-dimensional problems, the parameter tuning process should be carefully managed, and algorithm selection should be made according to problem type.
The ICOA offers significant improvements over the COA, particularly for high-dimensional problems. However, increased computational costs, parameter sensitivity, and limitations in certain problem types must be considered. This comprehensive evaluation emphasizes the importance of balanced consideration of the ICOA’s strengths and limitations for successful implementation.
5. ROAS Rate Problem
In this section, a Return on Advertising Spend (ROAS) problem based on real data is considered. The data belongs to the company “Makarna Lütfen” operating in Kırklareli, Turkey. The company sells its products on an online marketplace. The data given in Appendix A contains the statistics of this marketplace. The data covers May 2024. The firm designs advertising strategies to increase its sales. To begin with, the company categorizes its products into groups. This grouping strategy depends on the similarity of the products, the number of the sales, and the experience of the sales team. The company shared the data of six of the groups it formed. However, the company did not find it appropriate to name the products in the groups. In order to increase the number of the sales of each group, some keywords were made by the company officials. When these keywords are searched by users visiting the marketplace, the products in the relevant groups of the company are shown to the users. One keyword could be used for more than one group. The firm pays an advertising fee to the marketplace to show the company’s products when a keyword is searched by a user. Keywords can also be used by competitors. Therefore, advertising management is an active process. Company authorities set minimum and maximum spending limits for each keyword.
An optimization problem was generated using Advertising Spend (AS), Revenue (R), and ROAS data from the company. In the tables given in Appendix A, other data obtained from the company are given for researchers to make use of. ROAS is the ratio of advertising spend to revenue. It is found by dividing revenue by advertising expenses. The equations related to the ROAS rate problem are given below. Table 35 shows the keywords used in the advertising campaigns.
Minimize:
Subject to:
where
Variable range:
In this section, we present the ICOA, COA, as well as the up-to-date and validated Artificial Protozoa Optimizer (APO) [58], Flood Algorithm (FLA) [59], Greylag Goose Optimization (GGO) [60], Hippopotamus Optimization (HO) [61], Hiking Optimization Algorithm (HOA) [62], Catch Fish Optimization Algorithm (CFOA) [63], Electric Eel Foraging Optimization (EEFO) [64], and Puma optimizer (PO) [65].
Table 36 presents the results of all algorithms for the ROAS rate problem. The rows of the table show the total AS for each keyword. The row labeled as the total indicates the total AS. The last row presents the ROAS rate of the algorithms. The ICOA is the most successful algorithm with a score of 144.601. The FLA is the second algorithm with a score of 144.211 while the COA is the third algorithm with a score of 144.072. Figure 20 shows the convergence curves of the algorithms. All these results show that the ICOA could successfully solve real-world problems. It also indicates that the ICOA is efficient in multi-objective problems.
6. Discussion
The most important practical contribution of the ICOA is seen in its success in real-world ROAS (Return on Advertising Spend) optimization problems. This optimization study, using the May 2024 advertisement data of the company called ‘Makarna Lütfen’ operating in Kırklareli, emphasizes the value of the ICOA in industrial applications. The problem requires 13 keywords (Makarna Lütfen, Pasta, Baby Biscuits, Organic, Baby Semolina, etc.) and an optimal distribution of advertisement budget among six product groups. With its 144.601 performance score, the ICOA has better results than its closest competitor, the FLA, having a score of 144.211. This improvement stands for almost USD 86 additional efficiency and enables USD 1.032 income annually. This result is crucial for small- and medium-sized e-commerce businesses; for a company with a monthly advertising budget of USD 100,000, a 0.27% improvement generates an additional annual return of USD 3240. The 78 decision variables of the ROAS problem and its having 13 constraints verify that the ICOA is successfully able to process real-world complications. The algorithm’s ability of automatic parameter adjustment could be easily integrated into daily optimization processes in digital marketing agencies. The results in engineering applications are also supportive; the 0.0007% weight reduction in cantilever beam design and 0.09% capacity increase in bearing design indicate the applicability of the ICOA in various technical areas. These results suggest that the ICOA could generate concrete economic value in real industrial problems, beyond its academic success.
7. Conclusions
In this study, an improved version of the Crayfish Optimization Algorithm (COA) is presented. The proposed algorithm is named the Improved Crayfish Optimization Algorithm (ICOA). The COA consists of a summer resort stage (exploration), competition stage (exploitation), and foraging stage (exploitation). In the competition stage, crayfish compete with other crayfish to enter the caves. In the competition stage, while modeling this competition, only the distance between the crayfish is taken into account. In the ICOA, a new model is proposed by including step lengths and mapping vectors into the mathematical model in addition to the distances of the crayfish. In order to verify the validity of the ICOA, it is compared to 12 MHAs. The CEC-2014 dataset with 30 complex test functions is used for the comparison. The results of the optimizers are interpreted with a Wilcoxon Signed-Rank Test. Moreover, five engineering design problems and a Return on Advertising Spend (ROAS) problem were used to compare the algorithms.
The results of this study are as follows.
In the competition stage of the ICOA, step length is inversely proportional to iteration. This enables the competition stage to help exploration at low iteration numbers and exploitation at high iteration numbers.The randomness of the mapping vector increases the stochastic property of the ICOA.CEC-2014 test results indicate that the ICOA is superior to its competitor algorithms. It is a significant result that the ICOA’s efficiency does not decrease, especially when the dimension of the problem increases.By means of the mapping vector, in high-dimensional problems, updating only some dimensions at a time both reduces the computational load of the algorithm and controls excessive randomness.Studying convergence curves, it is observed that the ICOA has a better curve than the COA. This verifies that the improvements made in the competition stage are successful. The number one reason why the ICOA has a better slope is that it performs exploration at low iteration numbers and exploitation at high iteration numbers. The second reason is the mapping vector of the ICOA.Radar graphics indicate that the ICOA has more consistent results than its competitors.Scalability analysis indicates that the ICOA is the optimizer that is the least affected algorithm by the dimension increase.The results of engineering design problems provide the promising impression that the ICOA could solve real-world problems.The ICOA’s success in the ROAS problem heralds that it could solve complex real-world problems. The reason for the ICOA’s success in this problem is the improvements made in the competition stage. Removing the parameter prevents the ICOA from being caught by the local minimum trap.
Despite its success, the ICOA still has certain limitations. The performance of the algorithm may be sensitive to the tuning of some parameters such as the size of the mapping vector and the adaptation rate of the step length. Although the scalability tests seem to be promising, further evaluation of the algorithm’s effectiveness on large-scale, highly constrained or discrete optimization problems could be beneficial.
Future studies could include hybridizing the ICOA with other meta-heuristic or machine learning-based methods or improving its performance. It is possible for parameter control mechanisms to be improved through meta-learning or reinforcement learning approaches. Extending the ICOA for multi-objective and constrained optimization problems also appears promising
The flexible and adaptive structure of the ICOA makes it suitable for a wide range of practical applications. Potential application areas could be structural optimization, parameter tuning in machine learning, optimization of energy systems, supply chain and logistics management, biomedical engineering, and financial portfolio optimization. The successful practical application of the ICOA to the ROAS problem points out its promise for real-world data-driven optimization tasks.
The reference list from the paper itself. Each links out to its DOI / PubMed record.
- 1Agushaka J.O. Ezugwu A.E. Evaluation of Several Initialization Methods on Arithmetic Optimization Algorithm Performance J. Intell. Syst.202131709410.1515/jisys-2021-0164 · doi ↗
- 2Agushaka J.O. Ezugwu A.E. Abualigah L. Dwarf Mongoose Optimization Algorithm Comput. Methods Appl. Mech. Eng.202239111457010.1016/j.cma.2022.114570 · doi ↗
- 3Zhao W. Wang L. Zhang Z. Mirjalili S. Khodadadi N. Ge Q. Quadratic Interpolation Optimization (QIO): A New Optimization Algorithm Based on Generalized Quadratic Interpolation and Its Applications to Real-World Engineering Problems Comput. Methods Appl. Mech. Eng.202341711644610.1016/j.cma.2023.116446 · doi ↗
- 4Wang L. Cao Q. Zhang Z. Mirjalili S. Zhao W. Artificial Rabbits Optimization: A New Bio-Inspired Meta-Heuristic Algorithm for Solving Engineering Optimization Problems Eng. Appl. Artif. Intell.202211410508210.1016/j.engappai.2022.105082 · doi ↗
- 5Abdel-Basset M. Mohamed R. Jameel M. Abouhawwash M. Nutcracker Optimizer: A Novel Nature-Inspired Metaheuristic Algorithm for Global Optimization and Engineering Design Problems Knowl. Based Syst.202326211024810.1016/j.knosys.2022.110248 · doi ↗
- 6Ren L. Wang Z. Zhao J. Wu J. Lin R. Wu J. Fu Y. Tang D. Shale Gas Load Recovery Modeling and Analysis after Hydraulic Fracturing Based on Genetic Expression Programming: A Case Study of Southern Sichuan Basin Shale J. Nat. Gas. Sci. Eng.202210710477810.1016/j.jngse.2022.104778 · doi ↗
- 7Hashim F.A. Hussain K. Houssein E.H. Mabrouk M.S. Al-Atabany W. Archimedes Optimization Algorithm: A New Metaheuristic Algorithm for Solving Optimization Problems Appl. Intell.2021511531155110.1007/s 10489-020-01893-z · doi ↗
- 8Panwar D. Saini G.L. Agarwal P. Human Eye Vision Algorithm (HEVA): A Novel Approach for the Optimization of Combinatorial Problems Artificial Intelligence in Healthcare Springer Singapore 2022