InfoKids+: A Validation Study of a Pediatric Acuity Risk Stratification Algorithm
Carl A. Starvaggi, Sophie Affentranger, Noelie Lengeler, Johan N. Siebert, Annick Galetto-Lacour, Rainer Tan, Manon Jaboyedoff, Claudia E. Kuehni, Mary-Anne Hartley, Kristina Keitel

TL;DR
This study evaluated a pediatric triage algorithm called InfoKids+ and found it disagreed significantly with nurse-based triage, highlighting the need for careful validation before use.
Contribution
The paper presents a prospective validation study of the InfoKids+ algorithm in a real-world pediatric emergency setting.
Findings
InfoKids+ showed only slight agreement with nurse-based triage (κlw=0.08).
The algorithm overreferred 50% of cases and underreferred 5%.
888 cases (45%) were correctly aligned with nurse-based triage.
Abstract
To prospectively validate InfoKids+, a pediatric acuity electronic risk stratification algorithm (eRSA), against a nurse-based triage standard (nbTS). We conducted a prospective validation study in a Swiss university hospital pediatric emergency department to assess the performance of a pediatric acuity eRSA, InfoKids+, on the basis of a well-established parental guidance application, InfoKids. Participants completed the eRSA once seated in a consultation booth. We compared the acuity levels from InfoKids+ (urgent, <4 hours; nonurgent, <24 hours; and no emergency, ≥24 hours) against an nbTS. The primary outcome was the level of agreement and rate of alignment between InfoKids+ and the reference standard. We included 1990 participants from June 3, 2020, through January 31, 2022. InfoKids+ showed a slight level of agreement with the nbTS (κlw=0.08; 95% CI, 0.06-0.10). InfoKids+ triaged…
Genes, proteins, chemicals, diseases, species, mutations and cell lines named across the full text — each resolved to its canonical identifier and authoritative record.
Click any figure to enlarge with its caption.
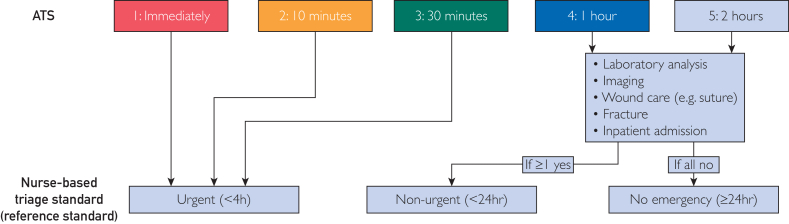 Figure 1
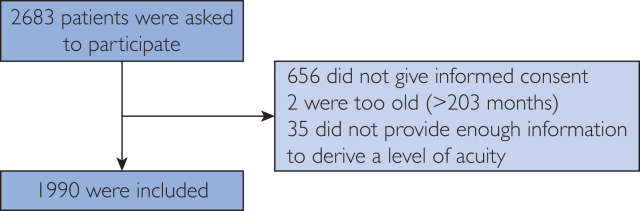 Figure 2
Peer Reviews
No public reviews on file for this paper yet. If you reviewed it on a platform where reviews are public (OpenReview, ICLR, NeurIPS, ICML), you can paste yours below so the community can read it here.
Videos
No videos yet. Explain this paper in a talk, walkthrough, or lecture? Add one.
Taxonomy
TopicsClinical Reasoning and Diagnostic Skills · Healthcare cost, quality, practices · Artificial Intelligence in Healthcare and Education
In recent years, pediatric emergency departments (PEDs) have witnessed a marked increase in visits, with low-acuity cases largely contributing to this rise.1 In 2018, low-acuity cases accounted for 54% of all PED visits in 2 Swiss university hospitals.2 This trend coincides with the rising use of online health resources, including web-based and smartphone-driven self-diagnosis tools.3 These tools have raised concerns due to their lack of validation and opaque underlying logic.4 Notably, a review encompassing 15 primary care self-triage instruments revealed inaccurate triage advice for 43% of clinical scenarios, underscoring the need for more reliable tools.4
Besides self-diagnosis tools, electronic risk stratification algorithms (eRSAs) have emerged as user-friendly interfaces that not only provide probabilistic guidance but also facilitate continuous data collection to enable monitoring for effectiveness improvements. In light of a 2020 directive from the European Union, validation of the safety and efficacy of eRSA guidance should be performed before routine implementation.5^,^6 Robust validation processes are increasingly important in the era of artificial intelligence where the logic of algorithms is less interpretable and for which continuous learning needs to be anchored to meaningful clinical outcomes.7
Our study aimed to focus on InfoKids, a digital information mobile application developed by the Geneva University Hospitals PED team for caregivers, addressing common pediatric urgent care concerns.8 Since its publication in 2015, the application has been downloaded over 70,000 times, showing good to excellent usability.9 However, the guidance of InfoKids has not been previously evaluated. We therefore transformed the content of the InfoKids application into an eRSA, InfoKids+, and compared its acuity level assignment with routine triage.10
The primary goal of our study was to prospectively validate InfoKids+ to accurately determine the acuity level in pediatric emergency situations. Secondary objectives were (1) evaluating factors influencing the interpretation and future adoption of InfoKids+ by caregivers and (2) collecting data for the development of an evidence-based enhancement of InfoKids+, preparing it for potential implementation in routine practice.
Participants and Methods
We conducted a prospective validation study at the Bern University Hospital PED, located in the German-speaking part of Switzerland. Serving a catchment area of approximately 400,000 children, the PED handles around 27,000 visits annually.11 The study’s primary goal was to assess the performance of InfoKids+, an eRSA, in determining the urgency level of pediatric patients’ conditions. We compared this assessment against a nurse-based triage standard (nbTS). We also explored symptom groups and sociodemographic characteristics associated with incorrect acuity level assignments. The data collection period spanned 20 months, from June 3, 2020 through January 31, 2022, coinciding with the COVID-19 pandemic in Switzerland.
Participants
Participants included all legal guardians of children aged 0 to 16 years visiting the PED. We obtained written informed consent and additional assent from children aged older than 13 years. The study did not use specific exclusion criteria. Participant recruitment was continuous, with the research team available onsite during varied hours throughout the 24-hour day. This study was approved by the Bernese Cantonal Research Ethics Committee.
We aimed at enrolling 2000 patients with an estimated distribution of the acuity level on the basis of routine data from the PED: 40% urgent (<4 hours), 50% nonurgent (<24 hours), and 10% no emergency (≥24 hours). Using normograms calculations proposed by Buderer,12 we aimed for the following sample sizes for each acuity level (α=0.05, absolute precision=0.07): 800 urgent (<4 hours), 150 nonurgent (<24 hours), and 900 no emergency (≥24 hours), resulting in 1850 participants.
InfoKids+ eRSA (Index Test)
The InfoKids+ eRSA served as the index test for assessing the acuity level. We developed an electronic case report form (eCRF), on the basis of the well-established InfoKids application, to mirror InfoKids+ question structure (Supplemental Figure 1, available online at https://www.mcpdigitalhealth.org).8^,^10 We incorporated chief complaints, symptom groups, questions, and acuity levels from the original application into the eCRF.10 It is important to note that the acuity levels given by the InfoKids application are not on the basis of the Australasian Triage Scale (ATS) used in Bern nor the Canadian Triage and Acuity Scale used in Geneva. Participants completed the eCRF once situated within a consultation booth after triage and were instructed to simulate responses as if they still were at home. Using the eCRF entries, the eRSA calculated the acuity level, which remained concealed from patients, parents, and clinical staff. Our study team defined the following 2 acuity levels: (1) urgent (<4 hours), (2) nonurgent (<24 hours), and (3) no emergency (≥24 hours).
Nurse-Based Triage Standard (Reference Standard)
The reference standard relied on the ATS-based acuity level determined by triage nurses up patients’ arrival at the PED.13 To align with InfoKids+’ focus on advising care urgency rather than providing a diagnosis, we used acuity levels from the ATS instead of diagnostic classifications. We defined the same 3 acuity levels for the reference standard as for the index test as described further.
The ATS establishes 5 acuity levels: (1) immediate doctor attention, (2) ≤10 minutes, (3) ≤30 minutes, (4) ≤60 minutes, and (5) ≤120 minutes.13 Trained triage nurses ascribe these levels to patients upon arrival at the PED. Notably, the ATS lacks a classification for care needed within 24 hours or for self-care. Recognizing that pediatric primary care providers might lack resources to perform certain diagnostic (eg, x-rays) and treatment (eg, sutures) procedures for some nonurgent cases, we defined the reference standard considering the following 3 constraints (Figure 1):
- 1.Urgent (<4 hours): ATS 1, 2, or 3;
- 2.Nonurgent (<24 hours): ATS 4 or 5 with laboratory analysis and/or image study and/or wound care and/or fracture and/or inpatient admission;
- 3.No emergency (≥24 hours): ATS 4 or 5 without any conditions listed in the second point. Figure 1. Interconnection between the Australasian Triage Scale (ATS) and the nurse-based triage standard (nbTS) used as reference standard in this study.
Comparison
We compared the acuity levels coming from the nbTS with the ones generated by InfoKids+. This comparison yielded the following 3 potential outcomes:
- •Aligned: InfoKids+ and the nbTS assigned the same acuity level;
- •Overreferred: InfoKids+ assigned a higher acuity level than the nbTS;
- •Underreferred: InfoKids+ assigned a lower acuity level than the nbTS.
Our study team had access to the ATS level through the electronic patient data system. The eRSA details, however, were exclusively accessible to the study team responsible for data analysis. Time intervals and clinical interventions between the index test and reference standard were not evaluated due to the preclinical nature of InfoKids+.
Statistical Analyses
We used StataMP16 (StataCorp) to conduct our data analysis. We excluded missing values from our calculations. Descriptive statistics encompassed frequency, percentages, means, standard deviations, and medians. P<.05 was considered statistically significant. We compared the acuity levels of InfoKids+ and nbTS using a 3 × 3 table and the Pearson χ^2^ test. To analyze the level of agreement between the index test and the reference standard, we used the linear-weighted κ. We predefined subgroup analyses to explore alignment variations across symptom groups and sociodemographic characteristics using the Pearson χ^2^ test. We did not perform formal adjustments for multiple testing nor any sensitivity analysis. An exploratory subgroup analysis assessed changes in the level of agreement by altering the acuity level definition of InfoKids+ (Supplemental Table 1, available online at https://www.mcpdigitalhealth.org).
Results
Participants
In total, 2683 caregivers were asked to participate whereof 656 (25%) did not give informed consent. However, the core demographic characteristics of this group did not significantly differ from those included (Supplemental Table 2, available online at https://www.mcpdigitalhealth.org). Two (<0.1%) were excluded as their children were older than 16 years, and 35 (<0.1%) because they did not provide enough information to derive an acuity level by InfoKids+. In total, we included 1990 patients from June 3, 2020 through January 31, 2022 (Figure 2).Figure 2. Participant progression. The primary reasons for declining informed consent were as follows (in descending order): personal preference against participation; language barrier; caregiver fatigue; excessive time commitment; inability to provide informed consent; and previous participation (ie, multiple pediatric emergency department visits).
The median patient age was 70 (IQR, 23-130) months, 18 months older compared with the general median age at the PED during the study period (52 [IQR, 21-107] months; P<.001) (Supplemental Table 2). Chronic illness was reported in 9%, and 83% reported they adhered to the Swiss vaccination schedule; 93% of children were born in Switzerland, as were 66% of mothers and fathers, respectively. Further, 49% of parents had a university or higher technical college degree (Table 1).Table 1. Basic Demographic Characteristics of the Study PopulationCore demographic characteristicValuesNA, n (%)Children (N=1990) Age (mo) Mean (95% CI)79.48 (76.94-82.02) SD (min, max)57.81 (0, 199) Median (IQR)70 (25-130) Age categories <1 mo9 (0.5) 1-11 mo208 (10.5) 12-23 mo236 (11.9) 2-5 y550 (27.6) 6-11 y598 (30.1) 12-16 y389 (19.5) Sex Female923 (46.4) Male1067 (53.6) Birth country Switzerland1846 (92.8) Abroad134 (6.7) European55 (2.8) Non-European79 (4.0) Unknown10 (0.5) Chronic illness present (n=1983)a7 (0.4) No1803 (90.9) Yes180 (9.1) Allergy present (n=1982)a8 (0.4) No1733 (87.4) Yes249 (12.6) Food allergy64 (25.7) Medication allergy32 (12.9) Other160 (64.3) Vaccination status (n=1981)a9 (0.5) Fully vaccinated as per the Swiss vaccination plan1641 (82.8) Partially vaccinated196 (9.9) HiB56 (28.6) PCV58 (29.6) Measles93 (47.5) Tetanus123 (62.8) Not at all vaccinated112 (5.7) I do not know32 (1.6) Time of presentation Mean (95% CI)13:47 (13:38-13:56) SD (min, max)03:16 (00:22, 23:29) Median (IQR)13:43 (11:32-15:58) 06:00-17:591764 (88.6) 18:00-05:59226 (11.4)Caregivers (N=1990) Who filled in the eCRF Patient15 (0.8) Parents1846 (92.8) Mother1321 (66.4) Father525 (26.4) Family98 (4.9) Mother-in-law or father-in-law6 (0.3) Grandparent16 (0.8) Aunt or uncle5 (0.3) Sibling71 (3.6) Other22 (1.1) Nanny or babysitter3 (0.2) Friend4 (0.2) Other15 (0.8) Unknown9 (0.5) Birth country of mother (n=1528)a462 (23.2) Switzerland1016 (66.5) Abroad484 (31.7) I do not know or do not want to answer28 (1.8) Birth country of father (n=1513)a477 (24.0) Switzerland999 (66.0) Abroad478 (31.6) I do not know or do not want to answer36 (2.4) Education of the mother (n=1514)a476 (23.9) Did not go to school9 (0.6) Mandatory education120 (7.9) Apprenticeship584 (38.6) Higher technical or commercial college94 (6.2) University614 (40.6) I do not know or do not want to answer93 (6.1) Education of the father (n=722)a1268 (63.7) Did not go to school5 (0.7) Mandatory education40 (5.5) Apprenticeship243 (33.7) Higher technical or commercial college72 (10.0) University311 (43.1) I do not know or do not want to answer51 (7.1) Difficulty paying bills (n=1305)a685 (34.4) No1119 (85.8) Yes97 (7.4) I do not know or do not want to answer89 (6.8) Financial situation compared with others (n=1299)a691 (34.7) Above average322 (24.8) Average706 (54.4) Below average103 (7.9) I do not know or do not want to answer168 (12.9)Values are n (%) unless specified.eCRF, electronic case report form; NA, not applicable.aVoluntary question.
Approximately 86% expressed no difficulty paying their household bills, and 79% perceived their financial status as average or above compared with other Swiss families. In total, 1764 visits (89%) occurred between 6 am and 6 pm (Table 1); 41% of children in our study were assigned an ATS score of ≤3, which was significantly more compared with 30% of all PED cases during the study period (P<.001) (Supplemental Table 2).
Agreement and Alignment
Table 2 shows the level of agreement and alignment between InfoKids+ and the nbTS. We observed a slight level of agreement (κ_lw_=0.08; 95% CI, 0.06-0.10). InfoKids+ generally assigned higher acuity levels: 1762 (89%) as urgent (<4 hours), 106 (5%) as nonurgent (≤24 hours), and 122 (6%) as no emergency (≥24 hours), compared with 810 (41%), 843 (42%), and 337 (17%) by the nbTS, respectively (P<.001). Notably, InfoKids+ missed 29 (1%) urgent (<4 hours) cases, triaging them as no emergency (≥24 hours) (Table 2). InfoKids+’ acuity level aligned with the reference standard in 888 (45%) cases, whereas it overreferred and underreferred 999 (50%) and 103 (5%) cases, respectively (P<.001) (Table 2).Table 2. Agreement and AlignmentReference standardUrgent (<4 h)Nonurgent (<24 h)No emergency (≥24 h)Total3 × 3 crosstabulation of agreement Index test Urgent (<4 h)771 (38.7)691 (34.7)300 (15.1)1762 (88.5) Nonurgent (<24 h)10 (0.5)88 (4.4)8 (0.4)106 (5.3) No emergency (≥24 h)29 (1.4)64 (3.2)29 (1.5)122 (6.1) Total810 (40.7)843 (42.4)337 (16.9)1990 (100.0) χ^2^95.398 P<.001 κ_lw_a (95%CI)0.080 (0.057-0.102)3 × 3 crosstabulation of alignment Alignment of index test Aligned771 (38.7)88 (4.4)29 (1.5)888 (44.6) Overreferred0 (0.0)691 (34.7)308 (15.5)999 (50.2) Underreferred39 (2.0)64 (3.2)0 (0.0)103 (5.2) Total810 (40.7)843 (42.4)337 (16.9)1990 (100.0) χ^2^1.50 × 10^3^ P<.001Values are n (%).aLinear-weighted κ with the following levels of agreement: <0, no agreement; 0.00-0.20, slight agreement; 0.21-0.40, fair agreement; 0.41-0.60, moderate agreement; 0.61-0.80, substantial agreement; >0.81, almost perfect agreement.
Subgroup Analysis
Table 3 summarizes the alignment rates of the chief complaint, symptom groups, and sociodemographic characteristics between InfoKids+ and the nbTS; 1108 (56%) participants prompted a medical chief complaint being the reason for their visit (mainly gastrointestinal symptoms and fever). A surgical chief complaint, primarily fractures or injuries, accounted for 882 (44%) visits.Table 3. Alignment by Chief Complaint, Symptom Group, and Sociodemographic CharacteristicsCharacteristicTotal (N=1990), n (%)Missing, n (%)Aligned (n=888), n (%)Overreferred (n=999), n (%)Underreferred (n=103), n (%)χ^2^POverall alignment per group compared with allChief complaints Medical chief complainta1108 (55.7)NA549 (49.5)530 (47.8)29 (2.6)48.000<.001**↑** Musculoskeletal symptoms60 (3.0)NA13 (21.7)41 (68.3)6 (10.0)14.140.001**↓** Diabetes (pees and drinks a lot)13 (0.7)NA6 (46.2)7 (53.8)0 (0.0)0.719.70— ORL symptoms (including ophthalmologic symptoms)156 (7.8)NA63 (40.4)93 (59.6)0 (0.0)12.431.002**←→** Gastrointestinal symptoms374 (18.8)NA167 (44.7)205 (54.8)2 (0.5)21.118<.001**←→** Psychiatric symptoms16 (0.8)NA12 (75.0)4 (25.0)0 (0.0)6.211.05**↑** Fever359 (18.0)NA176 (49.0)178 (49.6)5 (1.4)14.047.001**←→** Headache131 (6.6)NA59 (45.0)72 (55.0)0 (0.0)7.897.02**←→** Malaise or convulsion (including loss of consciousness)126 (6.3)NA92 (73.0)34 (27.0)0 (0.0)45.708<.001**↑** Dermatologic symptoms80 (4.0)NA38 (47.5)40 (50.0)2 (2.5)1.308.52— Cough or difficulty breathing225 (11.3)NA142 (63.1)83 (36.9)0 (0.0)41.517<.001**↑** Urogenital symptoms70 (3.5)NA27 (38.6)34 (48.6)9 (12.9)8.904.01**←→** Something else155 (7.8)NA85 (54.8)61 (39.4)9 (5.8)7.999.02**↑** COVID test27 (1.4)NA11 (40.7)16 (59.3)0 (0.0)1.957.38—Surgical complainta882 (44.3)NA339 (38.4)469 (53.2)74 (8.4)48.000<.001**↓** Ingestion31 (1.6)NA25 (80.6)6 (19.4)0 (0.0)16.756<.001**↑** Burn13 (0.7)NA3 (23.1)10 (76.9)0 (0.0)3.900.14— Cut injury63 (3.2)NA14 (22.2)46 (73.0)3 (4.8)14.084.001**↓** Injured tooth20 (1.0)NA8 (40.0)11 (55.0)1 (5.0)0.191.91— Electric shock2 (0.1)NA1 (50.0)1 (50.0)0 (0.0)0.117.94— Bite wounds10 (0.5)NA2 (20.0)8 (80.0)0 (0.0)3.664.16— Sting7 (0.4)NA1 (14.3)6 (85.7)0 (0.0)3.577.17— Fracture or injury625 (31.4)NA236 (37.8)342 (54.7)47 (7.5)22.998<.001**↓** Something else178 (8.9)NA74 (41.6)77 (43.3)27 (15.2)39.998<.001**←→Demographic characteristic Age under 5 y1003 (50.4)NA480 (47.9)483 (48.2)40 (4.0)11.936.003↑** Female938 (47.1)NA435 (46.4)462 (49.3)41 (4.4)3.759.15— Child born abroad134 (6.8)10 (0.5)49 (36.6)80 (59.7)5 (3.7)5.237.07— Mother born abroad484 (32.3)490 (24.6)185 (38.2)281 (58.1)18 (3.7)15.574<.001**↓** Father born abroad478 (32.4)513 (25.8)179 (37.4)276 (57.7)23 (4.8)13.708.001**↓** One parent born abroad645 (43.5)506 (25.4)247 (38.3)371 (57.5)27 (4.2)19.147<.001**↓** Both parents born abroad317 (21.2)497 (25.0)117 (36.9)186 (58.7)14 (4.4)10.604.005**↓** Chronic disease present180 (9.1)7 (0.4)111 (61.7)56 (31.1)13 (7.2)28.785<.001**↑** Allergy present249 (12.6)8 (0.4)127 (51.0)107 (43.0)15 (6.0)5.958.05— Fully vaccinated1641 (84.2)41 (2.1)713 (43.4)841 (51.2)87 (5.3)4.989.08— Visit during office hours1764 (88.6)NA780 (44.2)889 (50.4)95 (5.4)2.009.37— Parent filled in the eCRF1846 (93.2)9 (0.5)826 (44.7)923 (50.0)97 (5.3)0.875.65— Mother with only mandatory education or no school129 (9.1)569 (28.6)47 (36.4)78 (60.5)4 (3.1)5.648.06— Father with only mandatory education or no school45 (6.7)1319 (66.3)18 (40.0)26 (57.8)1 (2.2)1.865.39— One parent with only mandatory education or no school151 (20.0)1236 (62.1)57 (37.7)89 (58.9)5 (3.3)4.943.08— Both parents with only mandatory education or no school23 (1.7)652 (32.8)8 (34.8)15 (65.2)0 (0.0)2.805.25— Mother with university degree614 (43.2)569 (28.6)261 (42.5)317 (51.6)36 (5.9)1.050.59— Father with university degree311 (46.3)1319 (66.3)127 (40.8)161 (51.8)23 (7.4)1.492.47— One parent with university degree711 (73.8)1027 (51.6)304 (42.8)367 (51.6)40 (5.6)0.085.96— Both parents with university degree214 (19.0)861 (43.3)84 (39.3)111 (51.9)19 (8.9)5.613.06— Difficulty paying household bills97 (8.0)774 (38.9)43 (44.3)53 (54.6)2 (2.1)2.596.27— Financial situation below average103 (9.1)859 (43.2)39 (37.9)60 (58.3)4 (3.9)2.583.28—Only if P (χ2) was statistically significant:
- •↑: The alignment was statistically significant better for this group compared with all cases.
- •↓: The alignment was statistically significant worse for this group compared with all cases.
- •←→: There is no statistical significance concerning general alignment, but concerning the rate of overreferrals or underreferrals. eCRF, electronic case report form; NA, not applicable.aAlthough the question between medical and surgical chief complaint was a single-choice question, the individual symptom groups per chief complaint (medical or surgical) were part of a multiple choice question.
Within the chief complaint, participants could choose multiple symptom groups. In average, participants chose 1.6 symptom groups per medical and 1.1 symptom groups per surgical chief complaint visit. Further, 333 (17%) participants chose the symptom group “something else”: 155 (14%) within the medical and 178 (20%) within the surgical chief complaint (Table 3). However, 152 (98%) other symptoms within the medical and 168 (94%) within the surgical chief complaint could be attributed to one of the existing symptom groups (Supplemental Table 3, available online at https://www.mcpdigitalhealth.org).
Chief Complaint and Symptom Groups
The medical chief complaint showed a higher alignment rate (50%; P<.001) than the surgical chief complaint (38%, P<.001). Notable symptom groups within the medical chief complaint with high alignment rates were psychiatric symptoms (75%; P=.01), malaise or convulsion (73%; P<.001), and cough or difficulty breathing (63%; P<.001). Musculoskeletal symptoms were the only medical symptom group associated with a significantly worse alignment rate (22%; P=.001) (Table 3).
Surgical symptom groups with low alignment rates included cut injuries (22%; P=.001) and fracture or injury (38%; P<.001). Ingestion was the only surgical symptom group associated with a significantly better alignment rate (81%; P<.001) (Table 3).
Symptom groups with high alignment rates had significantly higher rates of urgent (<4 hours) triages by the nbTS compared with all cases: 75% (P=.005) for psychiatric symptoms, 72% (P<.001) for malaise or convulsion, 63% (P<.001) for cough or difficulty breathing, and 81% (P<.001) for ingestion. In contrast, symptom groups with low alignment rates had significantly lower rates of urgent (<4 hours) nbTS triages: 25% (P=.01) for musculoskeletal symptoms, 19% (P<.001) for cut injuries, and 25% (P<.001) for fracture or injury (Supplemental Table 4, available online at https://www.mcpdigitalhealth.org).
Sociodemographic Characteristics
Sociodemographic characteristics associated with significantly higher alignment rates were age <5 years (48%; P=.003) and having chronic diseases (62%; P<.001), whereas foreign-born parents (38% [P<.001] for 1 and 37% [P=.005] for both parents born abroad) were associated with lower alignment rates (Table 3).
Safety and Data Usage
We observed no adverse events from the index test or the reference standard. The PED team did not use the index test results in the diagnostic process, remaining accessible solely to the study team.
Discussion
Main Findings
Our study assessed the performance of InfoKids+, a pediatric eRSA, in determining acuity levels against nbTS. Our findings highlight the need for rigorous validation of such tools because InfoKids+ exhibited a poor performance, aligning in only 45% of cases with the reference standard. Compared with the reference standard, InfoKids+ exhibited a higher rate of triaging cases as urgent (<4 hours; 41% vs 89%), contributing to a 50% overreferral rate. Underreferrals by InfoKids+ were infrequent, yet they did occur. Although a low rate of underreferrals is typically desired in an online triage tool, it remains uncertain whether such a tool would effectively reduce, or conversely exacerbate, the number of unnecessary PED visits. As shown in another study, tools like InfoKids+ primarily reassure parents that seeking professional care is unnecessary, raising concerns that they may also unintentionally encourage unnecessary PED visits.14
InfoKids+ tended to overrefer cases, which was likely primarily due to its conservative algorithm design: clinical findings often found with common PED symptoms (eg, pain and bad general appearance) automatically led to an urgent (<4 hours) triage by InfoKids+ (Supplemental Figure 1). This, however, was intended when designing the eRSA to avoid missing any critical patients and to maximize patient safety.10 Altering the acuity level definition of InfoKids+ regarding these clinical signs led to a shift of cases between acuity levels, however not influencing the level of agreement (Supplemental Table 1). Notably, InfoKids+ did not collect any vital signs except for the self-measured temperature, therefore lacking objective parameters to help assess the acuity level. Additionally, the more holistic assessment by a triage nurse, which takes into account various dimensions of a child’s condition beyond just symptom constellations, also contributed to this phenomenon.
Although instances of undertriage were rare, they still pose a notable safety concern for tools like InfoKids+, necessitating vigilant monitoring and rectification before their routine deployment.9 A detailed analysis found that the critical underreferrals in this study could mainly be attributed to eRSA logic errors, participants providing inaccurate information, or comprehension errors by participants.15 These critical aspects need to be thoroughly addressed before considering the routine implementation of such tools.
Across the different symptom groups, only a few reported markedly better alignment rates with the nbTS, notably in nontraumatic symptom groups. This corresponds to the findings from a similar triage tool where the assessment of nontrauma symptoms was more effective compared with surgical symptoms.16 However, in our study, the alignment rates for medical symptom groups still varied greatly ranging from 22% to 75%. Within the symptom groups with significantly higher alignment rates, both InfoKids+ and the nbTS had higher rates of urgent (<4 hours) triages (Supplemental Table 4). One reason for the better performance of medical symptom groups could be explained by the eRSA being more cautious regarding signs often witnessed with medical chief concerns (eg, bad general appearance) (Supplemental Figure 1). However, the tool performed poorly in triaging surgical symptom groups, coinciding with the relatively low rates of urgent (<4 hours) triages by the reference standard compared with InfoKids+ (Supplemental Table 4).
The 22 symptom groups that were adopted from the InfoKids application into the InfoKids+ eRSA covered for most of the symptoms reported, with less than 1% of participants describing a nonattributable symptom (Supplemental Table 3). The allocation into medical and surgical chief complaint, however, might have led to some confusion, because laypersons may struggle to differentiate their child’s symptoms into one of these categories.
Sociodemographic factors, particularly age, chronic diseases, and parental birthplace, considerably influenced triage alignment. Foreign-born parents achieved a lower alignment rate, although our tool was available in 3 languages (German, French and English). Nevertheless, language barriers might have led to miscommunication and thus a reduced quality of healthcare, or, in our case, acuity level alignment, as a systematic review found.17 Further, a Swiss study found that patients from other nationalities had a higher proportion of emergency department consultations although having fewer measures of severity.18 This suggests that the cultural background might influence the perception of symptoms and thus influence the acuity level of such tools. InfoKids+ triage aligned notably better in children with chronic diseases, suggesting that parents of these children might have better health literacy. In addition, InfoKids+ triage aligned better in younger children, which can be explained by the eRSA, just like the ATS, being more cautious regarding younger patients.10^,^13
Strengths and Limitations
The study’s strengths lay in being the first robust validation study against a nbTS for a pediatric acuity eRSA to guide PED use. It offers in-depth insights into decision patterns, facilitating marked enhancements to the tool before considering routine implementation. Additionally, our study’s focus on demographic factors has unveiled their critical impact on the performance of eRSAs. High participant consent rates indicated strong acceptability of decision support tools.
However, our study faced some limitations. Notably it included only participants already present at the PED, thereby skewing our sample toward more concerned parents, resulting in a potential confirmation bias. Further limitations include a potential selection bias owing to its single-location setting and a tendency to include more cases with an ATS score of ≤3, as well as a considerably older population. This deviation from the baseline population is explained by the fact that the study team tried to include as many cases as possible into each symptom group to allow for a broader validation. However, some symptom groups included only a small sample size, limiting meaningful interpretation. Furthermore, a quarter of approached individuals declined participation, primarily owing to personal preference against participation (Figure 2). Despite similar core demographic characteristics with the participants, limited data under nonconsent prevented assessing potential sources of bias (Supplemental Table 2).
Data collection mainly took place during the COVID-19 pandemic in Switzerland, possibly altering the PED population compared with that before COVID. Moreover, the proportion of well-educated parents (ie, university or higher technical college degree) was higher than in the general Swiss population (49% vs 30%).19 The lack of a follow-up questionnaire in our study limited our ability to evaluate the tool’s effectiveness beyond providing acuity level guidance. Specifically, we were unable to determine the tool’s influence on reducing PED consultations. Additionally, we did not explore additional soft factors (eg, parental stress) on InfoKids+’ use, which are known to contribute to PED use.20 Currently, there is no consensus on what constitutes urgent, nonurgent, and no emergency, and we based our index and reference definitions on logical considerations related to disease severity and availability of services.21 However, changing cutoffs for both the index test and reference standard might markedly change the performance metrics of InfoKids+ (Figure 1; Supplemental Table 1).
Comparison With Previous Research
Our findings align with previous studies on online triage tools. However, the comparison with previous literature is notably limited by the fact that we assessed the performance among patients, rather than theoretical clinical vignettes.4^,^16^,^22, 23, 24, 25, 26, 27, 28 The overreferral tendency observed with InfoKids+ aligns with the risk-averse nature of such tools reported in other studies.4^,^22 Previous studies also highlighted the importance of sociodemographic factors, such as age and education level, on the usage and performance of e-health tools.29
Potential of Artificial Intelligence
Data-driven and continuous learning approaches such as machine learning and foundational models provide an opportunity to refine rule-based tools like InfoKids+ and incorporate performance feedback. For instance, a deep learning approach could consider more complex combinations of inputs to make finer-grained predictions better adapting to the differences uncovered by the subgroup analysis. Nonetheless, accuracy is vital in emergency triage, and, thus, it is essential to not only build the model on a trusted data source but also integrate it into a responsive framework that allows continuous adaptation and validation.7^,^30
Conclusion
In summary, our study on the pediatric eRSA InfoKids+ uncovered notable discrepancies between its algorithmic triage and conventional nurse-based triage, alongside considerable variability in performance across different symptom categories. This finding is particularly striking given that InfoKids+ was designed on the basis of an established parental guidance application. Our results highlight the critical need for rigorous validation of such tools for accuracy and safety before public release, especially with the rise of artificial intelligence. We also observed a marked influence of sociodemographic factors on performance, emphasizing the importance of considering a user-centered design of such tools. Although InfoKids+ reported promise in facilitating patient pretriage during high-demand periods in PEDs, it is essential to conduct a thorough evaluation to ensure these tools do not inadvertently cause harm or resource misallocation.
Potential Competing Interests
The authors report no competing interests.
Ethics Statement
This study was approved by the Cantonal Research Ethics Committee of the Canton of Bern (project number 2019–02280) and was registered in the Registry of all Projects in Switzerland (RAPS). This study was conducted in accordance with the ethical standards of the Ethics Committee and with the principles of the Declaration of Helsinki.
The reference list from the paper itself. Each links out to its DOI / PubMed record.
- 1Vilpert S.[Consultations in Swiss Emergency Departments]Obsan Bull March 2013
- 2Jaboyedoff M.Starvaggi C.Suris J.C.Characteristics of low-acuity paediatric emergency department consultations in two tertiary hospitals in Switzerland: a retrospective observational study BMJ Paediatr Open 512021 e 00126710.1136/bmjpo-2021-001267 PMC 863401934901472 · doi ↗ · pubmed ↗
- 3Lupton D.Jutel A.‘It’s like having a physician in your pocket!’ A critical analysis of self-diagnosis smartphone apps Soc Sci Med 133201512813510.1016/j.socscimed.2015.04.00425864149 · doi ↗ · pubmed ↗
- 4Semigran H.L.Linder J.A.Gidengil C.Mehrotra A.Evaluation of symptom checkers for self diagnosis and triage: audit study BMJ 3512015 h 348010.1136/bmj.h 3480 PMC 449678626157077 · doi ↗ · pubmed ↗
- 5Keitel K.D’Acremont V.Electronic clinical decision algorithms for the integrated primary care management of febrile children in low-resource settings: review of existing tools Clin Microbiol Infect 248201884585510.1016/j.cmi.2018.04.01429684634 · doi ↗ · pubmed ↗
- 6European Union Lex 117. Official Journal of the European Union 2017 European Union
- 7Quinn T.P.Jacobs S.Senadeera M.Le V.Coghlan S.The three ghosts of medical AI: Can the black-box present deliver?Artif Intell Med 124202210215810.1016/j.artmed.2021.10215834511267 · doi ↗ · pubmed ↗
- 8Ehrler F.Lovis C.Rochat J.[Info Kids: changing the patients' journey paradigm in an Emergency Department]Rev Med Suisse 1461720181538154230226668 · pubmed ↗