Correction: Modulation of lung CD11b+ dendritic cells by acupuncture alleviates Th2 airway inflammation in allergic asthma
Mi Cheng, Pan-Pan Shang, Dan-Dan Wei, Jie Long, Xue Zhang, Quan-Long Wu, Gabriel Shimizu Bassi, Yu Wang, Yan-Jiao Chen, Lei-Miao Yin, Yong-Qing Yang, Yu-Dong Xu

Abstract
Genes, proteins, chemicals, diseases, species, mutations and cell lines named across the full text — each resolved to its canonical identifier and authoritative record.
Click any figure to enlarge with its caption.
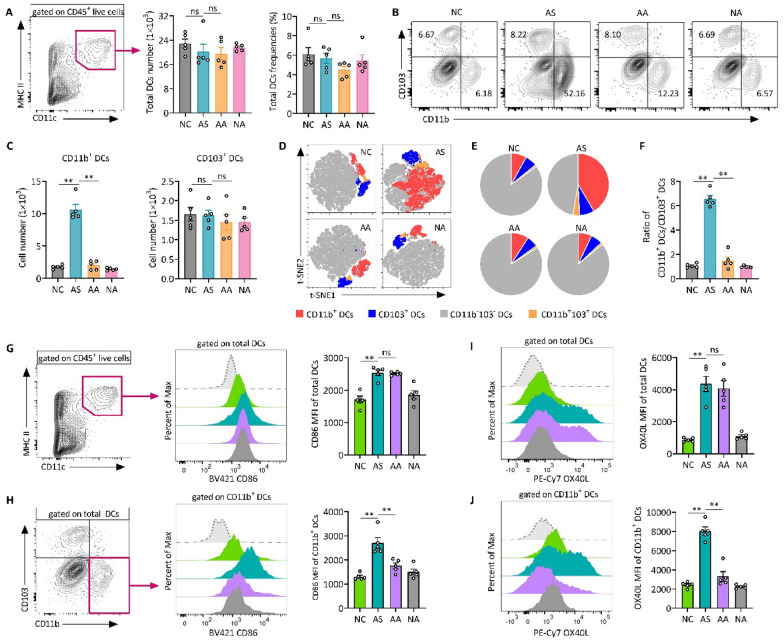 Figure 5
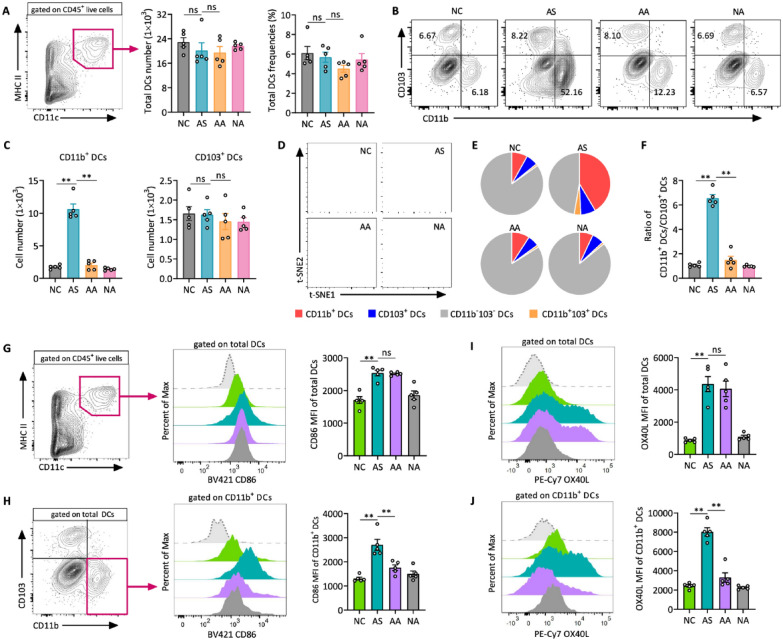 Figure 2
Peer Reviews
No public reviews on file for this paper yet. If you reviewed it on a platform where reviews are public (OpenReview, ICLR, NeurIPS, ICML), you can paste yours below so the community can read it here.
Videos
No videos yet. Explain this paper in a talk, walkthrough, or lecture? Add one.
Taxonomy
TopicsAcupuncture Treatment Research Studies
**Correction: Chinese Medicine (2025) 20:67 ** 10.1186/s13020-025-01119-9
Following publication of the original article [1], the authors identified an error in the layout of Fig. 5D, the actual t-SNE plot that should display the distribution of Lung DCs is missing and appears blank.
The correct Fig. 5 has been provided in this Correction.
The incorrect Fig. 5 is:Fig. 5. Acupuncture treatment reduces both the population and immune activation of lung CD11b⁺ DCs in allergic asthma. A Gating strategy for identifying total DCs from CD45^+^ live cells, along with the analysis of total DC numbers and frequencies. B Representative flow cytometry plots showing lung CD11b^+^CD103^−^ and CD11b−CD103+ DC subsets (gated on live CD45^+^CD11c^+^MHC II^+^ cells), and C quantitative analysis of CD11b⁺ and CD103⁺ DC subsets. D t-distributed stochastic neighbor embedding (t-SNE) plot illustrating the distribution of total lung DCs based on flow cytometry analysis. Cells are colored according to the four identified clusters. E Pie chart representation of DC subset composition in lungs.** F** Ratio of CD11b^+^ DCs to CD103^+^ DCs in the lung tissues. G Flow cytometry analysis of CD86 expression on total DCs, with representative histograms and MFI quantification. H Flow cytometry analysis of CD86 expression specifically on CD11b^+^ DCs, including representative histograms and MFI quantification. I,** J** Flow cytometry overlay histogram and MFI analysis of OX40L expression on total DCs (I) and CD11b^+^ DCs (J). Data are presented as means ± SEM; n = 5 mice/group; ns, not significant; *P < 0.05, **P < 0.01 as indicated
The correct Fig. 5 is:Fig. 5. Acupuncture treatment reduces both the population and immune activation of lung CD11b⁺ DCs in allergic asthma. A Gating strategy for identifying total DCs from CD45^+^ live cells, along with the analysis of total DC numbers and frequencies. B Representative flow cytometry plots showing lung CD11b^+^CD103^−^ and CD11b^−^CD103^+^ DC subsets (gated on live CD45^+^CD11c^+^MHC II^+^ cells), and C quantitative analysis of CD11b⁺ and CD103⁺ DC subsets. D t-distributed stochastic neighbor embedding (t-SNE) plot illustrating the distribution of total lung DCs based on flow cytometry analysis. Cells are colored according to the four identified clusters. E Pie chart representation of DC subset composition in lungs. F Ratio of CD11b^+^ DCs to CD103^+^ DCs in the lung tissues. G Flow cytometry analysis of CD86 expression on total DCs, with representative histograms and MFI quantification. H Flow cytometry analysis of CD86 expression specifically on CD11b^+^ DCs, including representative histograms and MFI quantification. I,** J** Flow cytometry overlay histogram and MFI analysis of OX40L expression on total DCs (I) and CD11b^+^ DCs (J). Data are presented as means ± SEM; n = 5 mice/group; ns, not significant; *P < 0.05, **P < 0.01 as indicated
The original article [1] has been corrected.