Cancer risk in individuals with psychiatric disorders: population-based cohort study
Tak Kyu Oh, Hye Yoon Park, In-Ae Song

TL;DR
People with psychiatric disorders are more likely to develop cancer, with alcohol-related disorders, anxiety, and depression showing strong links.
Contribution
This study identifies specific psychiatric disorders associated with increased cancer risk in a large population-based cohort.
Findings
Psychiatric disorder group had a 23% higher cancer risk compared to controls.
Alcohol-related disorders, anxiety, and major depressive disorder showed significant cancer risk associations.
Cancer incidence was 15.4% in the psychiatric group versus 12.8% in the non-psychiatric group.
Abstract
The risk of cancers associated with psychiatric disorders is understudied. To investigate whether cancer risk varies with the presence of psychiatric disorders. Patients diagnosed with psychiatric disorders in South Korea between 1 January and 31 December 2017 were included in the study and referred to as the psychiatric disorder group. The non-psychiatric-disorder group, selected using a stratified random sampling technique based on age and gender, comprised individuals who had never been diagnosed with a psychiatric disorder. The primary outcome was a new cancer diagnosis, assessed over a 5-year period (1 January 2018 to 31 December 2022). Following 1:1 propensity score matching, the final analysis included data for 686 570 adults (343 285 in each group). The cancer incidence in the psychiatric disorder group from 2018 to 2022 was 15.4% (52 948/343 285), whereas in the…
Genes, proteins, chemicals, diseases, species, mutations and cell lines named across the full text — each resolved to its canonical identifier and authoritative record.
Click any figure to enlarge with its caption.
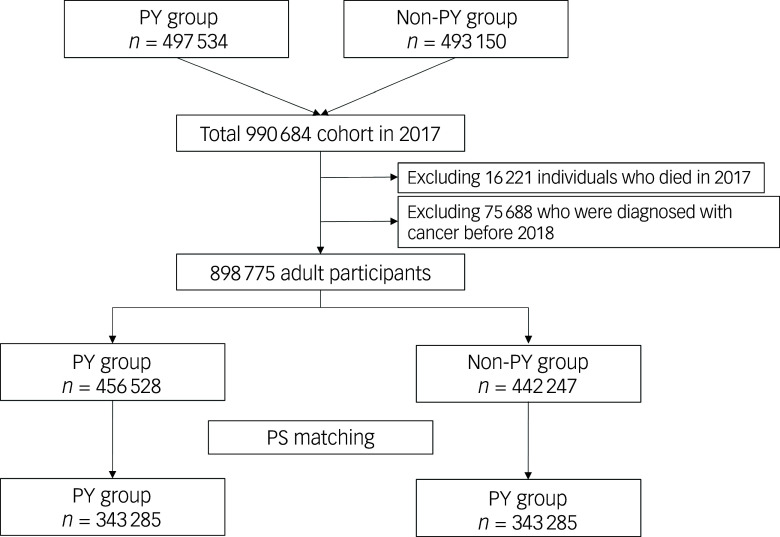 Figure 1
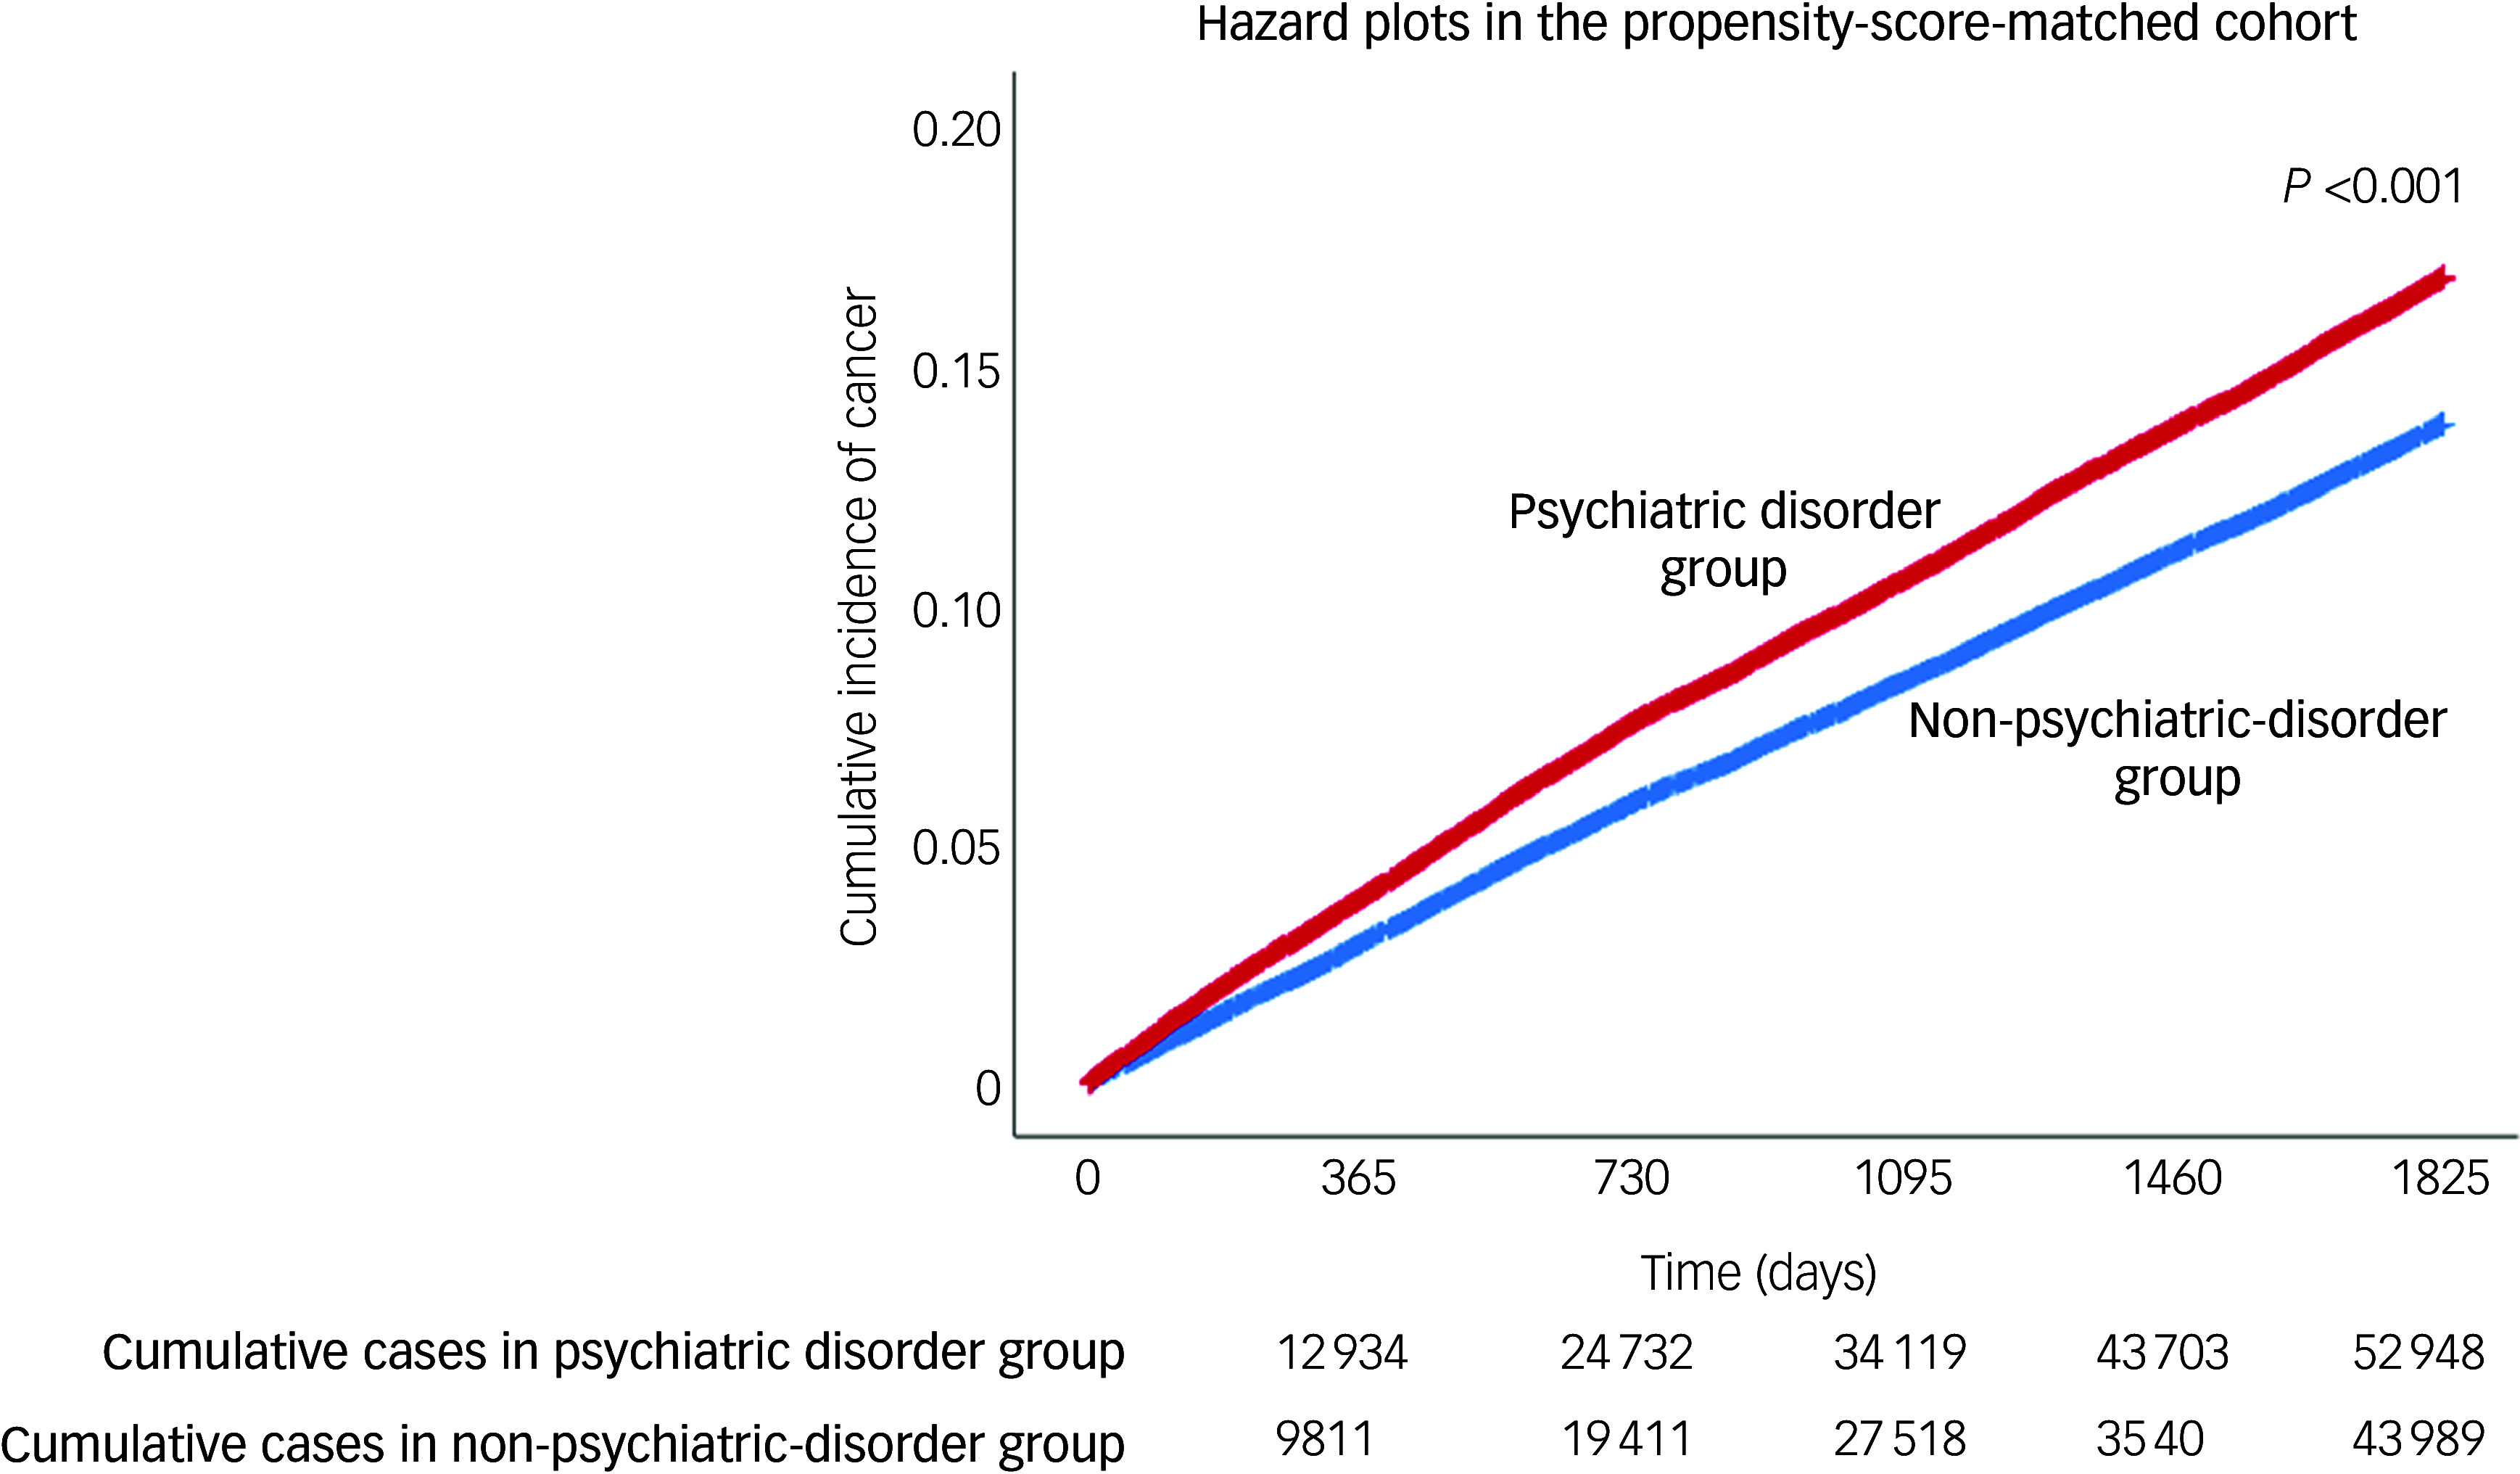 Figure 2
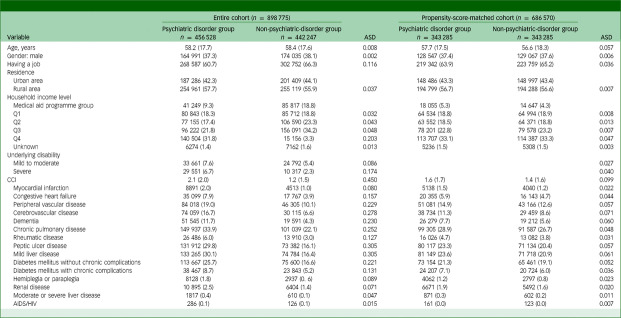 Figure 3
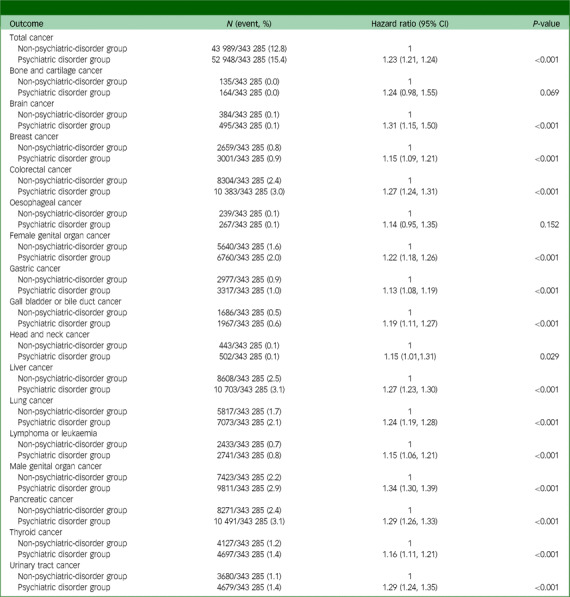 Figure 4
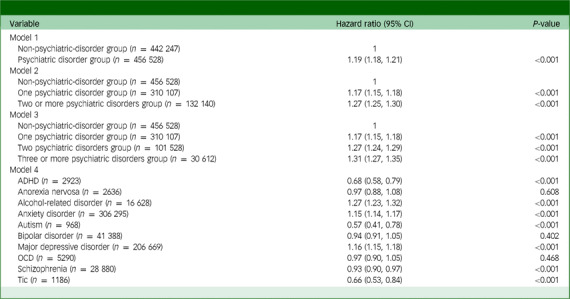 Figure 5
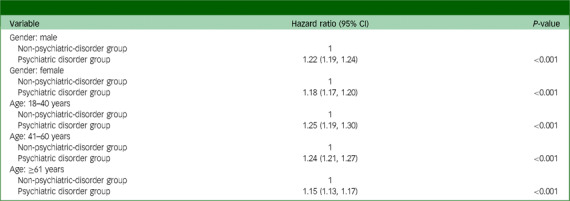 Figure 6
Peer Reviews
No public reviews on file for this paper yet. If you reviewed it on a platform where reviews are public (OpenReview, ICLR, NeurIPS, ICML), you can paste yours below so the community can read it here.
Videos
No videos yet. Explain this paper in a talk, walkthrough, or lecture? Add one.
Taxonomy
TopicsChildhood Cancer Survivors' Quality of Life · Bipolar Disorder and Treatment · Family Support in Illness
Cancer represents the primary cause of death globally.^ 1 ^ Between 2006 and 2016, 17.2 million individuals were diagnosed with cancer, resulting in 8.9 million fatalities and representing a 28% increase in the total number of cancer cases.^ 2 ^ The number of new cancer cases per population is expected to gradually increase; therefore, it is important to implement prevention efforts to lessen the worldwide disease burden.^ 3 ^ Psychiatric morbidities are also prevalent in the general population,^ 4 ^ and a substantial body of literature indicates higher mortality rates among individuals with various types of psychiatric condition.^ 5 ^ The relationships observed between psychiatric disorders and cancer occurrence are variable, with cancer rates among individuals with psychiatric conditions reported to be higher, comparable with or lower than those in the general population.^ 6,7 ^ However, the choice of analytical approach significantly influences the observed relationship between psychiatric disorders and cancer occurrence, and this relationship is complex and varies over time.^ 8 ^
In previous studies, researchers have examined the risk of cancer development in patients with specific psychiatric conditions compared with those without such conditions.^ 6,7,9,10 ^ Nonetheless, it is important to consider that multiple psychiatric disorders frequently occur concurrently,^ 11 ^ and this may influence a patient’s risk of developing cancer. Furthermore, analysis of cancer risk in patients without mental illness necessitates more precise control groups and extended follow-up periods, aspects that previous studies have frequently overlooked.^ 6,7,9,10 ^ Consequently, there is an ongoing need for methodologically robust research on this subject. In the present study, we investigated the associations between underlying psychiatric morbidities and cancer incidence using a nationwide database in South Korea.
Method
Experimental design and ethical considerations
This retrospective population-based cohort study adhered to the Strengthening the Reporting of Observational Studies in Epidemiology (STROBE) guidelines.^ 12 ^ The authors state that all procedures used in this study were in accordance with the ethical requirements of the appropriate national and institutional human experimentation committees, as well as the Helsinki Declaration of 1975, as revised in 2013. Our institutional review board approved all procedures involving human participants and patients (approval number: X-2303-819-902). The Big Data Center of the National Health Insurance Service (NHIS) (NHIS-2023-1-526) authorised access to the data, including sharing rights. As the data were anonymised and the study was retrospective, it was not necessary to obtain informed consent from patients.
NHIS database
This study used data sourced from the NHIS, a public insurance programme in South Korea. The NHIS database, as required by law, includes detailed records of all disease diagnoses and associated prescription information for treatments and medications. To be eligible for government-funded health insurance programmes, individuals must enrol in the NHIS, and all diagnoses are reported and categorised on the basis of the ICD-10. Individuals residing in South Korea for more than 6 months must complete their registration with the NHIS. Furthermore, the NHIS database offers precise information about socioeconomic status and date of death.^ 13 ^
Study population
Data were initially obtained from the NHIS concerning adult patients (≥18 years old) diagnosed with psychiatric disorders and receiving treatment during the period from 1 January to 31 December 2017. The ICD-10 codes for the psychiatric disorders examined in this study are listed in Supplementary Table 1 available online at https://doi.org/10.1192/bjo.2025.783. Upon obtaining data indicating that the population exceeded 5 million, we requested a stratified 10% sample categorised by age and gender. In the present study, adults identified as having psychiatric disorders in 2017 were assigned to the psychiatric disorder group. Following identification of all individuals eligible for inclusion in this group in South Korea in 2017, we requested data for individuals who had never been diagnosed with psychiatric disorders, to form our non-psychiatric-disorder group. This was accomplished using a 1:1 stratified random sampling technique, considering both age and gender. Owing to tracking of cancer diagnoses from 2018 to 2022, individuals who died in 2017 were excluded from the study. Furthermore, individuals with a cancer diagnosis before 2018 were excluded, as the focus of the study was cancer cases diagnosed from 2018 onward.
Experimental endpoints
The primary study outcome was new cancer diagnoses, assessed over a 5-year period from 1 January 2018 to 31 December 2022. Cancer diagnoses were made using ICD-10 codes (C00–C96). Patients with cancer in South Korea are registered in the NHIS database, which includes the assignment of a specific code known as the C code (i.e. a cancer diagnosis), entitling such individuals to unique insurance benefits. The following cancers were uniquely categorised: gastric cancer (C16), oesophageal cancer (C15), colorectal cancers (C18–C20), gallbladder and biliary tract cancers (C23–C24), head and neck cancers (C00–C14), brain cancer (C71), liver cancer (C22), pancreatic cancer (C25), lung cancer (C34), bone and articular cartilage cancers (C40–C41), breast cancer (C50), female genital organ cancers (C51–C58), male genital organ cancers (C60–C63), urinary tract cancers (C64–C68), thyroid cancer (C73), and lymphoma and leukaemia (C81–C96).
Collected covariates
The primary demographic variables of the patients were age and gender. Socioeconomic status was determined on the basis of household income, residence and employment status (including self-employment). Residences were classified as urban (Seoul and other large cities) or rural (all other regions). Household income was divided into five groups, one of which comprised individuals engaged in a medical aid programme, whereas the remaining groups followed a four-quartile distribution. Individuals unable to afford insurance are classified by the government as eligible for medical assistance.
To evaluate the occurrence of comorbidities, the Charlson Comorbidity Index was constructed using the most frequently occuring ICD-10 codes from the NHIS database (Supplementary Table 2). In South Korea, people must declare any disability in the NHIS database in order to be eligible for social welfare benefits. Thus, information about underlying disabilities was also gathered. In South Korea, specialists in relevant professions conduct disability evaluations. A qualified physician assesses the impact of a condition on everyday life, and it is classified as mild to moderate or severe. Supplementary Table 3 provides the full classification of disabilities.
Statistical methodology
Continuous variables were assessed through calculation of means and standard deviations. Categorical variables are expressed in terms of percentages and absolute values. To reduce the variation in variables between the psychiatric disorder and non-psychiatric-disorder groups, we performed propensity score matching (a method to decrease bias in observational research^ 14 ^) via the nearest neighbour method, with a calliper width of 0.25 and a 1:1 ratio without replacement. In the propensity score modelling, age, gender, residence, household income level, underlying disability, Charlson Comorbidity Index and underlying diseases were included. Following propensity score matching, the absolute standardised mean difference (ASD) was used to determine the balance between the two groups. An ASD of less than 0.1 was considered to indicate proper propensity score matching.
Cox regression analysis was performed on the propensity-score-matched cohort to compare the frequency of newly diagnosed cancers between the psychiatric disorder and non-psychiatric-disorder groups. An event was defined as a cancer diagnosis made on or after 1 January 2018. Time was defined as the period between 1 January 2018 and the diagnosis. In addition, a time-lag analysis was performed in the propensity-score-matched cohort to determine whether psychiatric disorders preceded the cancer or were diagnosed in response to early symptoms. Herein, a cancer diagnosis made on or after 1 January 2019 was considered as an event. A hazard plot for cancer diagnoses in the propensity-score-matched cohort was constructed using Kaplan–Meier estimation, and the log-rank test was used to compare the cumulative incidence of total cancer diagnoses between the two groups.
A sensitivity analysis was performed using multivariable Cox regression modelling to compare the results for the propensity-score-matched group with those for the entire cohort. The model incorporated all covariates and was adjusted for several factors. To enhance our understanding of the risks associated with a cancer diagnosis, we conducted further multivariable Cox regression analyses to compare individuals diagnosed with two, three or more psychiatric conditions with those diagnosed with only one psychiatric disorder. Additional multivariable Cox regression analyses were performed to investigate whether the likelihood of a cancer diagnosis differed among groups with specific psychiatric disorders.
Subgroup analyses were conducted on the basis of gender and age. Log–log plots were used to verify adherence to the foundational assumptions of the Cox proportional hazards models. The results are presented as hazard ratios accompanied by 95% confidence intervals. The multivariable model demonstrated no multicollinearity among the variables, as indicated by a variance inflation factor of 2. For the statistical analyses, we used R version 4.0.3 for Windows (R Foundation for Statistical Computing, Vienna, Austria; see https://cran.r-project.org/bin/windows/base/old/4.0.3/), with the significance threshold set to P < 0.05. The ‘MatchIt’ and ‘survival’ R packages were used for propensity score matching and survival analyses, respectively. The Coxph and Surv(time, event) functions in the ‘survival’ package were used for the Cox hazard modelling.
Results
Study population
Figure 1 presents a flowchart representing the patient selection process. In 2017, 497 534 adults in the psychiatric disorder group were screened and compared with 493 150 individuals in the non-psychiatric-disorder group. After excluding 16 221 individuals who died in 2017 and 75 688 who were diagnosed with cancer before 2018, the study included 898 775 adult participants. After 1:1 propensity score matching, the final analysis included data of 686 570 adults (343 285 in each group). Table 1 displays the clinicopathological characteristics of patients in the psychiatric disorder and non-psychiatric-disorder groups before and after propensity score matching. All ASDs in the propensity-score-matched cohort were below 0.1, indicating a well balanced comparison between the two groups. Supplementary Fig. 1 illustrates the distributions of propensity scores before and after matching, showing that the distributions were comparable post-implementation.
Fig. 1. Flowchart illustrating the patient selection process for this study. PY, psychiatric disorder; PS, propensity score.
Table 1. Clinicopathological characteristics of patients in the psychiatric disorder and non-psychiatric-disorder groups before and after propensity score matchingVariableEntire cohort (n = 898 775)ASDPropensity-score-matched cohort (n = 686 570)ASDPsychiatric disorder group n = 456 528Non-psychiatric-disorder group n = 442 247Psychiatric disorder group n = 343 285Non-psychiatric-disorder group n = 343 285Age, years58.2 (17.7)58.4 (17.6)0.00857.7 (17.5)56.6 (18.3)0.057Gender: male164 991 (37.3)174 035 (38.1)0.002128 547 (37.4)129 067 (37.6)0.006Having a job268 587 (60.7)302 752 (66.3)0.116219 342 (63.9)223 759 (65.2)0.036Residence Urban area187 286 (42.3)201 409 (44.1)148 486 (43.3)148 997 (43.4) Rural area254 961 (57.7)255 119 (55.9)0.037194 799 (56.7)194 288 (56.6)0.007Household income level Medical aid programme group41 249 (9.3)85 817 (18.8)18 055 (5.3)14 647 (4.3) Q180 843 (18.3)85 712 (18.8)0.03264 534 (18.8)64 994 (18.9)0.008 Q277 155 (17.4)106 590 (23.3)0.04363 552 (18.5)64 371 (18.8)0.013 Q396 222 (21.8)156 091 (34.2)0.04878 201 (22.8)79 578 (23.2)0.007 Q4140 504 (31.8)15 156 (3.3)0.203113 707 (33.1)114 387 (33.3)0.047 Unknown6274 (1.4)7162 (1.6)0.0135236 (1.5)5308 (1.5)0.003Underlying disability Mild to moderate33 661 (7.6)24 792 (5.4)0.0860.027 Severe29 551 (6.7)10 317 (2.3)0.1740.040CCI2.1 (2.0)1.2 (1.5)0.4501.6 (1.7)1.4 (1.6)0.099 Myocardial infarction8891 (2.0)4513 (1.0)0.0805138 (1.5)4040 (1.2)0.022 Congestive heart failure35 099 (7.9)17 767 (3.9)0.15720 355 (5.9)16 143 (4.7)0.044 Peripheral vascular disease84 018 (19.0)46 305 (10.1)0.22951 081 (14.9)43 166 (12.6)0.057 Cerebrovascular disease74 059 (16.7)30 115 (6.6)0.27838 734 (11.3)29 459 (8.6)0.071 Dementia51 545 (11.7)19 591 (4.3)0.23026 279 (7.7)19 212 (5.6)0.060 Chronic pulmonary disease149 937 (33.9)101 039 (22.1)0.25299 305 (28.9)91 587 (26.7)0.048 Rheumatic disease26 486 (6.0)13 910 (3.0)0.12716 026 (4.7)13 082 (3.8)0.031 Peptic ulcer disease131 912 (29.8)73 382 (16.1)0.30580 117 (23.3)71 134 (20.4)0.057 Mild liver disease133 265 (30.1)74 784 (16.4)0.30581 149 (23.6)71 718 (20.9)0.061 Diabetes mellitus without chronic complications113 667 (25.7)75 600 (16.6)0.22173 154 (21.3)65 461 (19.1)0.052 Diabetes mellitus with chronic complications38 467 (8.7)23 843 (5.2)0.13124 207 (7.1)20 724 (6.0)0.036 Hemiplegia or paraplegia8128 (1.8)2937 (0. 6)0.0894062 (1.2)2797 (0.8)0.023 Renal disease10 895 (2.5)6404 (1.4)0.0716671 (1.9)5492 (1.6)0.020 Moderate or severe liver disease1817 (0.4)610 (0.1)0.047871 (0.3)602 (0.2)0.011 AIDS/HIV286 (0.1)126 (0.1)0.015161 (0.0)123 (0.0)0.007ASD, absolute standardised mean difference; CCI, Charlson comorbidity index; HIV, human immunodeficiency virus.
Analyses used in the propensity-score-matched cohort
Table 2 displays the results of the analysis for the propensity-score-matched cohort. After propensity score matching, the incidence of total cancer in the psychiatric disorder group during 2018–2022 was 15.4% (52 948/343 285), whereas that in the non-psychiatric-disorder group was 12.8% (43 989/343 285). In the Cox regression analysis, the psychiatric disorder group had a 23% (hazard ratio: 1.23, 95% CI: 1.21, 1.24; P < 0.001) higher incidence of total cancer than the non-psychiatric-disorder group. The psychiatric disorder group also exhibited increased incidence rates of brain cancer, breast cancer, colorectal cancer, female genital organ cancer, gastric cancer, gallbladder and biliary tract cancer, head and neck cancer, liver cancer, lung cancer, lymphoma or leukaemia, male genital organ cancer, pancreatic cancer, thyroid cancer and urinary tract cancer. Supplementary Table 4 presents the results of the time-lag analysis in the propensity-score-matched cohort. In the Cox regression analysis, the incidence of total cancer was 20% higher in the psychiatric disorder group (hazard ratio: 1.20, 95% CI: 1.18, 1.21; P < 0.001) than in the non-psychiatric-disorder group. Figure 2 shows hazard plots for cancer diagnoses in the propensity-score-matched cohort, with the psychiatric disorder group showing a higher cumulative incidence of total cancer than the non-psychiatric-disorder group (P < 0.001).
Fig. 2. Hazard plots for cancer diagnoses in propensity-score-matched cohort.
Table 2. Analysis results for the propensity-score-matched cohortOutcome N (event, %)Hazard ratio (95% CI) P-valueTotal cancer Non-psychiatric-disorder group43 989/343 285 (12.8)1 Psychiatric disorder group52 948/343 285 (15.4)1.23 (1.21, 1.24)<0.001Bone and cartilage cancer Non-psychiatric-disorder group135/343 285 (0.0)1 Psychiatric disorder group164/343 285 (0.0)1.24 (0.98, 1.55)0.069Brain cancer Non-psychiatric-disorder group384/343 285 (0.1)1 Psychiatric disorder group495/343 285 (0.1)1.31 (1.15, 1.50)<0.001Breast cancer Non-psychiatric-disorder group2659/343 285 (0.8)1 Psychiatric disorder group3001/343 285 (0.9)1.15 (1.09, 1.21)<0.001Colorectal cancer Non-psychiatric-disorder group8304/343 285 (2.4)1 Psychiatric disorder group10 383/343 285 (3.0)1.27 (1.24, 1.31)<0.001Oesophageal cancer Non-psychiatric-disorder group239/343 285 (0.1)1 Psychiatric disorder group267/343 285 (0.1)1.14 (0.95, 1.35)0.152Female genital organ cancer Non-psychiatric-disorder group5640/343 285 (1.6)1 Psychiatric disorder group6760/343 285 (2.0)1.22 (1.18, 1.26)<0.001Gastric cancer Non-psychiatric-disorder group2977/343 285 (0.9)1 Psychiatric disorder group3317/343 285 (1.0)1.13 (1.08, 1.19)<0.001Gall bladder or bile duct cancer Non-psychiatric-disorder group1686/343 285 (0.5)1 Psychiatric disorder group1967/343 285 (0.6)1.19 (1.11, 1.27)<0.001Head and neck cancer Non-psychiatric-disorder group443/343 285 (0.1)1 Psychiatric disorder group502/343 285 (0.1)1.15 (1.01,1.31)0.029Liver cancer Non-psychiatric-disorder group8608/343 285 (2.5)1 Psychiatric disorder group10 703/343 285 (3.1)1.27 (1.23, 1.30)<0.001Lung cancer Non-psychiatric-disorder group5817/343 285 (1.7)1 Psychiatric disorder group7073/343 285 (2.1)1.24 (1.19, 1.28)<0.001Lymphoma or leukaemia Non-psychiatric-disorder group2433/343 285 (0.7)1 Psychiatric disorder group2741/343 285 (0.8)1.15 (1.06, 1.21)<0.001Male genital organ cancer Non-psychiatric-disorder group7423/343 285 (2.2)1 Psychiatric disorder group9811/343 285 (2.9)1.34 (1.30, 1.39)<0.001Pancreatic cancer Non-psychiatric-disorder group8271/343 285 (2.4)1 Psychiatric disorder group10 491/343 285 (3.1)1.29 (1.26, 1.33)<0.001Thyroid cancer Non-psychiatric-disorder group4127/343 285 (1.2)1 Psychiatric disorder group4697/343 285 (1.4)1.16 (1.11, 1.21)<0.001Urinary tract cancer Non-psychiatric-disorder group3680/343 285 (1.1)1 Psychiatric disorder group4679/343 285 (1.4)1.29 (1.24, 1.35)<0.001
Analyses in the entire cohort
Table 3 displays the outcomes of the multivariable Cox regression model for all cancer diagnoses within the entire cohort. With model 1, the psychiatric disorder group had a 19% (hazard ratio: 1.19, 95% CI: 1.18, 1.21; P < 0.001) higher incidence of total cancer than the non-psychiatric-disorder group. With model 3, compared with the non-psychiatric-disorder group, individuals with two or more psychiatric disorders and those with three or more psychiatric disorders had 27% (hazard ratio: 1.27, 95% CI: 1.24, 1.29; P < 0.001) and 31% (hazard ratio: 1.31, 95% CI: 1.27, 1.35; P < 0.001) higher incidence rates of total cancer, respectively.
Table 3. Multivariable Cox regression model for total cancer incidenceVariableHazard ratio (95% CI) P-valueModel 1 Non-psychiatric-disorder group (n = 442 247)1 Psychiatric disorder group (n = 456 528)1.19 (1.18, 1.21)<0.001Model 2 Non-psychiatric-disorder group (n = 456 528)1 One psychiatric disorder group (n = 310 107)1.17 (1.15, 1.18)<0.001 Two or more psychiatric disorders group (n = 132 140)1.27 (1.25, 1.30)<0.001Model 3 Non-psychiatric-disorder group (n = 456 528)1 One psychiatric disorder group (n = 310 107)1.17 (1.15, 1.18)<0.001 Two psychiatric disorders group (n = 101 528)1.27 (1.24, 1.29)<0.001 Three or more psychiatric disorders group (n = 30 612)1.31 (1.27, 1.35)<0.001Model 4 ADHD (n = 2923)0.68 (0.58, 0.79)<0.001 Anorexia nervosa (n = 2636)0.97 (0.88, 1.08)0.608 Alcohol-related disorder (n = 16 628)1.27 (1.23, 1.32)<0.001 Anxiety disorder (n = 306 295)1.15 (1.14, 1.17)<0.001 Autism (n = 968)0.57 (0.41, 0.78)<0.001 Bipolar disorder (n = 41 388)0.94 (0.91, 1.05)0.402 Major depressive disorder (n = 206 669)1.16 (1.15, 1.18)<0.001 OCD (n = 5290)0.97 (0.90, 1.05)0.468 Schizophrenia (n = 28 880)0.93 (0.90, 0.97)<0.001 Tic (n = 1186)0.66 (0.53, 0.84)<0.001ADHD, attention-deficit hyperactivity disorder; OCD, obsessive–compulsive disorder.
Model 4 showed significant associations between an increased incidence of total cancer and specific psychiatric disorders among individuals with alcohol-related diseases (hazard ratio: 1.27, 95% CI: 1.23, 1.32; P < 0.001), anxiety disorder (hazard ratio: 1.15, 95% CI: 1.14, 1.17; P < 0.001) and major depressive disorder (hazard ratio: 1.16, 95% CI: 1.15, 1.18; P < 0.001). Supplementary Table 5 presents all hazard ratios with 95% CIs from multivariable model 1.
Subgroup analyses
Table 4 presents the findings from the subgroup analyses. The psychiatric disorder group exhibited a higher risk of total cancer incidence than the non-psychiatric-disorder group in both the male (hazard ratio: 1.22, 95% CI: 1.19, 1.24; P < 0.001) and female (hazard ratio: 1.18, 95% CI: 1.17, 1.20; P < 0.001) subgroups. Furthermore, the psychiatric disorder group showed an increased risk of death by suicide compared with the non-psychiatric-disorder group across age groups (18–40 years, hazard ratio: 1.25, 95% CI: 1.19, 1.30; P < 0.001; 41–60 years, hazard ratio: 1.24, 95% CI: 1.21, 1.27; P < 0.001; and ≥61 years, hazard ratio: 1.15, 95% CI: 1.13, 1.17; P < 0.001).
Table 4. Subgroup analyses for total cancer incidenceVariableHazard ratio (95% CI) P-valueGender: male Non-psychiatric-disorder group1 Psychiatric disorder group1.22 (1.19, 1.24)<0.001Gender: female Non-psychiatric-disorder group1 Psychiatric disorder group1.18 (1.17, 1.20)<0.001Age: 18–40 years Non-psychiatric-disorder group1 Psychiatric disorder group1.25 (1.19, 1.30)<0.001Age: 41–60 years Non-psychiatric-disorder group1 Psychiatric disorder group1.24 (1.21, 1.27)<0.001Age: ≥61 years Non-psychiatric-disorder group1 Psychiatric disorder group1.15 (1.13, 1.17)<0.001
Discussion
The results of this population-based cohort study indicate that individuals with psychiatric disorders have an increased risk of developing cancer compared with those without such disorders. This risk appears to increase with the presence of multiple diagnoses of psychiatric disorders. Among mental health conditions, alcohol-related disorders, anxiety disorders and major depressive disorder show particular associations with cancer, highlighting the need for policies to facilitate early detection and screening in individuals with these conditions.
Anxiety disorders, which were the most common psychiatric condition among participants in this study, are linked to an increased incidence of cancer. Psychological factors may affect immune and endocrine functions, hence the longstanding hypothesis that psychosocial elements play a part in the occurrence of cancer.^ 15 ^ Accumulating evidence suggests that the immune system connects the central nervous system and disease mechanisms,^ 16 ^ and anxiety disorders are characterised by impaired cellular immunological activity, which may be associated with cancer-related mechanisms.^ 17 ^ Indeed, several studies have shown that external factors such as stress, depression and social support significantly affect the immune system, with a subsequent influence on the onset and progression of cancer.^ 18,19 ^
Similarly, individuals with major depressive disorder have been reported to have a higher incidence of cancer; for instance, a small positive association has been reported between depression and the overall risk of developing cancer, including specific risks for liver and lung cancers.^ 20 ^ The origins of cancer are multifaceted and involve a combination of genetic predispositions, lifestyle choices, environmental influences, and psychosocial factors such as depression. Since the 1980s, research has indicated that depression has effects on immune and endocrine functions, cancer metastasis, treatment tolerance and various other processes.^ 21,22 ^ Moreover, prospective epidemiological studies suggest that depression may elevate the risk of developing cancer,^ 23 ^ and a recent retrospective cohort study found that depression was associated with an elevated cancer risk, varying from 10 to 39%, depending on the cancer type.^ 24 ^
Depression and cancer are both linked to increased inflammation, which activates the hypothalamic–pituitary–adrenal axis, influencing multiple physiological functions including metabolic processes and stress response mechanisms. Individuals diagnosed with depression have a higher prevalence of chronic illnesses linked to pain and inflammation compared with those without such a diagnosis.^ 25 ^ Furthermore, persistent inflammation has been shown to increase the risk of cancer.^ 26 ^ Downstream effectors of the hypothalamic–pituitary–adrenal pathway include pro-inflammatory elements such as cytokines; these may be upregulated or downregulated, with consequent effects on anti-cancer immune cells that promote the spread of cancer.^ 27 ^
Importantly, alcohol-related disorders are associated with a higher incidence of cancer. Numerous mechanistic pathways have been identified through which alcohol intake, specifically ethanol intake, contributes to cancer development, although certain aspects remain incompletely elucidated. Ethanol and acetaldehyde metabolites have the potential to induce DNA damage and hinder DNA synthesis and repair.^ 28 ^ In addition, both ethanol and acetaldehyde interfere with DNA methylation.^ 29 ^ Ethanol can trigger inflammation and oxidative stress, resulting in lipid peroxidation and additional DNA damage.^ 28 ^ The International Agency for Research on Cancer classifies alcohol as a group 1 carcinogen that is causally associated with seven cancer types: oesophageal, liver, colorectal and breast cancer,^ 30 ^ and 740 000 new annual cancer cases worldwide are linked to alcohol consumption.^ 31 ^ Recently, there has been some debate regarding the differences in cancer risk between light and heavy drinkers, with the evidence remaining inconclusive.^ 32 ^
This study had a few limitations. First, it did not include information on lifestyle factors such as alcohol and tobacco use, which could significantly increase the risk of cancer. Second, we did not obtain information on hormonal changes or genetic mutations due to the use of psychiatric drugs. Third, although this was a large cohort study, the data were gathered retrospectively, potentially introducing unmeasured confounders and biases. Furthermore, the findings of this study were derived from data collected in South Korea and may not be applicable to other populations. Fourth, we did not perform an analysis of cancer staging at diagnosis, which may have indicated whether patients with psychiatric diseases received later diagnoses; such healthcare disparities are an important issue for patients with cancer.^ 33 ^ Fifth, family history of cancer was not included as a covariate in this study. Last, we did not consider psychiatric medication use, which may influence metabolic and immune function. However, despite these limitations, we found that patients with psychiatric disorders had a higher risk of cancer than those without psychiatric disorders, and this risk seems to be increasing with the rising incidence of psychiatric disorders. Specifically, the results of this study demonstrated associations of alcohol-related disorders, anxiety disorders and major depressive disorder with cancer. Future studies should thus take lifestyle factors into account.
Supporting information
Oh et al. supplementary material 1Oh et al. supplementary material
Oh et al. supplementary material 2Oh et al. supplementary material
Oh et al. supplementary material 3Oh et al. supplementary material
Oh et al. supplementary material 4Oh et al. supplementary material
Oh et al. supplementary material 5Oh et al. supplementary material
Oh et al. supplementary material 6Oh et al. supplementary material
The reference list from the paper itself. Each links out to its DOI / PubMed record.
- 1Bray F , Ferlay J , Soerjomataram I , Siegel RL , Torre LA , Jemal A. Global Cancer Statistics 2018: GLOBOCAN estimates of incidence and mortality worldwide for 36 cancers in 185 countries. CA Cancer J Clin 2018; 68: 394–424.30207593 10.3322/caac.21492 · doi ↗ · pubmed ↗
- 2Global Burden of Disease Cancer Collaboration. Global, regional, and national cancer incidence, mortality, years of life lost, years lived with disability, and disability-adjusted life-years for 29 cancer groups, 1990 to 2016: a systematic analysis for the Global Burden of Disease Study. JAMA Oncol 2018; 4: 1553–68.29860482 10.1001/jamaoncol.2018.2706 PMC 6248091 · doi ↗ · pubmed ↗
- 3Global Burden of Disease Cancer Collaboration. Global, regional, and national cancer incidence, mortality, years of life lost, years lived with disability, and disability-adjusted life-years for 32 cancer groups, 1990 to 2015: a systematic analysis for the Global Burden of Disease Study. JAMA Oncol 2017; 3: 524–48.27918777 10.1001/jamaoncol.2016.5688 PMC 6103527 · doi ↗ · pubmed ↗
- 4Kessler RC , Berglund P , Demler O , Jin R , Merikangas KR , Walters EE. Lifetime prevalence and age-of-onset distributions of DSM-IV disorders in the National Comorbidity Survey Replication. Arch Gen Psychiatry 2005; 62: 593–602.15939837 10.1001/archpsyc.62.6.593 · doi ↗ · pubmed ↗
- 5Eaton WW , Martins SS , Nestadt G , Bienvenu OJ , Clarke D , Alexandre P. The burden of mental disorders. Epidemiol Rev 2008; 30: 1–14.18806255 10.1093/epirev/mxn 011PMC 2683377 · doi ↗ · pubmed ↗
- 6Dalton SO , Mellemkjaer L , Thomassen L , Mortensen PB , Johansen C. Risk for cancer in a cohort of patients hospitalized for schizophrenia in Denmark, 1969-1993. Schizophr Res 2005; 75: 315–24.15885523 10.1016/j.schres.2004.11.009 · doi ↗ · pubmed ↗
- 7Grinshpoon A , Barchana M , Ponizovsky A , Lipshitz I , Nahon D , Tal O , et al. Cancer in schizophrenia: is the risk higher or lower. Schizophr Res 2005; 73: 333–41.15653279 10.1016/j.schres.2004.06.016 · doi ↗ · pubmed ↗
- 8Whitley E , Batty GD , Mulheran PA , Gale CR , Osborn DP , Tynelius P , et al. Psychiatric disorder as a risk factor for cancer: different analytic strategies produce different findings. Epidemiology 2012; 23: 543–50.22488410 10.1097/EDE.0b 013e 3182547094 PMC 4176762 · doi ↗ · pubmed ↗