Which trace elements are accumulated in fronds of the Athyrium filix-femina fern? a study from the Czech Republic
Ivan Suchara, Václav Procházka, Julie Sucharová, Marie Holá

TL;DR
This study identifies trace elements accumulated in the fronds of Athyrium filix-femina ferns across the Czech Republic, revealing their relationship with soil composition and environmental factors.
Contribution
The study reports an unprecedented analysis of 45 elements in Athyrium filix-femina fronds, providing new insights into trace element accumulation in this fern species.
Findings
Fern fronds moderately accumulated Ba, Cd, Hg, Mo, Mn, Ni, Zn, and lanthanides.
Only some trace elements in granites (Rb, Cs, Be, Tl, U) showed significant correlation with frond contents.
Anthropogenic pollution in the Ostrava region mainly affected Fe concentrations.
Abstract
A screening test using XRF spectroscopy was done to map element concentrations in fronds of the Athyrium filix-femina fern growing at 244 coniferous forest plots across the Czech Republic. In the next step, 45 elements in fronds of the ferns coming from selected sites with contrasting geological and climatic conditions were determined using prevalently ICP-OES and ICP-MS methods. To our knowledge, such a number of elements analyzed is unprecedented in literature data of this important fern species. Element contents of forest floor humus, topsoil and subsoil from the same sites were adopted from previously performed analyses. To estimate element uptake and accumulation by ferns, the element distribution in fern fronds was correlated with that of soil covers and with selected site-specific factors. Bioconcentration and enrichment factors referred to the element contents in forest floor…
Genes, proteins, chemicals, diseases, species, mutations and cell lines named across the full text — each resolved to its canonical identifier and authoritative record.
Click any figure to enlarge with its caption.
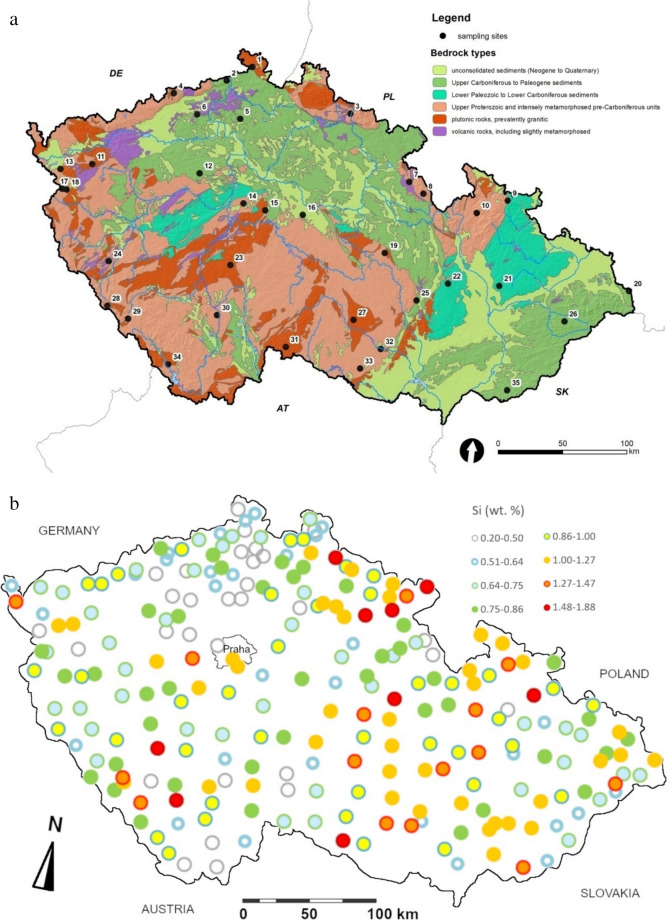 Figure 1
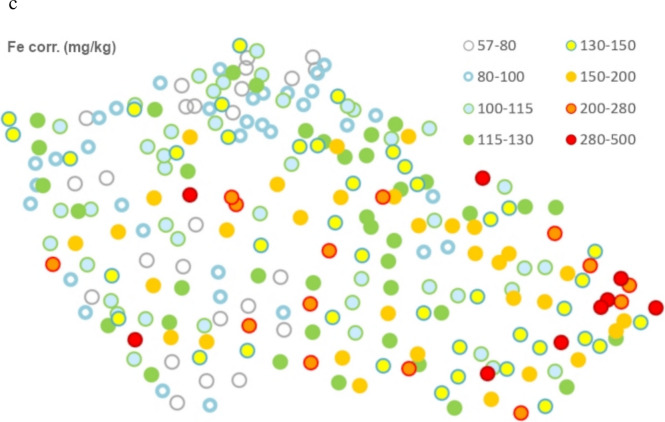 Figure 1
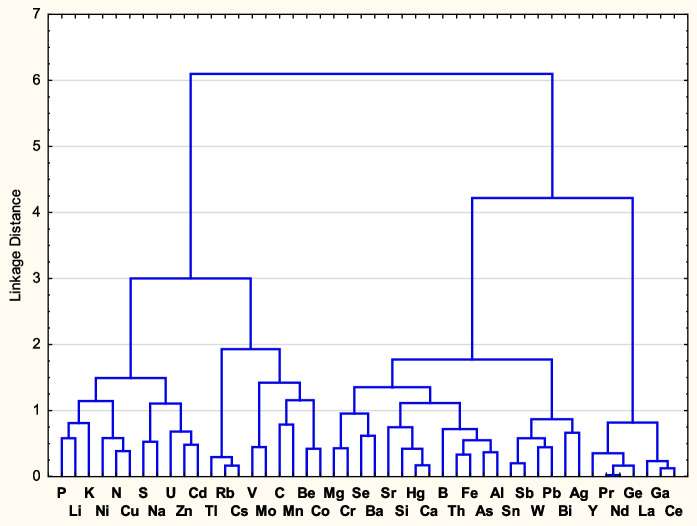 Figure 2
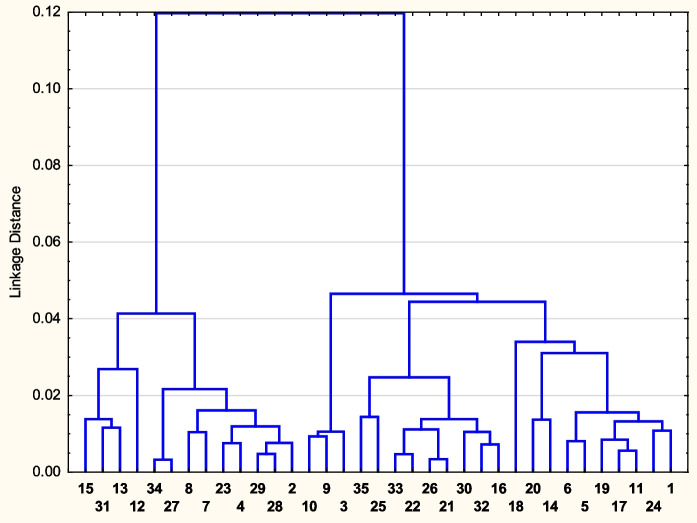 Figure 3
 Figure 5
- —Norway grants
- —VÚKOZ
- —https://doi.org/10.13039/501100001823Ministerstvo Školství, Mládeže a Tělovýchovy
- —Czech Technical University in Prague
Peer Reviews
No public reviews on file for this paper yet. If you reviewed it on a platform where reviews are public (OpenReview, ICLR, NeurIPS, ICML), you can paste yours below so the community can read it here.
Videos
No videos yet. Explain this paper in a talk, walkthrough, or lecture? Add one.
Taxonomy
TopicsHeavy metals in environment · Lichen and fungal ecology · Geology and Paleoclimatology Research
Introduction
Some of the about 12,000 fern species, frequently from the Pteridaceae family, accumulate or hyperaccumulate some trace elements, including several elements of major toxicological interest like As, in sporophytes and gametophytes (e.g. Eslava-Silva et al., 2023; Meharg, 2003; Srivastava et al., 2010; Xie et al., 2009). This is also true for several of about 180 species of the Athyrium genus (Van et al., 2006; Zhang et al., 2014). Element accumulation in fern bodies frequently increases in the following order: fronds < rhizomes < roots. Across fern fronds, petioles usually had lower element concentrations than blades (e.g. Jedynak et al., 2009; Samecka-Cymerman et al., 2011).
Athyrium filix-femina is widespread across three continents (Meusel et al., 1965), and several intraspecies taxa and cultivars have been recognized and cultivated. Athyrium filix-femina (further AFF) occurs across the whole territory of the Czech Republic except for the warmest regions of lowlands (Kaplan et al., 2018); however, there are no available data on its elemental composition there.
There are several studies on elemental composition of AFF from Poland, including the Czech-Polish border regions. Samecka-Cymerman et al. (2011) found relatively low concentrations of Cr, Al, Fe and V in AFF in the Giant Mts. Nevertheless, some authors reported accumulation of Ni (Parzych & Jonczak, 2018a, 2018b) and As (e.g., Jedynak et al., 2009). Also, the ability of AFF (similar to many other ferns) to accumulate lanthanides was documented (Grosjean et al., 2020).
The basis of our study is the determination of contents of 46 elements in fronds of AFF in the Czech territory at various geological units. The composition of green biomass of various other plants (moss, grass, spruce) from the sites sampled was evaluated by Suchara et al., (2011, 2017). These plants are valuable indicators of pollution for many elements; however, no significant accumulation of trace elements from the substrate has been found in the species investigated. Here, we concentrate on the influence of element contents in substrates (humus and two mineral soil horizons) and other selected site explanatory factors on element contents in fronds, with some emphasis on the ability of AFF to accumulate trace elements. Besides, in the “Discussion”, we summarize available literature data on the elemental composition of AFF fronds in Europe (except for studies with experimental chemical treatment) to facilitate the comparison of our large dataset (which is relatively unique for a single fern species) with data from other countries.
Material and methods
Samples
Specimens of AFF were collected at 244 forest plots of ca 50 × 50 m included in a network of the national moss biomonitoring campaigns (Suchara et al., 2017). Two middle-aged fronds, frequently with developed spore sacks, growing between the inner and outermost fronds were collected from 3 to 5 different fern plants within each sampling plot in August and September 2005. A photo of AFF clumps is included in Supplementary Materials. The leaves from each plot were joined into a composite sample. The samples were air dried, milled and sieved for particle diameters ≤ 0.25 mm. The dried leaves weighed 50–130 g, corresponding to about 300–600 g of fresh leaves (Prats et al., 2024).
Element content determination
A screening of elements heavier than Na in the powdered fern samples stored in ziplock bags was performed using a portable XRF analyser VANTA VRM (Olympus). The analytical mode “Geochemistry”, a spot diameter 10 mm, a sequence of two maximum beam energies 40 and 10 kV and automatic interpretation of spectra were used. The ziplock bags (made of polyethylene 0.05 mm thick) with samples were placed immediately at the window protecting the X-ray source and detector. The results of the XRF measurements (including other fern- and diverse plant species) will be published separately; however, the Si- and partly Fe contents obtained are utilized in this study. For more detailed elemental analyses, 35 frond specimens coming from sites of contrasting geological and climatic characteristics were selected (Table 1, Fig. 1). Table 1. Geographical coordinates, elevation, bedrock (with simplified classification into 5 groups—see ESM 3) and position in climatic areas and potential annual evaporation of the AFF sampling plotsSampling plot orderLatitude°NAltitude°EElevationm a. s. lBedrockBedrock classificationClimatic zone**Potential evaporation (mm/y)**150.939914.4360460Quartzose sandstoneSANDMW7550–600250.821014.1769410Quartzose, argillaceous and green sandstoneSANDMW7550–600350.704515.5760790PhyllitePHYLC6500–550450.679513.6199770GraniteGRAC5500–550550.568814.3818305Quartzose sandstoneSANDW2600–650650.558613.9075570Trachyte, altered basaltBASW2600–650750.278716.3015635Greywacke and phyllitePHYLC6500–550850.207516.4717715GneissPARC6500–550950.220617.3922835Muscovitic-chloritic and chloritic schist with phyllitePHYLMW1550–6001050.112617.0680855Biotite and two-mica gneiss to augen schistPARMW1500–5501150.105312.8571520Granites and granodioriteGRAMW6550–6001250.151814.0255420Sandy marlite, spiculite and claystoneSANDMW11650–7001350.035012.5249555GraniteGRAW2600–6501449.986114.5441320GreywackePHYLMW11650–7001549.958614.7875485GraniteGRAMW7600–6501649.961415.1957365ParagneissPARW2650–7001749.900412.5784585Paragneiss to migmatitePARMW3550–6001849.900812.6253600ParagneissPARMW6550–6001949.764916.1267700Paragneiss, gneiss to migmatitePARW2650–7002049.664918.7873610Sandstone and claystone in the Carpathian flyschSANDMW1550–6002149.620617.3902325Clay shale, siltstone and greywackePHYLMW7600–6502249.600516.8391585Greywackes and clayey shalePHYLW2650–7002349.547214.4917635Porphyry amphibole-biotite granite (durbachite)GRAMW4550–6002449.450913.1954535Andesitic basaltBASMW11600–6502549.459916.5224480Two-mica paragneiss with garnetsPARMW4550–6002649.416418.1225565Sandstone and claystone in the Carpathian flyschSANDC7550–6002749.275515.8751555Granite to quartz syenite (durbachite)GRAMW4550–6002849.141913.2536925ParagneissPARC6550–6002949.074013.4929910GraniteGRAC6500–5503049.187814.4242440ParagneissPARMW7550–6003149.030715.1937685GraniteGRAMW2550–6003249.095316.2002275Serpentine, peridotiteBASMW11650–7003348.942916.0065355Migmatite to orthogneissPARMW7650–7003448.799913.9835880Granite, melanocratic granite, granodiorite, migmatiteGRAMW1550–6003548.900317.5799405Sandstone and marlite in the Carpathian flyschSANDW2650–700Adopted from ČGS (2024)Adopted from Tolasz et al. (2007)C cold, MW moderately warm, W warm climatic areasFig. 1a** Distribution of selected 35 sampling plots of AFF in a simplified geological map of the Czech Republic. b Map of Si content in fronds from all sites, determined by XRF. c Map of Fe contents determined by XRF and corrected by a simple linear function according to Fe determination by OES in 35 overlapping samples
The pulverized sample was dried (40 °C/4 h), and then, 0.25 g was weighed in a Teflon digestion vessel. After adding 6 ml HNO_3_ and 2 ml H_2_O_2_, the sample was subtotally digested in a CEM MARS 6 microwave digestion system (1200 W/200 °C/20 min). The humus and soil samples (0.200 g) were digested in a similar way, but a two-step procedure was used: 1. HNO_3_ + H_2_O_2_ + HF = 5.0: 2.0: 0.3–0.6 ml, 2. H_3_BO_3_ = 3–6 ml according to preliminarily determined Si contents.
Contents of the following elements were determined by solution analyses: Al, B, Ba, Ca, Fe, K, Mg, Mn, Na, P, S, Sr, Zn and (in soil and humus only) Si by ICP-OES (Avio 500, Perkin Elmer) and Ag, As, Be, Bi, Cd, Ce, Co, Cr, Cs, Cu, Ga, Ge, La, Li, Mo, Nd, Ni, Pb, Pr, Rb, Sb, Se, Sn, Th, Tl, U, V, W and Y by ICP-MS (NexION 2000, Perkin Elmer). Total Hg and C and N contents were measured directly in powdered samples using a single-purpose mercury AMA 256 atomic absorption spectrometer and a carbon and nitrogen determinator (LECO CN 928), respectively.
All measurements were performed in three independent replications (see ESM 1 for complete data). Blind samples and reference materials (IAEA Lichen 336, NIST Pine Needles 1575a, NIST Apple Leaves and LECO ALPHALPHA 502–237) were analyzed in parallel (see ESM 2 for results of reference materials analyses). No recalibration of analytical instruments had to be done.
Explanatory factors
The analytical results were related to the selected sampling plots specific characteristics, such as elevation, bedrock types and potential annual evaporation. More explanatory factors, namely pH values and element contents of humus, topsoil and subsoil of the sampling sites, were adopted from the previous measurements (Suchara et al., 2011).
Indices of element accumulation
To estimate the efficiency of AFF to accumulate elements in fronds, the bioconcentration factor (BcF) was used (e.g. Burnison, 1998):
\documentclass[12pt]{minimal} \usepackage{amsmath} \usepackage{wasysym} \usepackage{amsfonts} \usepackage{amssymb} \usepackage{amsbsy} \usepackage{mathrsfs} \usepackage{upgreek} \setlength{\oddsidemargin}{-69pt} \begin{document}$$\text{BcF }=\text{ cEf}/\text{cEs}$$\end{document}where cE_f_ and cE_s_ represent the content of E element in frond and in soil, respectively.
Enrichment factors (EFs) (Barbieri, 2016) were computed as ratios of normalized element content in AFF to normalized element content in humus (O_h_), topsoil and subsoil, respectively, using Al for chemical normalization:
\documentclass[12pt]{minimal} \usepackage{amsmath} \usepackage{wasysym} \usepackage{amsfonts} \usepackage{amssymb} \usepackage{amsbsy} \usepackage{mathrsfs} \usepackage{upgreek} \setlength{\oddsidemargin}{-69pt} \begin{document}$$(\text{EF}) = (\text{E}/\text{Al})\text{frond}/(\text{E}/\text{Al})\text{substrate}$$\end{document}Not enriched, slightly, moderately, severely, highly severely and extremely enriched classes were defined by the respective intervals < 1.5, [1.5;2], [2;5], [5;20], [20;40] and ≥ 40.
Cerium anomalies calculation
Cerium anomalies (Ce/Ce*) were calculated using geometric extrapolation to obtain the theoretical Ce* value (i.e. Ce concentration in case of no anomaly) by the following formula:
\documentclass[12pt]{minimal} \usepackage{amsmath} \usepackage{wasysym} \usepackage{amsfonts} \usepackage{amssymb} \usepackage{amsbsy} \usepackage{mathrsfs} \usepackage{upgreek} \setlength{\oddsidemargin}{-69pt} \begin{document}$$Ce/Ce* = CeN/[PrN2/NdN]$$\end{document}where Ce_N_, Pr_N_ and Nd_N_ are element values, normalized to the element contents in Post-Archean Australian Shales (see Barrat et al., 2023 for details). Values of Ce/Ce* significantly lower and greater than 1 mean a negative and a positive anomaly, respectively.
Statistics
Basic statistics and statistical tests and analyses were obtained in the StatSoft STATISTICA 14.0 software. Measured variables having a typically log-normal distribution were log transformed (log_10_ median) for statistical evaluations. Due to remaining differences from normal distribution in some transformed data, Spearman’s correlation coefficients were computed in all correlation analyses used. For cluster analysis in STATISTICA, the following parameters were used: raw variable or cases data (for Figs. 2 and 3, respectively), Ward’s method and 1–Pearson r for cluster, amalgamation rule and distance measure, respectively.Fig. 2. Cluster analysis (Ward’s method, 1-Pearson r, Distance Linkage) dendrogram for the medians of element contents in AFF at 35 sampling sites. Medians used were log_10_ transformedFig. 3Cluster analysis (Ward’s method, 1-Pearson r, Distance Linkage) dendrogram for 35 sampling sites of AFF with the given medians of element contents. Medians used were log_10_ transformed
Results
The element contents and their basic statistics for the AFF fronds specimens are presented in Table 2. Table 2. Basic statistics for the element contents in the AFF fronds (mg/kg), n = 35, SD standard deviation, RSD relative standard deviation, I.Q. first quartile, III.Q. third quartile, MAD median absolute deviationElementMinMaxMeanSDRSD (%)I.QMedianIII.QMADC428,968465,741449,29389522445,000449,229454,0005064N20,22336,25425,92636431423,05025,88928,1002615Ag0.0080.1030.0170.016910.0110.0140.0180.004Al50.426013856.14096.712917040.4As0.0240.2420.0840.047540.0500.0720.1000.024B16.377.027.89.783523.225.430.92.67Ba53.130613659.04394.112716838.7Be0.0040.3020.0430.0641470.0120.0180.0490.010Bi0.0010.0250.0040.004950.0020.0030.0060.001Ca426010,7636730170125539862488044986Cd0.0441.630.3390.319930.1320.5810.4110.159Ce1.5348.921.610.64914.219.128.85.85Co0.0360.8330.1710.153900.0820.1140.2220.045Cr0.3071.850.4890.261530.3750.4210.5090.075Cs0.01620.01.883.681930.1790.4152.470.319Cu5.0415.39.242.22237.929.0210.01.12Fe72.030012744.33410211214214.8Ga0.0840.4210.2250.083360.1670.2080.2510.043Ge0.0860.4880.2200.091410.1620.2080.2430.041Hg0.0210.1100.0450.025540.0270.0360.0540.010K14,45532,59223,26447232019,82723,76227,0443390La1.6272.418.413.07011.615.620.84.58Li0.0777.250.8991.621670.1530.4250.6520.271Mg202365163318101131275230103804425Mn34.193114615711288.35104142.022.8Mo0.0981.650.3880.356960.1660.2340.4430.104Na5.2826646.760.413612.4021.052.7011.1Nd1.7535.410.97.64626.568.2212.652.43Ni0.74426.95.327.401321.612.635.561.42P11023740201264331151819132318406Pb0.1712.780.6840.599720.3120.4150.7330.165Pr0.3888.513.001.87581.972.463.350.581Rb7.5451713813810449.1078.020031.9S13392528183226415165518521978159Sb0.0090.0620.0230.013460.0150.0190.0290.006Se0.340.4980.1900.115580.1040.1590.2490.061Sn0.0290.1220.0560.024380.0410.0460.0680.010Sr9.6764.228.714.35016.7025.434.159.18Th0.0030.0390.0860.107510.0090.0440.0240.026Tl0.0040.5880.0170.0091300.0260.0150.1240.007U0.0020.6810.0320.1153830.0050.0070.0140.004V0.1901.670.5720.356640.3680.4270.5590.104W0.0030.0270.0110.006540.0080.0100.0130.002Y0.20735.13.235.95700.9881.572.9750.953Zn19.756.728.08.103023.1526.428.953.27Si297313,34483862623316312874910,1162022
Results of cluster analysis for the elements in 35 fern samples and for the 35 selected sampling sites are shown in Figs. 2 and 3.
Correlation coefficients for element contents in AFF with element contents in the substrates and the explanation factors are gathered in ESM 4. Bioconcentration factors for the element contents in AFF related to the element contents in humus, the topsoil and subsoil are shown in ESM 5 and enrichment factors in ESM 6.
Macroelements
Of elements analyzed, macroelements include C, N, P, K, Ca, Mg, S, Fe and Si. They play structural, nutritional and protective roles in plant bodies. Contents of C (median 449.2 ± 5.06 g/kg) showed extremely low variability (CV 1.1%), and the sampling site factors did not significantly affect C content in AAF fronds. All significant correlations between the content of C and of other elements are negative (except for the positive correlation with Cr).
Nitrogen contents (20.2–36.3 g/kg) significantly positively correlated with P, S and Cu contents and negatively with Ba in fronds. The C:N ratios ranged from 11.9 to 22.6 and N:P ratios from 5.4 to 21.6.
Contents of P in fronds showed a wide range (1.10–3.74 g/kg). Fronds from sites with granitic bedrocks had significantly higher P concentrations and lower C:P and N:P ratios.
The relatively high contents of K in fronds (14.4–32.6 g/kg) are consistent with other studies (Tables 2 and 3). The K contents positively and negatively correlated with granitic and phyllitic bedrocks, respectively. Potassium negatively correlated with Ca and Mg in fronds and with humus pH. Table 3. Published data of element contents and bioconcentration factors in AFF fronds (mg/kg, unless stated otherwise) determined in European natural or seminatural biotopesElementRangeMean (median)BcFHabitatsDecomposition + analytical methodsSourceAl10–2001100.01–0.02^+^Alder forest riverbank marsh, N PolandHNO_3_+H_2_O_2_,MP-AESParzych & Jonczak, 2018b103–4843540.04^m^Forests in the Kaczawskie Mts., SW PolandHNO_3_+HClO_4_, ETAASSamecka-Cymerman et al., 2011As2.2–2.8n.d.Metalliferous soils, N ItalyHNO_3_, ICP-OESCornara et al., 2007200.01^m^Soil in Ag-As mining area, S PolandHNO_3_, GFAASJedynak et al., 2009C (%)42Peat birch forest, Baltic shore, N PolandK_2_Cr_2_O_7_, titration Mohr'sParzych, 2010Ca3350Wet spruce forest, NE Polandburn, FAESCzerwiński & Pracz, 19951000–700040000.38–0.52*^+^Alder forest riverbank marsh, N PolandHNO_3_+H_2_O_2_, FAASParzych & Jonczak, 2018b4907–6879100–220Headwater riparian alder forest, N PolandHNO_3_+H_2_O_2_, FAASParzych & Astel, 20185464–9900723210^+m^Forests in the Kaczawskie Mts., SW PolandHNO_3_+HClO_4_, FAASSamecka-Cymerman et al., 20111120–63002140Polluted and unpolluted sites in Norway and Lithuanian.s., AASStapulionytė et al., 20183400–11100Coniferous forests on soddy podzols, Moscow regionn.s.Vtorova & Solntseva 1983Cd0.11–1.250.139Metalliferous soils, N ItalyHNO_3_, ICP-OESCornara et al., 20070.061–0.387(0.087)0.13^m^Eastern Giant Mts., S PolandHNO_3_+H_2_O_2_, GFAASKrawczyk et al., 20060.10–0.910.38 (0.35)0.9^+m^Forest soils, mining and smelting area, NE SlovakiaAqua Regia, GFAASMusilova et al., 20160.270.55^•m^Beech woods on acid and damp soils, GermanyGFAAS/ICP-OESNeite et al., 19910.01–0.100.06Forests in the Kaczawskie Mts., SW PolandHNO3+HClO_4_, ETAASSamecka-Cymerman et al., 20110.013–1.300.08Polluted and unpolluted sites in Norway and Lithuanian.s., AASStapulionytė et al., 2018Co0.004–0.1440.065 (0.074)0.08^+m^Eastern Giant Mts., S PolandHNO_3_+H_2_O_2_, GFAASKrawczyk et al., 20060.1–0.60.30.04^+m^Forests in the Kaczawskie Mts., SW PolandHNO3+HClO_4_, ETAASSamecka-Cymerman et al., 2011Cr14.6–44.7n.d.–0.01Metalliferous soils, N ItalyHNO_3_, ICP-OESCornara et al., 20077.39–11.88.95 (8.62)3.0^+m^Eastern Giant Mts., S PolandHNO_3_+H_2_O_2_, GFAASKrawczyk et al., 20060.1–0.40.20.01^+m^Forests in the Kaczawskie Mts., SW PolandHNO3+HClO_4_, ETAASSamecka-Cymerman et al., 2011Cu6.2–18.20.31–0.36Metalliferous soils, N ItalyHNO_3_, ICP-OESCornara et al., 20079.15–11.910.7 (10.9)0.94^m^Eastern Giant e Mts., S PolandHNO_3_+H_2_O_2_, FAASKrawczyk et al., 20063.34–85.710.3 (7.61)0.09^+m^Forest soils, mining and smelting area, NE SlovakiaAqua Regia, FAASMusilova et al., 20161924^m^Beech woods on acid and damp soils, GermanyGFAAS/ICP-OESNeite et al., 1991n.d.–2912.51.2–1.7^+^Alder forest riverbank marsh, N PolandHNO_3_+H_2_O_2_, FAASParzych & Jonczak, 2018b7.2–169.70.4*^+m^Forests in the Kaczawskie Mts., SW PolandHNO3+HClO_4_, ETAASSamecka-Cymerman et al., 20111.4–186.3Polluted and unpolluted sites in Norway and Lithuanian.s., AASStapulionytė et al., 2018Fe130–198n.d.–0.01Metalliferous soils, N ItalyHNO_3_, ICP-OESCornara et al., 200741–255116 (109)0.03^+m^Eastern Giant Mts., S PolandHNO_3_+H_2_O_2_, FAASKrawczyk et al., 200690–3102000.02–0.03*^+^Alder forest river bank marsh, N PolandHNO_3_+H_2_O_2_, FAASParzych & Jonczak, 2018b99–4152160.01^+m^Forests in the Kaczawskie Mts., SW PolandHNO3+HClO_4_, FAASSamecka-Cymerman et al., 201122–1070115Polluted and unpolluted sites in Norway and Lithuanian.s., AASStapulionytė et al., 2018Hgn.d.–6.590.22 (0.05)n.d.–1.23Forest soils, polluted by Cu and Hg smelters, NE SlovakiaAASÁrvay et al., 20170.02–12.80.99 (0.06)0.03^m^Forest soils, mining and Cu and Hg smelters, NE SlovakiaHg-AAS (AMA-254)Musilova et al., 2016K (%)0.757Wet spruce forest, NE Polandashing, FAESCzerwiński & Pracz, 19952.1–3.22.6314.7–39.7*^+^Alder forest riverbank marsh, N PolandHNO_3_+H_2_O_2_, FAASParzych & Jonczak, 2018b1.69–2.194760–20335*^w^Headwater riparian alder forest, N PolandHNO_3_+H_2_O_2_, FAASParzych & Astel, 20181.44–2.862.0237^+m^Forests in the Kaczawskie Mts., SW PolandHNO3+HClO_4_, FAASSamecka-Cymerman et al., 20111.23–2.511.48Polluted and unpolluted sites in Norway and Lithuanian-a., AASStapulionytė et al., 20183.83–5.02Coniferous forests on soddy podzols, Moscow regionn.s.Vtorova & Solntseva, 1983Mg5180Wet spruce forest, NE PolandFAASCzerwiński & Pracz, 19952500–460035001.7–3.9*^+^Alder forest riverbank marsh, N PolandHNO_3_+H_2_O_2_, FAASParzych & Jonczak, 2018b3781–4068590–3270*^w^Headwater riparian alder forest, N PolandHNO3+HClO_4_, FAAParzych & Astel, 20182172–513739941.6^+m^Forests in the Kaczawskie Mts., SW PolandHNO3+HClO_4_, FAASSamecka-Cymerman et al., 20111230–1000019000.63^+m^Polluted and unpolluted sites in Norway and Lithuanian.s., AASStapulionytė et al., 20182800–6700Spruce and pine forest on soddy podzols, Moscow regionn.s.Vtorova & Solntseva, 1983Mn53–141101 (107)1.0^+m^Eastern Giant Mts., S PolandHNO_3_+H_2_O_2_, FAASKrawczyk et al., 200645–13086.50.25–0.35*^+^Alder forest riverbank marsh, N PolandHNO_3_+H_2_O_2_, FAASParzych & Jonczak, 2018b194–519339Forests in the Kaczawskie Mts., SW PolandHNO3+HClO_4_, FAASSamecka-Cymerman et al., 201110–50045Polluted and unpolluted sites in Norway and Lithuanian.s., AASStapulionytė et al., 2018N (%)2.380Wet spruce forest, NE PolandKjeldahlCzerwiński & Pracz. 19951.7111.7^m^Peat birch forest, Baltic shore, N PolandKjeldahlParzych, 20101.06–1.831.413Headwater riparian alder forest, N PolandKjeldahlParzych & Jonczak, 2018a1.00–2.361.6761.5–1.8*^+^Alder forest riverbank marsh, N PolandKjeldahlParzych & Jonczak, 2018b1.40–1.411.62–5.42*^w^Headwater riparian alder forest, N PolandKjeldahlParzych & Astel, 20182.69–2.94Coniferous forests on soddy podzols, Moscow regionn.s.Vtorova & Solntseva, 1983Na650Wet spruce forest, NE Polandashing, FAESCzerwiński & Pracz, 19954–50040Polluted and unpolluted sites in Norway and Lithuanian.s., AASStapulionytė et al., 2018500–700Coniferous forests on soddy podzols, Moscow regionn.s.Vtorova & Solntseva, 1983Ni25.8–33.90.06–0.15Metalliferous soils, N ItalyHNO_3_, ICP-OESCornara et al., 20074.49–8.546.65 (6.65)2.8^+m^Eastern Giant Mts., S PolandHNO_3_+H_2_O_2_, GFAASKrawczyk et al., 200613–42262.8–3.9*^+^Alder forest riverbank marsh, N PolandHNO_3_+H_2_O_2_, FAASParzych & Jonczak 2018b1.1–4.92.40.18^+m^Forests in the Kaczawskie Mts., SW PolandHNO3+HClO_4_, ETAASSamecka-Cymerman et al., 2011P468–2379Metalliferous soils, N ItalyHNO_3_, ICP-OESCornara et al., 20071720Wet spruce forest, NE PolandSpectrophotometryCzerwiński & Pracz, 19954000Boreal forestsn.s.Gerloff et. al., 1964 ex Larsen, 198214101.3^m^Peat birch forest, Baltic shore, N PolandSpectrophotometryParzych, 20101500–345024850.36–0,40*^+^Alder forest riverbank marsh, N PolandSpectrophotometryParzych & Jonczak, 2018b2177–22665385–29230*^w^Headwater riparian alder forest, N PolandSpectrophotometryParzych & Astel, 2018108–13678582.9^+m^Forests in the Kaczawskie Mts., SW PolandSpectrophotometrySamecka-Cymerman et al., 20113400–4600Coniferous forests on soddy podzols, Moscow regionn.s.Vtorova & Solntseva, 1983Pb0.90–1.34n.d.–0.03Metalliferous soils, N ItalyHNO_3_, ICP-OESCornara et al., 20072.84–13.15.34 (4.45)0.05^+m^Eastern Giant Mts., S PolandHNO_3_+H_2_O_2_, GFAASKrawczyk et al., 20060.09–12.32.21 (1.10)0.04 ^+m^Forest soils, mining and smelting area, NE SlovakiaAqua Regia, GFAASMusilova et al., 2016240.6^•m^Beech woods on acid and damp soils, GermanyGFAAS/ICP-OESNeite et al., 19912.6–9.25.30.14^+m^Forests in the Kaczawskie Mts., SW PolandHNO3+HClO_4_, ETAASSamecka-Cymerman et al., 20110.07–990.08Polluted and unpolluted sites in Norway and LithuaniaGFAAS/ICP-OESStapulionytė et al., 2018HNO3+HClO_4_, ETAASS700–14001230Wet pine forest, NE Polandn.s.Czerwiński & Pracz, 1995Coniferous forests on soddy podzols, Moscow regionn.s.Vtorova & Solntseva, 1983Si (%)0.63–1.25Coniferous forests on soddy podzols, Moscow regionn.s.Vtorova & Solntseva, 1983Sr29–61440.76–0.99*^+^Alder forest riverbank marsh, N PolandHNO_3_+H_2_O_2_,MP-AESParzych & Jonczak, 2018bV0.2–2.40.90.04^+m^Forests in the Kaczawskie Mts., SW PolandHNO3+HClO_4_, ETAASSamecka-Cymerman et al., 2011Zn14.6–44.70.32–0.58Metalliferous soils, N ItalyHNO_3_, ICP-OESCornara et al., 200721.7–50.530.1 (26.5)0.76^+m^Eastern Giant Mts., S PolandHNO_3_+H_2_O_2_, FAASKrawczyk et al., 200612.4–73.739.5 (38.3)0.21^+m^Forest soils, mining and smelting area, NE SlovakiaAqua Regia, FAASMusilova et al., 2016713.4^•m^Beech woods on acid and damp soils, GermanyGFAAS/ICP-OESNeite et al., 199112–3222.50.36–0.55*^+^Alder forest riverbank marsh, N PolandHNO_3_+H_2_O_2_, FAASParzych & Jonczak, 2018b40–91611.0^+m^Forests in the Kaczawskie Mts., SW PolandHNO3+HClO_4_, FAASSamecka-Cymerman et al., 201110–10215Polluted and unpolluted sites in Norway and Lithuanian.s., AASStapulionytė et al., 2018Estimated from published diagrams, ^+^ values related to subtotal element contents, ^w^ BcF related to the element contents in surface water, ^^ BcF related to the extractable (NH_4_Cl) element contents in soil, m mean value, n.a. not available
The fronds had twofold higher contents of Ca than Mg, which is generally consistent with the literature. Although both sites with peak Mg contents in fronds (6.5 and 5.95 g/kg) have Mg-rich rock substrates (serpentinite and basalt, respectively), there is no statistically significant correlation of Mg or Ca with their contents in soil. Frond Ca content correlates positively with humus pH.
Sulphur content in fronds (1.3–2.5 g/kg) correlated positively (besides N) with Na, Zn and Cu and with phyllitic bedrocks. Interestingly, there is no correlation of S in fronds and in humus, but a strong negative correlation of S in fronds and in the upper mineral horizon B1 (in deeper mineral horizon B2, S was not analyzed).
Iron content in fronds is, on average, similar to that of Mn, and it is positively correlated with Ca, Mg, Si and many trace elements like Cr. A map of Fe contents obtained by XRF is shown in Fig. 1c, where a regional enrichment in the very east (near Ostrava) is documented.
The XRF measurements showed relatively high median Si contents in AFF fronds: 8.12 ± 1.85 and 8.75 ± 1.56 g/kg from the whole country (n = 244) and from the studied plots (n = 35), respectively. Contents of Si showed a strong positive correlation with Ca, Fe, Al and many trace elements. The spatial distribution of Si contents is shown in Fig. 1b.
Microelements
Concentrations of B, Cu and Zn in fronds showed the lowest variability among the trace elements, indicating a physiological control to maintain optimal content, while the highest variability of U, Cs, Li, Tl, Be, Ni and even Na may imply low AFF control on uptake and accumulation of these elements. Average content of Mn is strongly influenced by an outlying peak value 931 mg/kg, while the range of other samples is 34–381 mg/kg.
Increased content of some microelements was associated with certain bedrock types, namely granites and durbachite (Be, Rb, Cs, Tl), sandstones (Zn) and phyllites (Pb, W; influence of the sulfidic mineralization associated with gold deposits near site 9 is possible). The site 32 with chemically contrasting serpentinite bedrock also has a high content of Cr, Ni and Cu in fronds, but the whole group of basic and ultrabasic rocks is not distinct.
Positive correlations prevail among microelement contents in fronds. Very strong mutual positive correlations showed REEs and Y, which also positively correlated with Ga, Ge, Al and Si. Contents of Cs, Rb, Sr and Tl in fronds correlated positively, and Cr, Cu, Li and Ni correlated negatively with altitude. Potential evaporation, negatively correlating with elevation (r = –0.65**), positively affected Co, Li and Th contents and negatively affected Bi, Ca, Tl and Rb contents.
Cerium anomalies
The fronds prevalently showed negative cerium anomalies with Ce/Ce* ratios 0.33–1.38, mean 0.85, SD 0.26, median 0.84 and MAD 0.21. The only three fern samples with significant positive Ce anomalies are those with the highest Mn concentrations.
Bioconcentration factors
The BcF values (see ESM 5 for complete data) mostly decreased when related to the element contents in the following order: humus > topsoil > subsoil; however, frequently, the highest BcF values were found when related to the topsoil (ESM 5). The average BcF > 1 showed some macroelements (Ca, K and Mg) and microelements (Ba, Rb, Ce, La, Nd, Pr and Y) when BcF was related to the humus element contents, while when compared with element contents in the lower mineral soil, the BcF exceeded 1 for K, Mg, Cd, Cu, Hg, Mn, Rb and Zn. Despite relatively high BcFs for Rb, the K/Rb ratios in fronds were generally higher than in humus and soil. Probably, a high BcF for B would have also been indicated; however, B content was not determined in substrates. On the other hand, Na, As, Bi, Pb, Sb, Sn, Th, Tl and W showed medians BcFs < 0.1 related to all soil layers, indicating that these elements are excluded by AFF. BcFs were relatively significantly influenced by site factors (see “Discussion” and ESM 7).
Enrichment factors
Normalized element contents in the subsoil, topsoil and humus were used as local background values for computing enrichment factors of elements in fronds. Due to relatively low Al content and enrichment in Cd, Hg, Bi, Cu, Mo, Pb, Sb and Sn (partly due to atmospheric deposition) in humus, the EFs medians except for REE and alkali elements are higher when related to element contents in soil (mainly in the subsoil) than to that in humus. Elements with no to slight enrichment in fronds were Ag, As, Bi, Cr, Fe, Li, Na, Sb, Sn, Th, U, V and W, mainly if related to the humus element contents. The highest median EFs characterize macronutrients and their analogues (Ba, Ca, Cs, K, Mg, Rb, S, Sr), some micronutrients and toxic elements (Cd, Cu, Hg, Mn, Mo, Zn) and especially REE (La, Ce, Pr, Nd) and Y.
Discussion
Cluster analysis
Figure 2 shows clusters of elements, whose variability in AFF is similar partly due to their generally similar chemical properties and common occurrence (e.g. lanthanides, or Rb and Cs). Biogenic elements tend to concentrate in the left cluster. Figure 3 shows clusters of sampling sites with most similar medians of element contents in AFF. The left cluster (13 sites) contains almost all (8 of 9) sampling sites with granitic bedrock. However, other bedrock groups are little distinct, most likely due to their internal variability and the importance of the remaining explaining variables, such as the elevation, potential evaporation or climate (Table 1).
Macroelements
Regarding carbon, the only relevant publication found (Parzych, 2010) stated a lower average C content in fronds of AFF (420 g/kg) growing in wet soils of coniferous forests in comparison to our data from drier forest soils (Table 3). The negative correlations between concentrations of C and of many other elements are due to a dilution of element pools during the growth of the frond biomass.
Nitrogen contents significantly positively correlated with other nutrients—P and S. The C:N ratios (11.9–22.6) were not significantly affected by the site elevation, potential evaporation and soil pH. Literature data (Table 3) are at disposal mainly from Poland, where mostly lower N content has been reported (associated with higher C:N ratios, e.g. about 24.5 in the fronds of AFF from muddy habitats studied by Parzych, 2010).
Contents of P in fronds showed greater variability than N and a wider range than in the most of literature data (Table 3). Fronds from sites with granitic bedrocks had significantly higher P concentrations and lower C:P and N:P ratios due to commonly increased P content in granites. The N:P ratios reflect an instantaneous fern nutritional status and local element uptake limitations (Güsewell, 2004; Koerselman & Meuleman, 1996). The N and P limitations for AFF growth were indicated for 17 and 9 sampling plots, respectively.
The positive correlation of K in fronds with granitic bedrock rather reflects the content of K-feldspar than the total K in the rocks, because liberation of K from some minerals like the white mica can be very slow. Negative correlation with Ca and Mg in fronds and with humus pH may also reflect the influence of bedrocks.
While in our data, fronds from only one site had higher content of Mg than Ca, Czerwiński and Pracz (1995) found higher content of Mg than Ca (5.18 vs. 3.34 g/kg) in fronds of AFF growing in peat soil (i.e. in a probably Mg-poor environment).
Sulphur content in fronds was higher than in the two studies from literature available (Table 3).
Iron contents in fronds are comparable to literature data. Iron is the only element documented to be regionally enriched in the major eastern industrial region between the city Ostrava and the Polish and Slovak borders (see also Fig. 1c). In contrast, the strong pollution in the northwestern region (part of the “Black triangle”) which peaked in the 1980 s has already not unequivocally influenced the distribution of any of the elements analyzed in ferns at the time of collection (2005), although it was still slightly visible in the distribution of elements in moss (Suchara et al., 2017). Similarly, the role of industrial pollution on Fe content in AFF was documented in comparison of various regions in Lithuania and Norway (Stapulionytė et al., 2018).
Contents of Si, playing structural and protective roles in plants, showed a strong positive correlation with humus pH and with many elements in fronds, e.g. Ca, some of which (e.g. Al, Ga, Th, lanthanides, partly Fe) are typical for mineral dust (as also manifested in their spatial distribution in moss—see Suchara et al., 2011, 2017). However, if we consider Al as the representative of mineral (wind-transported) dust, the ratios of other elements to Al can be used to estimate the maximum dust content (see also enrichment factors calculated from ratios of other elements to Al in ESM 6). It follows that the dust may only little contribute to the pools of elements like Si or REEs in the fronds. The Si content in fronds is low mainly on the most quartz-rich sandstones in the northern part of the Bohemian Cretaceous Basin. This can be explained by the fact that Si is mainly liberated by weathering of silicates (like feldspars) and only insignificantly from quartz.
Microelements
Obtained contents of microelements in fronds (Table 2) are comparable with available published data. Some microelements (e.g. B, Cu, Mn, Mo and Zn) in low concentrations serve as essential micronutrients while in higher concentrations they are toxic.
Concentrations of B, Cu and Zn in fronds showed the lowest variability among the trace elements, indicating a physiological control to maintain optimal content, in contrast to highly variable Cs, Li, Th and Be. The most contrasting bedrock type influencing directly trace elements in biomass is granitic rocks (Rb, Cs, Be, Tl, U). Some other rocks may be chemically very contrasting as well (e.g. quartz-rich sandstones, ultrabasic rocks), but the group of sandstones is probably highly heterogeneous (e.g. some of them can be relatively Ca-rich, or intercalated with other sediments), and basic and carbonate substrates are relatively rare in Czech coniferous forests. The trace elements concentrated in granites (Rb, Cs, Be, Tl, U) are the only elements with significant correlation between contents in fronds and those in mineral soil. In literature, an example of bedrock-dominated variability of some elements in AFF fronds was presented by Samecka-Cymerman et al. (2011) from the Giant Mts.
The peak uranium content in fronds at the site 18 (where U is also high in humus but not in mineral soil) in a former U mining area may reflect a contamination by U-enriched dust. Some role of atmospheric deposition and/or historic pollution can be also expected (in addition to gas-forming elements—N, S, Se) for elements whose contents in fronds are significantly correlated to those in humus: Mn, Sb, Sn and Zn. On the other hand, Se in fronds correlates negatively with Se in humus, and S and Zn in fronds correlate negatively with S and Zn, respectively, in mineral soil. This could indicate significant mobility of these elements in the plant-soil system.
Positive correlations like Fe–Ni and Cd-Cu–Zn in fronds may reflect associations of these elements in minerals in both bedrock and soil. Some positive correlations of elements in fronds (e.g. Hg with Al or Fe) which are missing in humus and soil could be explained by other factors, like pH. Significant negative correlations were found seldom (except for those of other elements, e.g. Ba, Cr, Ga, Se, Si and W with C), e.g. Fe-Rb, Na-Pb, K-Pb, K-Hg and Mn-Cd. Negative (with borderline statistical significance, however) correlation of both Ba and Pb with P in fronds may be caused by their decreased bioavailability in phosphorus-rich soils, as documented for Pb (Miretzky & Fernandez-Cirelli, 2008). Humus pH correlates positively with B, Ca, Ce, Ge, Hg, Mg, Th and Si and negatively with Cd, K and Rb. Contents of Rb, Si and Th in fronds correlated positively, and Li and Ni correlated negatively with elevation. Potential evaporation, negatively correlating with elevation (r = –0.70; p < 10^−3^), positively affected Co, Li, Na and Th contents and negatively affected Bi, Cs, Rb and Tl contents.
However, some significant correlations may be accidental due to the coincidence of many factors (e.g. elevation correlates negatively with evaporation and positively with granitic rocks).
Cerium anomalies
The prevalently negative cerium anomalies and the fact that only the three Mn-richest fern samples have significant positive Ce anomalies imply that the fern prevalently takes up REE from solutions. Soil solutions (similar to surface water) tend to be depleted in Ce^3+^ due to its oxidation to little soluble Ce^4+^ which can be bound to Fe- and Mn oxides and hydroxides (Bau & Koschinsky, 2009). No significant relationships of Ce anomalies to the site factors were found.
Bioconcentration factors
In contrast to element contents alone, the bioconcentration factors were frequently significantly influenced by site factors (see also ESM 7). For example, humus pH significantly negatively affected BcF for Ba, Be, Ca, Cd, Co, Cs, K, Mg, Mn, Na, Rb, Sr and Zn, while the elevation showed mainly positive effects on BcF, significantly for Ca, Cs, La, Nd, Pr, Rb, Si, Sr, Tl and Y. Some significant correlations of BcF related to the element contents in humus were found for bedrock types, e.g. negative correlations with sandstones (Cd, Cs, Cu, Ga, Ge and Tl), and positive with granites (Cs, Rb, Tl and U).
The site factors, except for humus pH, influence the BcFs related to mineral soil more (but partly differently) than BcFs related to humus. This is consistent with the assumption that AFF uptakes elements mainly from deeper horizon than humus. Note that in case of two sandstone sites (Nos. 2 and 5), high BcFs simply reflect extremely low contents of most elements in the mineral soil. However, such an explanation cannot be applied to elevated BcFs for elements concentrated in granites at sites with granitic bedrock.
Published BcFs determined in several studies (except for values related to water or mud in wetlands) (Table 3) did not show hyperaccumulation of any element by AFF. BcFs slightly exceeding the value 1.00 for (potentially) toxic elements Cr, Cu, Mn, Ni and Zn were reported seldom. Accumulation of these elements in AFF is explained by the effects of some bedrock types and frequently by increased atmospheric deposition rates of heavy metals at sites affected by industrial emissions (Krawczyk et al., 2006). Our study has not confirmed considerable accumulation of heavy metals in AFF in the country.
Enrichment factors
Due to relatively low Al content and enrichment in Cd, Hg, Bi, Cu, Mo, Pb, Sb and Sn (partly due to atmospheric deposition) in humus, the EFs medians except for REE and alkali elements are higher when related to element contents in soil (mainly in the subsoil) than to that in humus. Elements with no to slight enrichment in fronds were Ag, As, Bi, Cr, Fe, Li, Na, Sb, Sn, Th, U, V and W, mainly if related to the humus element contents. The highest median EFs characterize macronutrients and their analogues (Ba, Ca, Cs, K, Mg, Rb, S, Sr), some micronutrients and toxic elements (Cd, Cu, Hg, Mn, Mo, Zn) and especially REE (La, Ce, Pr, Nd) and Y. Reasons for bioaccumulation of REE in AFF fronds are not clear; however, recent studies admit some beneficial roles of REE in plants (e.g. Kovaříková et al., 2019, and references therein).
Considerable inter-plots EFs variability includes severe enrichment of Ni, Co, Sn and Tl at few sites, and severe enrichments of Cd, Cu, Hg, Mo and Zn at many sites. pH in humus and partly in the topsoil negatively correlated with EFs for many elements (mainly Ca, Cd, Mg) when related to elements in various soil horizons. Significant influence of other site factors on EFs related to humus, topsoil or subsoil was limited to few elements. Potential evaporation had negative effects on all EFs of Rb. Sandstone bedrocks positively affected EFs (related to subsoil) for Fe, Mg, Mn, Na, Ni and Zn, while EFs of Cs, Rb, Tl and U (related to humus) positively correlated with granite bedrocks.
Conclusions
Median EF values showed bioaccumulation of Ca, K, Mg, Mn, Ba, Rb, Y and REEs in fronds of AFF populations across the country. Not considering macronutrients, the greatest median EF values (ca. 100–500) (in relation to humus and normalized by Al) were obtained for Rb, La, Pr, Nd and Ce, while Cu, Zn, Mn, Mo, Ba, Sr, Cd, Cs, Tl and Y have median EFs between 10 and 100. Significant accumulation of the remaining microelements was not indicated (EFs < 10). REEs are accumulated in AFF fronds very strongly in comparison to other little soluble elements like Al; however, from the viewpoint of bioconcentration factors (all median BCFs < 10), AFF cannot be denoted as a hyperaccumulator of any of the trace elements analyzed. Our results indicate that AFF is rather an excluder of Na, Al, Fe and many trace elements (Ag, As, Bi, Cr, Li, Sb, Sn, Th, U, V and W).
Supplementary information
Below is the link to the electronic supplementary material.Supplementary file1 (XLSX 41.8 KB)Supplementary file2 (DOCX 20 KB)Supplementary file3 (XLSX 105 KB)Supplementary file4 (XLSX 42 KB)Supplementary file5 (XLSX 96 KB)Supplementary file6 (XLSX 94 KB)Supplementary file7 (DOCX 47 KB)Supplementary file8 (JPG 2720 KB)
The reference list from the paper itself. Each links out to its DOI / PubMed record.
- 1ČGS (2024). Geologická mapa ČR 1: 50 000. (Geological map of the Czech Republic 1 : 50,000). Czech Geological Survey, Prague. Available on-line at https://mapy.geology.cz/geo/
- 2Kaplan, Z., Koutecký, P., Danihelka, J., Šumberová, K., Ducháček, M., Štěpánková, J., Ekrt, L., Grulich, V., Řepka, R., Kubát, K., Mráz, P., Wild, J., & Brůna, J. (2018).Distribution of vascular plants in the Czech Republic. Part 6. Preslia, 90(3), 235–346. 10.23855/preslia.2018.235
- 3Larsen, J.A. (1982). Ecology of the Northern Lowland Bogs and conifer forests. Acad. Press, New York – Toronto, p. 117.
- 4Stapulionytė, A., Lazutka, J.R., Orland, A., Naujalis, J.R., & Krøkje, A. (2018). RAPD analysis of the lady fern (Athyrium filix-femina L.) from industrial and natural recreational areas in Lithuania and Norway. Poster presented at the 7th Baltic Genetics Congress, University of Latvia, Riga. Available at https://www.researchgate.net/publication/328615869_RAPD_analysis_of_the_lady_fern_Athyrium_filix-femina_L_from_industrial_and_natural_recreational_areas_in_Lithuania_and_Norway
- 5Vtorova, V.N., & Solntseva, O.N. (1983). Role of herbaceous cover in exchange processes in coniferous forests. Biology Bulletin of the Academy of Science of the USSR 9(3), 222–228. (Translated from Izvestiya Akademii Nauk SSSR, serija Biologicheskaia 9(3): 341–348, 1982).