Cost-effectiveness analysis of population-based BRCA1/2 testing, family-history-based BRCA1/2 testing, and symptom-based screening for breast and ovarian cancer in China
Feilong Zhao, Shu Wang, Jianfei Lu, Xiangying Feng, Liwei Ran, Jianjun Yang

TL;DR
Adding BRCA1/2 testing based on family history to cancer screening in China is cost-effective and improves outcomes compared to symptom-based screening alone.
Contribution
This study evaluates the cost-effectiveness of BRCA1/2 testing strategies in China for breast and ovarian cancer screening.
Findings
Family-history-based BRCA1/2 testing is cost-effective with a 76.96% probability of effectiveness.
Population-based BRCA1/2 testing is not cost-effective with only a 0.8% probability of effectiveness.
Symptom-based screening alone is less effective compared to family-history-based BRCA1/2 testing.
Abstract
The women’s cancer screening program has been operational for several years in China, primarily utilizing palpation and ultrasound. Given the proven impact of BRCA1/2 mutations on the incidence of breast and ovarian cancer, the cost-effectiveness of incorporating BRCA1/2 mutation testing into these programs, either for the entire population or through enrichment based on family history of breast and ovarian cancer, remains poorly researched. We constructed a decision tree model to compare the cost-effectiveness of three strategies: symptom-based screening only (Symptom-only strategy), population-based BRCA1/2 testing (population-based strategy), and family-history-based BRCA1/2 testing (FH-based strategy). One-way and probability sensitivity analyses enabled model uncertainty evaluation. Outcomes included early and advanced stages of ovarian and breast cancer. Cost, quality-adjusted…
Genes, proteins, chemicals, diseases, species, mutations and cell lines named across the full text — each resolved to its canonical identifier and authoritative record.
Click any figure to enlarge with its caption.
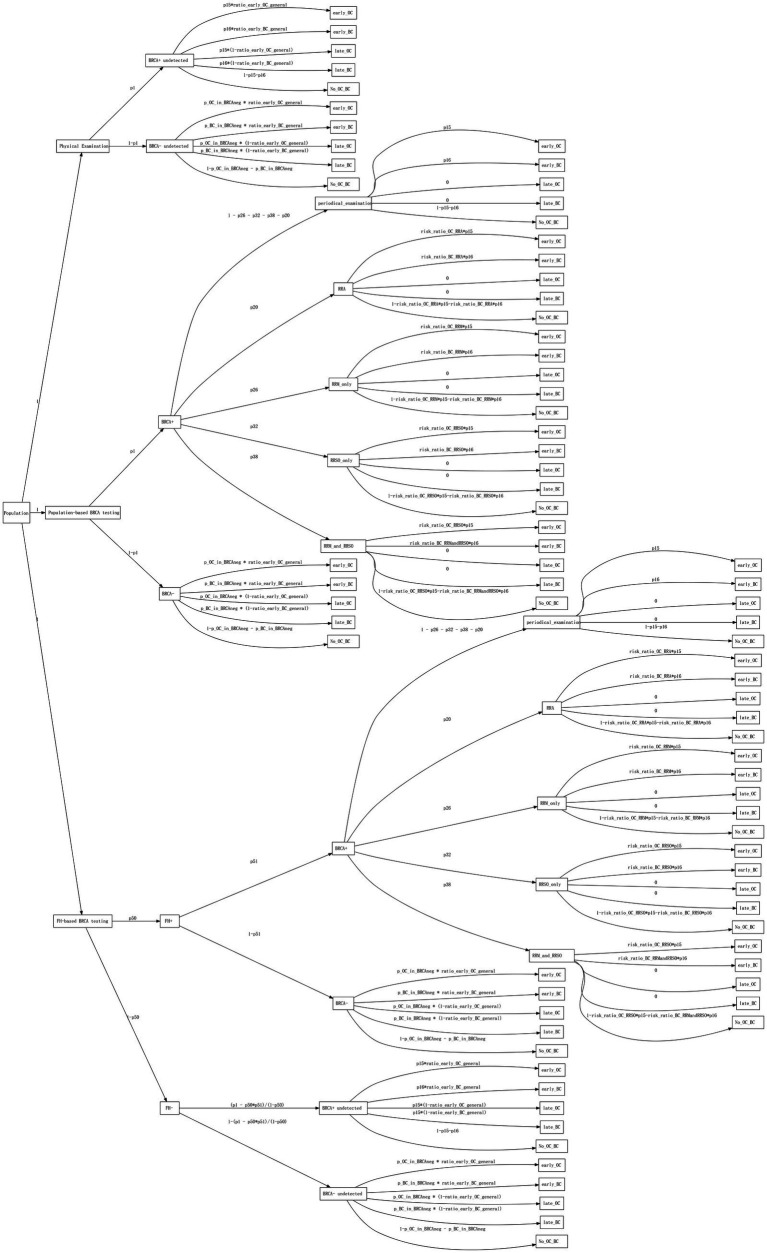 Figure 1
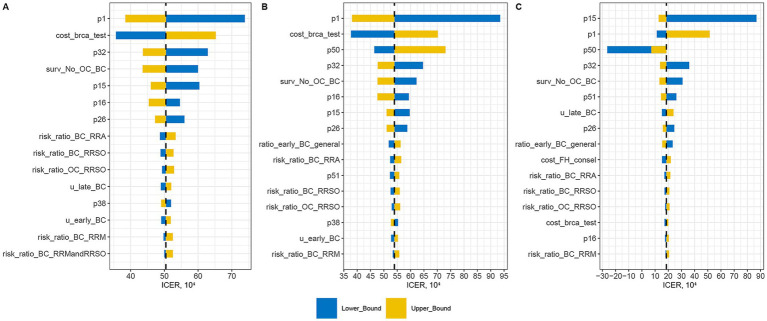 Figure 2
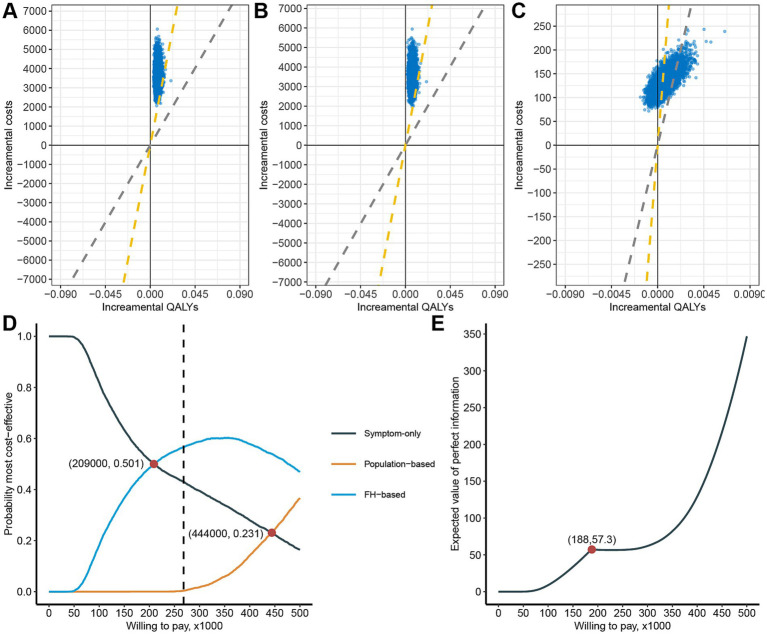 Figure 3
| ID | Value | 95%CI | Description | Source |
|---|---|---|---|---|
| Probability | ||||
| p1 | 0.003965 | 0.002690–0.005240 | ( | |
| p15 | 0.130385 | 0.069231–0.166615 | Risk of developing ovary cancer in | ( |
| p16 | 0.374000 | 0.333–0.434 | Risk of developing breast cancer in | ( |
| p_BC_general | 0.036000 | Risk of developing ovary cancer in general women | ( | |
| p_OC_in_BRCAneg | 0.004000 | 0.003–0.007 | Risk of developing ovary cancer in | ( |
| p_BC_in_BRCAneg | 0.034654 | risk of developing breast cancer in | ( | |
| ratio_early_OC_general | 0.300000 | Ratio of early-stage cancer in ovary cancer screened | ( | |
| ratio_early_BC_general | 0.621000 | Ratio of early-stage cancer in breast cancer screened | ( | |
| p20 | 0.163000 | 0.136–0.19 | Uptake rate of chemoprevention in | ( |
| p26 | 0.211500 | 0.0815–0.3015 | Uptake rate of RRM-only in | ( |
| p32 | 0.291500 | 0.0415–0.4915 | Uptake rate of RRSO-only in | ( |
| p38 | 0.258500 | Uptake rate of both RRSO and RRM in | ( | |
| risk_ratio_OC_RRA | 0.530000 | 0.41–0.67 | Risk ratio for ovary cancer from RRA in | ( |
| risk_ratio_BC_RRA | 0.640000 | 0.40–1.03 | Risk ratio for breast cancer from RRA in | ( |
| risk_ratio_OC_RRM | 1.000000 | Risk ratio for ovary cancer from RRM in | ||
| risk_ratio_BC_RRM | 0.114000 | 0.041–0.317 | Risk ratio for breast cancer from RRM in | ( |
| risk_ratio_OC_RRSO | 0.210000 | 0.12–0.39 | Risk ratio for ovary cancer from RRSO in | ( |
| risk_ratio_BC_RRSO | 0.490000 | 0.37–0.65 | Risk ratio for breast cancer from RRSO in | ( |
| risk_ratio_BC_RRMandRRSO | 0.050000 | 0.01–0.22 | Risk ratio for breast cancer from RRM and RRSO in | ( |
| p50 | 0.009800 | 0.0047–0.0179 | Prevalence of family history of OC/BC in general population | ( |
| p51 | 0.100000 | |||
| Utility | ||||
| early_OC | 0.81 | Utility for early-stage ovary cancer | ( | |
| early_BC | 0.71 | Utility for early-stage breast cancer | ( | |
| late_OC | 0.55 | Utility for advance-stage ovary cancer | ( | |
| late_BC | 0.65 | Utility for advance-stage breast cancer | ( | |
| No_OC_BC | 1 | Utility for health women | ||
| RRM (year 1) | 0.88 | First year utility of RRM | ( | |
| RRSO (year 1) | 0.95 | First year utility of RRSO | ( | |
| 10-years survival rate | ||||
| early_OC | 0.388 | 0.379–0.398 | 10-years survival rate for early-stage ovary cancer | |
| early_BC | 0.739 | 0.736–0.741 | 10-years survival rate for early-stage breast cancer | |
| late_OC | 0.176 | 0.163–0.191 | 10-years survival rate for advance-stage ovary cancer | |
| late_BC | 0.603 | 0.599–0.607 | 10-years survival rate for advance-stage breast cancer | |
| No_OC_BC | 0.977658738 | 10-years survival rate for health women | ( | |
| Cost, ¥ | ||||
| cost_general_examination | 400 | Cost of clinical encounter and ultrasonography | ( | |
| cost_periodical_examination | 1,500 | cost of mammography for 3 consecutive years | ( | |
| cost_FH_consel | 80 | Cost of family history counseling | ( | |
| cost_brca_test | 3,600 | Cost of BRCA testing | ( | |
| cost_rra | 536 | Cost of RRA | ( | |
| cost_rrm | 5,414 | Cost of RRM | ( | |
| cost_rrso | 26,881 | Cost of RRSO | ( | |
| cost_hrt | 4,200 | Cost of hormone replacement therapy (HRT) | ( | |
| cost_diagnosis_cancer | 1,600 | Cost of definitive diagnosis of cancer | ( | |
| Strategy | Cost, ¥ | QALY | ICER, ¥/QALY |
|---|---|---|---|
| Symptom-only strategy | 465 | 9.5587 | Control |
| Population-based BRCA testing strategy | 4,142 | 9.5660 | 504,476 |
| FH-based BRCA testing strategy | 599 | 9.5594 | 185,710 |
| Scenario | Symptom-based strategy | Population-based strategy | FH-based strategy | ICER | |||||
|---|---|---|---|---|---|---|---|---|---|
| Cost | QALY | Cost | QALY | Cost | QALY | Population-based versus symptom-only | Population-based versus FH-based | FH-based versus symptom-only | |
| Adjust cost of | |||||||||
| Cutoff at ¥1,878 | 465 | 9.558696 | 2,420 | 9.565985 | 582 | 9.559417 | 268,200 | 279,827 | 162,305 |
| Cutoff at ¥1,808 | 465 | 9.558696 | 2,350 | 9.565985 | 581 | 9.559417 | 258,575 | 269,250 | 161,352 |
| Increase risk of cancer to lifetime | |||||||||
| p15 to 0.202 | 465 | 9.556379 | 4,142 | 9.565071 | 599 | 9.557765 | 423,062 | 484,937 | 96,729 |
| p16 to 0.644 | 467 | 9.553307 | 4,143 | 9.564246 | 600 | 9.553733 | 336,059 | 337,004 | 312,719 |
| p15 and p16 | 467 | 9.550991 | 4,143 | 9.563332 | 598 | 9.552081 | 297,857 | 314,870 | 122,241 |
| Use the FH rate reported in China | |||||||||
| FH + rate to 0.32% | 465 | 9.558696 | 4,142 | 9.565985 | 722 | 9.564301 | 504,476 | 2,031,108 | 45,921 |
Peer Reviews
No public reviews on file for this paper yet. If you reviewed it on a platform where reviews are public (OpenReview, ICLR, NeurIPS, ICML), you can paste yours below so the community can read it here.
Videos
No videos yet. Explain this paper in a talk, walkthrough, or lecture? Add one.
Taxonomy
TopicsBRCA gene mutations in cancer · Nutrition, Genetics, and Disease · Ovarian cancer diagnosis and treatment
Introduction
1
As China progressively establishes its cancer prevention and screening system, the National Cancer Center of China has consecutively released national cancer statistics for the years 2016 and 2022 (1, 2). These reports reveal that breast cancer is one of the most prevalent cancers among women, with its incidence rate increasing by 42% over the past five years (from 29.5 per 100,000 to 51.17 per 100,000). This significant rise not only imposes a considerable economic burden on healthcare but also highlights trends in cancer development and prevention. These trends are primarily reflected in two aspects: firstly, the aging population phenomenon is leading to a higher incidence of cancer among the older adult; secondly, with the increase in public health awareness and improvements in medical conditions, more people are actively participating in cancer screenings, leading to the early detection of many cancer cases.
Enhancing the detection rate of early-stage breast cancer and its precancerous lesions, followed by timely and effective treatment, is crucial for improving breast cancer prognosis and reducing mortality rates. The Chinese government has initiated several national breast cancer screening programs targeting both the general population and individuals at moderate-to-high risk (3, 4). These programs employ a combination of clinical methods, including visual inspection, physical palpation, and advanced imaging techniques such as breast ultrasonography or mammography. However, none of the existing screening programs have incorporated genetic testing for hereditary mutations, particularly pathogenic variants in the BRCA1/2 genes, despite their well-established role as major risk factors for breast and ovarian cancer (5–9).
Studies show that approximately 6% of breast cancers can be attributed to hereditary BRCA1/2 gene mutations (10), and women carrying BRCA1/2 mutations have a 69–72% risk of developing breast cancer by the age of 80 (8). Women with BRCA1/2 mutations can opt for prophylactic surgeries (such as mastectomy and salpingo-oophorectomy), chemoprevention, and intensive breast imaging surveillance to reduce their cancer risk (11, 12). Research indicates that chemoprevention can lower the risk of breast cancer by 40–50% (13, 14), mastectomy can reduce the risk by 90–95% (15, 16), and salpingo-oophorectomy can decrease the risk of ovarian cancer by 79–96% (17–19). Therefore, understanding an individual’s genetic mutation status is crucial for the prevention and management of breast cancer. The National Comprehensive Cancer Network (NCCN) has developed various breast cancer risk assessment models based on personal history, family history, age, gender, and germline mutations (20). In recent years, increasing research efforts have been directed towards exploring BRCA1/2 testing strategies for all breast or ovarian cancer patients and for the general population (21, 22).
However, the cost-effectiveness of BRCA1/2 testing varies significantly based on the target population, the economic level of the country, and cultural context. Several studies have shown that incorporating BRCA1/2 testing in population-based breast and ovarian cancer screening is cost-effective in some high-income countries (21, 23). Additionally, including other genes such as BRCA1, BRCA2, and PALB2 have also been found to be cost-effective (24–26). In contrast, in middle-income countries like China, the cost-effectiveness of this approach remains uncertain due to several factors. These include a relatively lower GDP per capita, higher costs associated with gene testing and preventive treatments, and varying levels of acceptance of preventive treatments among local women. This study aims to evaluate the feasibility of incorporating BRCA1/2 testing into breast cancer screening in China by comparing the cost-effectiveness of three strategies: symptom-based screening alone (Symptom-only strategy), population-based BRCA1/2 testing (population-based strategy), and family-history-based BRCA1/2 testing (FH-based strategy).
Materials and methods
2
Model construction
2.1
We constructed a decision tree model comprising three main branches: Symptom-only strategy, Population-based strategy, and FH-based strategy, with five leaf nodes: ovarian cancer detected at early-stage (early_OC), breast cancer detected at early-stage (early_BC), ovarian cancer detected at late-stage (late_OC), breast cancer detected at late-stage (late_BC), and no ovarian or breast cancer detected (Figure 1).
The decision tree model. The boxes contain root, branches, and leaf nodes. The text above the edges represents probabilities or probability formulas.
For the Symptom-only strategy, since individuals’ BRCA1/2 status was unknown, the decision tree branched into BRCA+ undetected and BRCA- undetected based on the frequency of BRCA1/2 mutations in the population. No further interventions were initiated until events occurred. For the population-based strategy, all individuals underwent BRCA1/2 gene testing. Those who tested positive for BRCA1/2 mutations (BRCA+) were further categorized based on intervention measures such as increased surveillance, risk-reducing agents (RRA), and risk-reducing surgeries such as mastectomy (RRM) or salpingo-oophorectomy (RRSO). For those who tested negative for BRCA1/2 mutations (BRCA−), no further interventions were undertaken. In the FH-based strategy, the decision tree initially branched into FH positive (FH+) and FH negative (FH−) based on family history counseling results. Subsequently, individuals in the FH + branch underwent BRCA1/2 testing, and intervention measures were implemented based on the test results. Conversely, individuals in the FH− branch did not undergo any intervention until events occurred.
Model parameters
2.2
The model encompassed four main categories of parameters: probabilities of events occurring, costs, utilities, and life expectancy.
The model primarily included three types of probabilities: (1) Frequencies of events in the population, including BRCA1/2 pathogenic mutation frequency in the population (7), FH + population frequency (25), BRCA1/2 pathogenic mutation frequency among FH + individuals, and proportion of early-stage patients among those who screened positive (27–29). (2) Uptake rates of RRA, RRM, and RRSO in BRCA1/2 pathogenic mutation carriers (30–32). (3) Risk of developing breast and ovarian cancer by age 70 among carriers of BRCA1/2 pathogenic mutations and BRCA-negative women (5, 6). These probabilities were derived from articles related to breast and ovarian cancer screening found on PubMed and the China National Knowledge Infrastructure (CNKI).
Our analysis was conducted from a payer’s perspective, incorporating only direct medical care costs obtained from government document (33, 34). All costs were reported in Chinese Yuan (¥). Costs included clinical encounter, ultrasonography testing, and definitive diagnosis of suspected cancer for the Symptom-only strategy. The population-based and FH-based strategies incurred additional costs for genetic testing and family history inquiries. BRCA1/2 carriers further incurred costs for regular monitoring and preventive treatments.
Quality-adjusted life years (QALYs), which integrate both mortality and health-related quality-of-life effects, were calculated using the formula: QALY = (life-years survived) * utility. Utilities for different health states and surgical interventions were obtained from previous research (35–37). A time horizon of 10 years was chosen based on studies suggesting that this period is sufficient to observe mortality reductions in organized breast cancer screening programs (38). Considering the Chinese Anti-Cancer Association’s recommendation that breast cancer screening should commence at age 40 for individuals at general risk, we extrapolated the 10-year survival rates for breast and ovarian cancer patients diagnosed after age 40 from the SEER database (Supplementary Tables 1, 2; Supplementary Figure 1). We estimated the 10-year survival rates for the general Chinese population using 2019 data from the WHO life table (39).
Model evaluation
2.3
To evaluate a decision analysis tree, the expected value of each branch is calculated by multiplying the payoff associated with each transition by the probability of its occurrence, then summing these values. Using this method, we separately computed the Quality-Adjusted Life Years (QALYs) and costs for each of the three strategies. Subsequently, we derived the incremental cost-effectiveness ratio (ICER), which represents the cost per QALY gained. We used three times the Gross Domestic Product (GDP) per capita as the willingness-to-pay (WTP) threshold, i.e., ¥268,200. An ICER greater than this threshold suggests that the strategy lacks cost-effectiveness.
Sensitivity analysis
2.4
Sensitivity analysis was employed to explore the uncertainty and robustness of the model results. One-way sensitivity analysis assessed the impact of varying a single parameter on the outcomes. Parameters including probabilities, utilities, and survival rates were varied within their 95% confidence intervals (CIs) where available, or by ±10%. Cost parameters were independently varied by ±30%. Recognizing that model parameters often vary together rather than independently, we also conducted probability sensitivity analysis (PSA). PSA utilized appropriate probability distributions recommended in the literature: beta distributions for probabilities, gamma distributions for costs, and log-normal distributions for utilities and survival rates. The PSA involved running 5,000 iterations of simulation, each time sampling from the distributions of the model parameters. This approach generated 5,000 estimates, allowing us to assess the distribution and uncertainty around the model outcomes comprehensively.
Scenario analysis
2.5
Scenario analysis is a useful tool to explore the impact of uncertainties that are not explicitly modeled probabilistically. In our study, we conducted scenario analyses to test key assumptions and their influence on the results. (1) Population prevalence of BRCA1/2 mutation: We varied this parameter from 0.003965 to 0.00677, aligning it with levels observed in the United States. (2) Risk of developing ovarian cancer: We explored the impact of extending the risk calculation from age 70 to lifelong, setting the risk for BRCA1/2 carriers at 0.202. (3) Risk of developing breast cancer: Similarly, we analyzed the effect of extending the risk calculation from age 70 to lifelong, with the risk for BRCA1/2 carriers set at 0.644. (4) Combined risk of ovarian and breast cancer: We examined the scenario where the risks of developing both ovarian and breast cancer were considered simultaneously over a lifetime. (5) Prevalence of FH + in the population: We tested scenarios ranging from 0.0089 to 0.032, using the highest reported rate (40).
Data visualization
2.6
We employed three commonly used types of figures to illustrate the cost-effectiveness results: the cost-effectiveness plane, cost-effectiveness acceptability curve (CEAC), and the expected value of perfect information (EVPI) plot. In addition, deterministic sensitivity analyses were depicted using a Tornado diagram. This diagram ranks input parameters in descending order of their impact on model outcomes, illustrating sensitivity to changes in each parameter. All visualizations were created using R packages ggplot2, ggpubr, and survminer.
Results
3
Target population and main parameters
3.1
This study focused on breast and ovary cancer screening for Chinese women aged 40–60 years, aimed at early diagnosis to improve patient outcomes. The study’s model design and parameter settings were based on this premise. The time horizon was set to 10 years.
The mutation rate of BRCA1/2 in Chinese women, a crucial factor influencing screening strategies, was set at 0.3965% based on health examination results from 9,331 Han Chinese women (41). A slightly earlier study using next-generation sequencing reported a similar rate of 0.3835% among 1,043 healthy women (40). Of note, an important assumption of this study was the uniform mutation rate of BRCA1/2 across the entire population for each screening strategy.
The risk of developing breast and ovarian cancer in Chinese women was another pivotal factor in shaping screening strategies. Given our target demographic of women aged 40–60 years over a 10-year period, we considered the probability of developing breast and ovarian cancer by the age of 70, rather than lifetime risk. The cumulative risk of breast cancer by age 70 was derived from the report of Beijing Municipal People’s Government and previous reports for general Chinese women and BRCA1/2 carriers, respectively (5, 42). Ovarian cancer risks were estimated using a kin-cohort design based on data from 9,903 Chinese breast cancer patients and 3,984 related families (6). These data are also referenced in the “China Expert Consensus on Familial Hereditary Tumors” (43), indicating widespread acceptance among Chinese experts.
A critical parameter was the positivity rate of family history. A study reported a positivity rate of 0.032 for family history of breast and ovarian cancer in healthy Chinese population (40). However, we think this is an outlier. From previous Chinese report (44, 45), we can estimate that family history-positive patients contributed around 28.97% of BRCA1/2 mutations in breast cancer cases. Assuming a 3.2% positivity rate for family history, family history-positive individuals contributed to 83.44% of BRCA1/2 mutations in breast cancer cases, approximately 2.88 times higher. Therefore, we adopted previously reported data from the Australian Breast Cancer Family Registry for family history positivity rates, which is 0.0098 (25). Based on this value, family history-positive individuals contributed 25.55% of BRCA1/2 mutations, aligning reasonably with breast cancer data.
Another important parameter was the 10-year survival rate, based on breast and ovarian cancers diagnosed between 2000 and 2013 in the SEER 8 registries database. This database included 162,253 breast cancer patients and 12,732 ovarian cancer patients aged 40 and above. Patients were categorized into early and late stages based on lymph node metastasis (Supplementary Tables 1, 2). The 10-year survival rates for ovarian cancer were 0.388 (95% CI 0.379–0.398) and 0.176 (95% CI 0.163–0.191) for early and late stages, respectively (Supplementary Figure 1A). For breast cancer, the rates were 0.739 (95% CI 0.736–0.741) and 0.603 (95% CI 0.599–0.607) for early and late stages, respectively (Supplementary Figure 1B). Importantly, these data closely align with an 8-year survival rate observed in a small-scale clinical cohort of breast cancer patients in China (46). Full parameters were specified in Table 1.
Base-case analysis
3.2
In the study, the three strategies (Symptom-only strategy, Population-based strategy, and FH-based strategy) incurred total costs of ¥465, ¥4,142, and ¥599, respectively. The corresponding QALYs were 9.5587, 9.5660, and 9.5594 years (Table 2). Compared to the Symptom-only strategy, the Population-based strategy extended QALYs by 0.0073 years, equivalent to 2.66 days, at an additional cost of ¥3,677. This resulted in an ICER of 504,476, which was 1.88 times higher than the WTP threshold of ¥268,200. Compared to the FH-based strategy, the Population-based strategy gained an additional 0.0066 years (2.41 days) of QALYs at an extra cost of ¥3,543, resulting in an ICER of 539,476, which exceeded twice the WTP threshold.
Importantly, when comparing the FH-based strategy with the Symptom-only strategy, an ICER of 185,710 was derived. The FH-based strategy gained 0.0007 years (0.26 days) of QALYs at an additional cost of ¥134, indicating that the FH-based strategy was the most cost-effective option.
Sensitivity analysis
3.3
One-way sensitivity analyses
3.3.1
A total of 42 variables were analyzed to assess their impact on three sets of ICERs: Population-based strategy versus Symptom-only (Figure 2A), Population-based strategy versus FH-based strategy (Figure 2B), and FH-based strategy versus Symptom-only (Figure 2C).
One-way sensitivity analysis assessing impact of variables on three sets of ICERs: Population-based strategy versus Symptom-only (A), Population-based strategy versus FH-based strategy (B), and FH-based strategy versus Symptom-only (C).
The variable with the greatest impact on the ICER of the Population-based strategy was the prevalence of BRCA1/2 mutation in the general Chinese women (p1). A higher p1 value corresponded to greater cost-effectiveness of the Population-based strategy. Other significant probability factors included breast cancer risk for BRCA1/2 carriers (p16), ovarian cancer risk for BRCA1/2 carriers (p15), uptake rate of RRM (p26), and uptake rate of both RRM and RRSO in BRCA1/2 carriers (p32). Higher values of these variables also enhanced the cost-effectiveness of the Population-based strategy. Among cost variables, the cost of BRCA1/2 testing was the second most influential factor on the ICER of the Population-based strategy. However, even with a 30% reduction in testing costs, the Population-based strategy remained cost-ineffective. Further analysis indicated that the strategy became cost-effective only when testing costs decreased by 48% (i.e., ¥1,878).
For the ICER of the FH-based strategy, the variable with the greatest impact was the ovarian cancer risk for BRCA1/2 carriers (p15). An increase in p15 significantly raised the ICER, while a decrease had a less pronounced effect. The prevalence of BRCA1/2 mutation in general Chinese women (p1), the prevalence of breast/ovary cancer family history in general Chinese women (p50), and the BRCA1/2 mutation prevalence in FH + population (p51) were interrelated and affected the ICER of the FH-based strategy. Generally, the ICER decreased with an increase in the FH + rate. However, when the FH + rate was too low (<0.0065), a high BRCA1/2 + rate in the FH− population led to lower QALYs compared to the Symptom-only strategy, resulting in a negative ICER (Supplementary Figure 2). Besides, the cost of BRCA1/2 testing had a minimal impact on the ICER of the FH-based strategy.
Probabilistic sensitivity analysis
3.3.2
We conducted a Monte Carlo simulation 5,000 times using variables generated from corresponding distributions. We evaluated three strategies: Population-based strategy versus Symptom-only strategy (Figure 3A), Population-based strategy versus FH-based strategy (Figure 3B), and FH-based strategy versus Symptom-only strategy (Figure 3C). The probability of being cost-effective for these strategies were 0.74, 0.80, and 76.96%, respectively.
Probability sensitivity analysis of cost-effectiveness of the three strategies. Cost-effective planes of population-based strategy versus Symptom-only (A), Population-based strategy versus FH-based strategy (B), and FH-based strategy versus Symptom-only (C), The yellow dashed diagonal line represents WTP cutoff. Cost-effectiveness acceptability curve of the three strategies (D). The expected value of perfect information plot (E).
From a net monetary benefit perspective, the FH-based strategy becomes economically favorable compared to the Symptom-only strategy when WTP exceeds ¥209,000, emerging as the most cost-effective strategy (Figure 3D). Similarly, the Population-based strategy begins to surpass the Symptom-only strategy economically when WTP exceeds ¥444,000, although it remains less cost-effective than the FH-based strategy. Notably, at the current WTP threshold, the probabilities of being most cost-effective are 43.00% for the Symptom-only strategy, 0.34% for the Population-based strategy, and 56.6% for the FH-based strategy.
Since cost-effectiveness acceptability curves do not account for the magnitude of cost and QALY gains, we conducted an expected value of perfect information (EVPI) analysis. The EVPI increases with higher WTP thresholds, reaching a local maximum of 57.3 at WTP equal to ¥188,000 (Figure 3E). This suggests that consumers have a higher willingness to pay to eliminate uncertainty at this specific WTP threshold.
Scenario result
3.4
Given that the cost of BRCA1/2 testing is a controllable variable, we examined two critical scenarios (Table 3). When the cost of BRCA1/2 testing decreases to ¥1,878 (a 48% reduction), the Population-based strategy becomes cost-effective compared to the Symptom-only strategy. Further reduction in testing costs to ¥1,808 (a 50% reduction) makes the Population-based strategy cost-effective compared to the FH-based strategy. Conversely, the cost of BRCA1/2 testing has a minimal impact on the ICER of the FH-based strategy versus Symptom-only strategy, only becoming cost-ineffective when costs exceed ¥9,670.
Considering our estimates of the probability of BRCA1/2 carriers developing ovarian cancer (p15) and breast cancer (p16) until age 70, which are significantly lower than lifetime rates reported in other studies, we explored three scenarios (Table 3): increasing p15 to 0.202, increasing p16 to 0.644, and increasing both p15 to 0.202 and p16 to 0.644. In all three scenarios, the ICER of the Population-based strategy decreased significantly, with the third scenario showing an ICER of ¥297,857, approaching cost-effectiveness.
Finally, we examined an extreme scenario where the prevalence of positive family history increased to 0.32% (Table 3). This did not affect the ICER of the Population-based strategy compared to the Symptom-only strategy. However, it significantly improved the cost-effectiveness of the FH-based strategy (ICER of Population-based strategy against FH-based strategy increased to ¥2,031,108, and ICER of FH-based strategy against Population-based strategy decreased to ¥45,921).
Discussion
4
In China, the women’s cancer screening program has been operational for several years, primarily utilizing basic clinical visual inspection, palpation, and breast color Doppler ultrasound. Given the proven impact of BRCA1/2 germline mutations on the incidence of breast and ovarian cancer, integrating BRCA1/2 mutation testing into screening programs has become imperative. However, whether incorporating it into these programs is cost-effective, either for the entire population or through enrichment based on family history of breast and ovary cancer, remains poorly researched. This study explored the cost-effectiveness of three strategies: Symptom-only strategy, Population-based strategy, and FH-based strategy, for breast and ovarian cancer screening in women aged 40–60. It was found that under a threshold of 3 times GDP per capita, the FH-based strategy demonstrated economic viability, with a probability of 73.42%. Its cost-effectiveness was influenced significantly by the proportion of BRCA1/2 mutation carriers, the risk of developing ovary cancer in BRCA1/2 carriers, and the proportion of FH-positive individuals, while factors such as the cost of BRCA1/2 testing had a lesser impact. When considering lifetime cancer risks, the FH-based strategy showed even greater economic efficiency. Conversely, the Population-based strategy did not demonstrate cost-effectiveness.
The integration of BRCA1/2 mutation testing into female breast and ovarian cancer screening has been extensively researched and deemed cost-effective, predominantly based on data from developed countries like the US and UK (24, 25, 47, 48). Studies specific to middle-income countries, such as those using data from Mexico and Brazil, differ significantly from Chinese data (23, 47). Sensitivity analyses highlighted the BRCA1/2 mutation frequency as a critical variable. In China, the BRCA1/2 mutation frequency is moderate globally, lower than in the Ashkenazi Jewish population (2.17%) and higher than in Japanese (0.26%), Malaysians (0.18%), and the Mexican population (0.38%) (41, 49). Moreover, the types of BRCA1/2 mutations also differ substantially from foreign data (41, 44), likely contributing to discrepancies in breast and ovarian cancer risk for BRCA1/2 carriers in China. The breast and ovarian cancer incidence rates among Chinese women up to age 70 are 37.40 and 13.04%, respectively, which are more applicable to our target population (women aged 40–60) and notably lower than lifetime risk used in most literature (24–26). When considering lifetime risks, the FH-based strategy became more economically viable, while the Population-based strategy did not.
Decision trees and Markov chains are commonly used models in health economics research. Prior studies using Markov chain models have typically focused on patient outcomes rather than cancer diagnosis endpoints (23, 26, 47), diverging from our study’s focus on prevention through large-scale screening to identify BRCA1/2 carriers and reduce cancer incidence probability through intensive follow-up and intervention. Defining cancer diagnosis as an endpoint (leaf nodes) better reflects this objective. Furthermore, our study refined the endpoint by distinguishing cancer diagnoses into early and late stages to further reflect the value of early detection.
Our study considered data accuracy and model applicability comprehensively. Nevertheless, some crucial factors influencing conclusions are beyond our control. Foremost is the accuracy of the proportion of FH-positive individuals. We utilized data from Australia, which is logically more reasonable but not directly applicable to China, hence hindering precise results. Despite reports on the proportion of FH-positive patients among breast cancer patients, comprehensive data on FH-positive individuals across the entire population are lacking. Moreover, the probability of BRCA1/2 carriers undergoing preventive treatment was based on previous literature (14, 30, 50), lacking precise Chinese data. Nonetheless, only when the uptake rate of RRSO in BRCA1/2 carriers drop to 0.1243 (a decrease of 57.36%), does the FH-based strategy no longer exhibit cost-effectiveness. Thus, it is highly unlikely to overturn our conclusion. Additionally, we did not account for the risk of synchronous breast and ovarian cancers in BRCA1/2 carriers. Although the incidence of double primaries (0.27%) is relatively low, and the probability of synchronous diagnoses (within one year) accounts for 32.75% of cases (derived from SEER). This may have led to a slight overestimation of breast and ovarian cancer risks. Furthermore, we treated carriers of BRCA1/2 variants of uncertain significance (VUS) as having the same risk as BRCA1/2 wild-type individuals, consistent with current guidelines that classify VUS as uninformative for cancer risk stratification and management (20). However, the inherent uncertainty surrounding VUS reflects limitations in current knowledge and data (51). We expect that future studies with more comprehensive VUS characterization will enable a more accurate assessment of their clinical and health-economic implications. Finally, given the complexity of therapeutic interventions, our current study is intentionally focused exclusively on the domain of cancer prevention. We have not included economic evaluations of various post-diagnosis treatment strategies currently. Consequently, our analysis does not yet enable comprehensive health economic assessments covering the full lifecycle of prevention and treatment for BRCA1/2 mutation carriers.
Overall, in breast and ovarian cancer screening programs for women in China, incorporating BRCA1/2 genetic testing for individuals with a family history, along with appropriate preventive measures for those who test positive, increases the population’s QALY by 0.26 days. The corresponding ICER is ¥185,710, which is well below three times the per capita GDP, indicating cost-effectiveness and making it worthy of promotion in China.
The reference list from the paper itself. Each links out to its DOI / PubMed record.
- 1Zheng RS Chen R Han BF Wang SM Li L Sun KX. Cancer incidence and mortality in China, 2022. Zhonghua Zhong Liu Za Zhi. (2024) 46:221–31. doi: 10.3760/cma.j.cn 112152-20240119-00035, PMID: 38468501 · doi ↗ · pubmed ↗
- 2Zheng RS Zhang SW Sun KX Chen R Wang SM Li L. Cancer statistics in China, 2016. Zhonghua zhong liu za zhi [Chinese journal of oncology]. (2023) 45:212–20. doi: 10.3760/cma.j.cn 112152-20220922-00647, PMID: 36944542 · doi ↗ · pubmed ↗
- 3He J Chen WQ Li N Shen HB Li J Wang Y. China guideline for the screening and early detection of female breast cancer. Zhonghua Zhong Liu Za Zhi. (2021) 43:357–82. doi: 10.3760/cma.j.cn 112152-20210119-0006133902200 · doi ↗ · pubmed ↗
- 4The Society of Breast Cancer China Anti-Cancer Association BO Got O Bot CMA. Guidelines for breast cancer diagnosis and treatment by China anti-cancer association (2024 edition). China Oncol. (2024) 33:1092–187. doi: 10.19401/j.cnki.1007-3639.2023.12.004 · doi ↗
- 5Yao L Sun J Zhang J He Y Ouyang T Li J. Breast cancer risk in Chinese women with BRCA 1 or BRCA 2 mutations. Breast Cancer Res Treat. (2016) 156:441–5. doi: 10.1007/s 10549-016-3766-3, PMID: 27033093 · doi ↗ · pubmed ↗
- 6Yao L Sun J Hu L Chen J Zhang J Xu Y. Ovarian cancer risk of Chinese women with BRCA 1/2 germline pathogenic variants. J Hum Genet. (2022) 67:639–42. doi: 10.1038/s 10038-022-01065-6, PMID: 35864222 · doi ↗ · pubmed ↗
- 7Shi T Wang P Xie C Yin S Shi D Wei C. BRCA 1 and BRCA 2 mutations in ovarian cancer patients from China: ethnic-related mutations in BRCA 1 associated with an increased risk of ovarian cancer. Int J Cancer. (2017) 140:2051–9. doi: 10.1002/ijc.30633, PMID: 28176296 · doi ↗ · pubmed ↗
- 8Kuchenbaecker KB Hopper JL Barnes DR Phillips KA Mooij TM Roos-Blom MJ. Risks of breast, ovarian, and contralateral breast cancer for BRCA 1 and BRCA 2 mutation carriers. JAMA. (2017) 317:2402–16. doi: 10.1001/jama.2017.7112, PMID: 28632866 · doi ↗ · pubmed ↗