Elevated 1-hour Post Load Glucose as a Predictor for Telomere Attrition: A Study Based on a Chinese Community Population
Qi Gao, Jie Yu, Yiwen Liu, Baodi Xing, Fan Ping, Lingling Xu, Wei Li, Huabing Zhang, Yuxiu Li

TL;DR
This study shows that 1-hour post-load glucose is a better predictor of telomere shortening than other blood sugar measures, suggesting it could help detect early aging.
Contribution
The study demonstrates that 1h-PG is superior to traditional glycemic parameters in predicting telomere attrition in both nondiabetic and diabetic populations.
Findings
1h-PG was significantly negatively associated with telomere length in both nondiabetic and diabetic populations.
1h-PG outperformed other glycemic parameters in predicting telomere attrition in a 7-year longitudinal study.
Individuals with elevated 1h-PG had telomere lengths similar to those of prediabetic or diabetic populations.
Abstract
One-hour post-load glucose (1h-PG) detects dysglycemia-related disorders more effectively than traditional glycemic parameters. Hyperglycemia accelerates aging, but whether 1h-PG outperforms in predicting aging remains unclear. To compare the effectiveness of 1h-PG with other glycemic parameters in identifying and predicting telomere attrition. We conducted a cross-sectional and longitudinal study based on a Chinese community cohort. Multivariate linear regression and logistic regression were used to analyze the associations between glycemic parameters and telomere length. The area under the receiver operating characteristic (AUROC) curve were used to compare the differentiating and predictive ability. Populations were regrouped by glucose tolerance status and 1h-PG to compare telomere length. Analyses were separately conducted in nondiabetic and diabetic populations. The…
Genes, proteins, chemicals, diseases, species, mutations and cell lines named across the full text — each resolved to its canonical identifier and authoritative record.
Click any figure to enlarge with its caption.
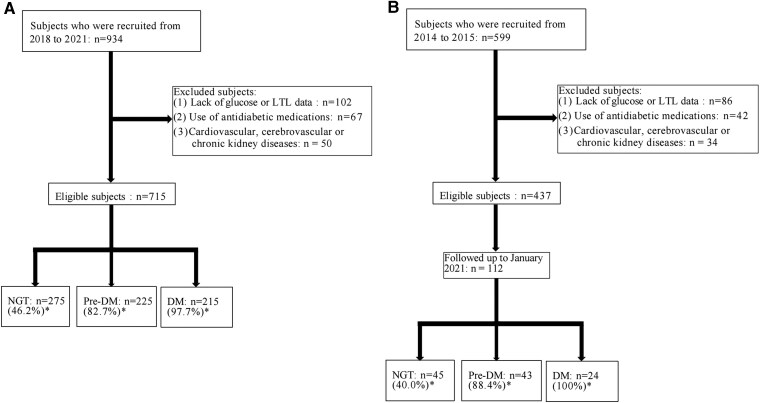 Figure 1
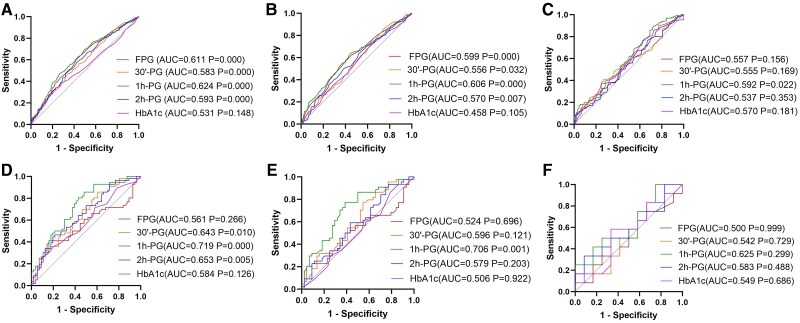 Figure 2
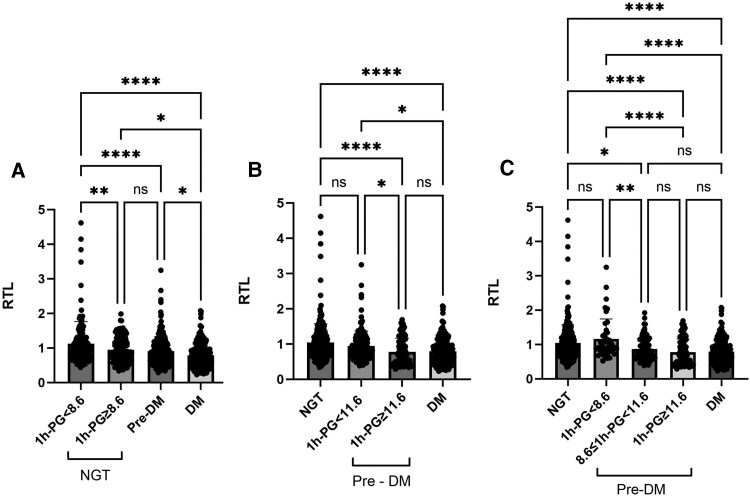 Figure 3
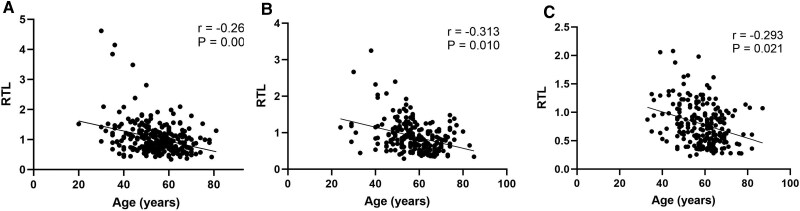 Figure 4
| Variable | RTL tertile |
| |||
|---|---|---|---|---|---|
| All (n = 715) | T1 (n = 239) | T2 (n = 238) | T3 (n = 238) | ||
| Glucose tolerance status (% diabetes) | 215 (30.1) | 97 (40.6) | 67 (28.2) | 51 (21.4) | |
| RTL | 0.8 (0.6, 1.1) | 0.5 (0.4, 0.6) | 0.8 (0.7, 0.9) | 1.3 (1.1, 1.5) | .001 |
| Age, years | 57.0 ± 10.0 | 59.0 ± 9.0 | 57.0 ± 9.0 | 55.0 ± 11.0 | .000 |
| Sex (% male) | 251 (35.1) | 92 (38.5) | 90 (37.8) | 69 (29.0) | .053 |
| Smoking, n (%) | 342 (47.8) | 121 (50.6) | 120 (50.4) | 101(42.4) | .619 |
| Alcohol drinking, n (%) | 356 (49.8) | 119 (49.79) | 122 (51.3) | 115 (48.31) | .856 |
| Regular exercise, n (%) | 350 (49.0) | 107 (44.8) | 124 (52.1) | 119 (50.0) | .256 |
| Energy intake, kcal/d | 1624.1 ± 468.1 | 1583.9 ± 473.0 | 1616.7 ± 473.7 | 1672.1 ± 455.2 | .115 |
| BMI, kg/m2 | 26.1 ± 4.5 | 26.4 ± 3.4 | 25.9 ± 3.9 | 25.9 ± 5.7 | .388 |
| WC, cm | 88.7 ± 11.1 | 90.5 ± 11.9 | 88.5 ± 9.9 | 87.3 ± 11.3 | .004 |
| HC, cm | 99.7 ± 11.8 | 100.5 ± 11.0 | 99.1 ± 8.9 | 97.7 ± 14.1 | .030 |
| WHR | 0.90 (0.85, 0.94) | 0.91 (0.86, 0.94) | 0.89 (0.85, 0.94) | 0.89 (0.84, 0.93) | .490 |
| SBP, mmHg | 132.0 ± 42.0 | 134.0 ± 17.0 | 135.0 ± 66.0 | 128.0 ± 24.0 | .114 |
| DBP, mmHg | 78.0 (71.0, 81.0) | 79.0 (71.0, 88.0) | 75.0 (73.0, 86.0) | 77.0 (70.0, 86.0) | .260 |
| ALT, U/L | 16.0 (13.0, 24.0) | 15.0 (12.0, 22.0) | 17.0 (13.0, 25.0) | 16.5 (13.0, 25.0) | .483 |
| AST, U/L | 21.0 (17.0, 25.0) | 20.0 (17.0, 24.0) | 21.0 (18.0, 25.0) | 21.0 (17.0, 25.0) | .763 |
| Cr, μmmol/L | 66.0 (57.0, 76.0) | 66.0 (56.0, 76.0) | 66.0 (59.0, 76.0) | 65.0 (57.0, 75.0) | .494 |
| UA, μmmol/L | 298.4 ± 77.7 | 298.0 ± 81.9 | 296.1 ± 77.0 | 301.1 ± 74.1 | .777 |
| TG, mmol/L | 3.3 (1.7, 4.8) | 3.9 (2.2, 4.9) | 2.9 (1.2, 4.8) | 2.7 (1.4, 4.6) | .001 |
| TC, mmol/L | 2.8 (1.3, 4.7) | 3.7 (1.5, 4.9) | 2.9 (1.3, 4.7) | 1.9 (1.1, 4.7) | .141 |
| HDL-C, mmol/L | 1.3 ± 0.3 | 1.2 ± 0.3 | 1.3 ± 0.3 | 1.4 ± 0.3 | .039 |
| LDL-C, mmol/L | 2.9 (2.3, 3.4) | 2.9 (2.3, 3.4) | 2.9 (2.4, 3.4) | 2.8 (2.3, 3.4) | .304 |
| FPG, mmol/L | 6.5 ± 1.9 | 7.0 ± 2.3 | 6.3 ± 1.8 | 6.0 ± 1.5 | .000 |
| 30′-PG, mmol/L | 10.3 ± 3.3 | 11.0 ± 3.6 | 10.4 ± 8.1 | 9.5 ± 7.7 | .000 |
| 1h-PG, mmol/L | 12.0 ± 4.8 | 13.8 ± 5.1 | 11.3 ± 4.7 | 10.8 ± 3.9 | .000 |
| 2h-PG, mmol/L | 10.1 ± 5.5 | 11.6 ± 6.1 | 9.9 ± 5.5 | 9.0 ± 4.6 | .000 |
| HbA1c, % | 6.1 ± 1.2 | 6.3 ± 1.4 | 6.0 ± 1.2 | 5.9 ± 1.0 | .038 |
| Variable | All | ΔZ-scores ≤ P50 | ΔZ-scores > P50 |
|
|---|---|---|---|---|
| ΔZ-scores | −0.3 (−1.0, 0.9) | −1.0 (−1.5, −0.5) | 1.5 (1.2, 1.8) | .000 |
| Z-scores BL | 0.00 (−0.68, 0.71) | 0.62 (0.25, 1.21) | −0.68 (−0.98, −0.25) | .000 |
| Age, years | 53.0 ± 8.0 | 52.0 ± 7.0 | 53.0 ± 9.0 | .690 |
| Sex (% male) | 77 (68.8) | 40 (71.4) | 37 (66.1) | .541 |
| Energy intake, kcal/d | 1730.5 ± 584.2 | 1770.4 ± 568.3 | 1689.3 ± 607.0 | .592 |
| BMI, kg/m2 | 26.3 ± 4.1 | 26.3 ± 4.5 | 26.3 ± 3.7 | .999 |
| WC, cm | 88.0 ± 10.4 | 88.8 ± 10.6 | 87.2 ± 10.3 | .422 |
| HC, cm | 93.1 ± 10.8 | 93.7 ± 11.1 | 92.6 ± 10.5 | .583 |
| WHR | 0.95 ± 0.02 | 0.95 ± 0.02 | 0.94 ± 0.02 | .064 |
| SBP, mmHg | 129.5 ± 18.6 | 131.0 ± 20.0 | 128.0 ± 18.0 | .256 |
| DBP, mmHg | 77.1 ± 9.4 | 78.0 ± 10.0 | 76.0 ± 9.0 | .165 |
| ALT, U/L | 25.2 (19.8, 36.3) | 24.9 (19.8, 36.6) | 25.4 (19.7, 33.3) | .351 |
| AST, U/L | 24.2 (19.6, 28.0) | 25.2 (19.6, 29.3) | 23.4 (19.6, 26.8) | .407 |
| Cr, μmmol/L | 68.1 (57.7, 81.6) | 69.1 (58.7, 81.3) | 66.9 (56.5, 82.9) | .834 |
| UA, μmmol/L | 283.3 ± 72.0 | 286.1 ± 63.5 | 280.5 ± 80.0 | .684 |
| TG, mmol/L | 1.4 (1.0, 1.9) | 1.6 (1.1, 2.3) | 1.4 (1.0, 1.9) | .145 |
| TC, mmol/L | 5.5 ± 0.9 | 5.5 ± 0.8 | 5.5 ± 1.1 | .882 |
| HDL-C, mmol/L | 1.3 ± 0.3 | 1.3 ± 0.2 | 1.3 ± 0.3 | .553 |
| LDL-C, mmol/L | 2.8 ± 0.7 | 2.9 ± 0.6 | 2.9 ± 0.7 | .959 |
| FPG, mmol/L | 6.5 ± 1.6 | 6.7 ± 1.8 | 6.2 ± 1.2 | .011 |
| 30′-PG, mmol/L | 11.4 ± 3.1 | 12.1 ± 3.3 | 10.6 ± 2.7 | .007 |
| 1h-PG, mmol/L | 11.5 ± 4.6 | 13.1 ± 4.9 | 9.9 ± 3.7 | .000 |
| 2h-PG, mmol/L | 8.8 ± 4.5 | 9.9 ± 5.0 | 7.7 ± 3.6 | .005 |
| HbA1c, % | 5.9 ± 0.9 | 6.0 ± 1.0 | 5.8 ± 0.8 | .121 |
| FPG | 30′-PG | 1h-PG | 2h-PG | HbA1c | ||||||
|---|---|---|---|---|---|---|---|---|---|---|
| β (95% CI) |
| β (95% CI) |
| β (95% CI) |
| β (95% CI) |
| β (95% CI) |
| |
| Total population | ||||||||||
| Model 1 | −.133 (−0.085; −0.025) | .000 | −.125 (−0.049; −0.013) | .001 | −.191 (−0.044; −0.020) | .000 | −.140 (−0.031; −0.010) | .000 | −.085 (−0.104; −0.007) | .024 |
| Model 2 | −.117 (−0.079; −0.018) | .002 | −.109 (−0.045; −0.009) | .004 | −.174 (−0.042; −0.017) | .000 | −.122 (−0.028; −0.007) | .001 | −.075 (−0.097; −0.001) | .045 |
| Model 3 | −.104 (−0.075; −0.012) | .006 | −.101 (−0.043; −0.006) | .008 | −.160 (−0.040; −0.015) | .000 | −.109 (−0.027; −0.005) | .004 | −0.067 (−0.093; 0.005) | .078 |
| Model 4 | −.075 (−0.063; 0.000) | .051 | −.086 (−0.040; −0.002) | .027 | −.143 (−0.037; −0.012) | .000 | −.093 (−0.025; −0.003) | .015 | −.042 (−0.078; 0.022) | .268 |
| Non-DM group | ||||||||||
| Model 1 | −.051 (−0.217; 0.058) | .258 | −.037 (−0.066; 0.027) | .406 | −.139 (−0.080; −0.018) | .002 | −.066 (−0.079; 0.011) | .138 | .039 (−0.068; 0.137) | .390 |
| Model 2 | −.026 (−0.182; 0.099) | .561 | −.028 (−0.061; 0.031) | .527 | −.128 (−0.076; −0.014) | .004 | −.058 (−0.074; 0.015) | .272 | .041 (−0.063; 0.176) | .354 |
| Model 3 | −.021 (−0.178; 0.111) | .648 | −.036 (−0.066; 0.028) | .427 | −.118 (−0.073; −0.010) | .009 | −.050 (−0.071; 0.020) | .272 | .032 (−0.082; 0.170) | .490 |
| Model 4 | −.023 (−0.180; 0.106) | .612 | −.007 (−0.050; 0.043) | .880 | −.106 (−0.068; −0.007) | .017 | −.037 (−0.060; 0.031) | .411 | .058 (−0.064; 0.026) | .240 |
| DM group | ||||||||||
| Model 1 | −.140 (−0.142; −0.001) | .040 | −.117 (−0.025; 0.002) | .087 | −.219 (−0.031; −0.008) | .001 | −.083 (−0.015; 0.003) | .225 | −.120 (−0.062; 0.003) | .078 |
| Model 2 | −.142 (−0.042; −0.001) | .038 | −.110 (−0.025; 0.003) | .107 | −.210 (−0.030; −0.007) | .002 | −.071 (−0.014; 0.004) | .303 | −.126 (−0.063; 0.002) | .065 |
| Model 3 | −.109 (−0.037; 0.003) | .101 | −.063 (−0.020; 0.007) | .350 | −.182 (−0.028; −0.004) | .007 | −.056 (−0.013; 0.005) | .411 | −.092 (−0.054; 0.010) | .170 |
| Model 4 | −.082 (−0.034; 0.008) | .234 | −.102 (−0.025; 0.004) | .150 | −.222 (−0.032; −0.007) | .002 | −.112 (−0.017; 0.002) | .116 | −.122 (−0.063; 0.002) | .069 |
| FPG | 30′-PG | 1h-PG | 2h-PG | HbA1c | ||||||
|---|---|---|---|---|---|---|---|---|---|---|
| OR (95% CI) |
| OR (95% CI) |
| OR (95% CI) | OR (95% CI) |
| OR (95% CI) |
| ||
| Total population | ||||||||||
| Model 1 | 1.202 (1.102, 1.311) | .000 | 1.103 (1.051, 1.156) | .000 | 1.098 (1.062, 1.135) | .000 | 1.056 (1.027, 1.086) | .000 | 1.153(1.018, 1.305) | .025 |
| Model 2 | 1.180 (1.083, 1.287) | .001 | 1.093 (1.042, 1.147) | .000 | 1.091 (1.055, 1.128) | .000 | 1.050 (1.021, 1.080) | .001 | 1.135(1.003, 1.286) | .045 |
| Model 3 | 1.160 (1.062, 1.267) | .006 | 1.079 (1.028, 1.134) | .002 | 1.084 (1.048, 1.122) | .003 | 1.046 (1.016, 1.076) | .002 | 1.023(0.988, 1.278) | .076 |
| Model 4 | 1.169 (1.067, 1.280) | .011 | 1.089 (1.135, 1.146) | .010 | 1.093 (1.055, 1.133) | .008 | 1.053 (1.022, 1.085) | .016 | 1.152(0.936, 1.319) | .091 |
| Non-DM group | ||||||||||
| Model 1 | 1.796 (1.317, 2.448) | .000 | 1.123 (1.015, 1.242) | .025 | 1.162 (1.083, 1.247) | .000 | 1.138 (1.031, 1.256) | .010 | 1.430(0.630, 1.094) | .187 |
| Model 2 | 1.687 (1.106, 1.932) | .001 | 1.114 (1.006, 1.234) | .038 | 1.155 (1.075, 1.240) | .000 | 1.129 (1.022, 1.247) | .017 | 1.422(0.623, 1.085) | .167 |
| Model 3 | 1.548 (1.121, 2.139) | .008 | 1.102 (0.993, 1.224) | .068 | 1.146 (1.066, 1.233) | .002 | 1.129 (1.019, 1.250) | .020 | 1.267(0.641, 1.173) | .356 |
| Model 4 | 1.523 (1.093, 2.123) | .013 | 1.101 (0.989, 1.226) | .079 | 1.151 (1.069, 1.239) | .005 | 1.126 (1.015, 1.250) | .025 | 1.153(0.628, 1.160) | .311 |
| DM group | ||||||||||
| Model 1 | 1.118 (0.985, 1.269) | .085 | 1.071 (0.990, 1.160) | .089 | 1.111 (1.033, 1.196) | .005 | 1.035 (0.983, 1.090) | .190 | 1.170 (0.960, 1.424) | .119 |
| Model 2 | 1.122 (0.988, 1.275) | .075 | 1.096 (0.987, 1.158) | .100 | 1.110 (1.032, 1.195) | .005 | 1.033 (0.981, 1.089) | .220 | 1.179 (0.968, 1.436) | .102 |
| Model 3 | 1.104 (0.960, 1.270) | .166 | 1.041 (0.955, 1.136) | .362 | 1.104 (1.017, 1.199) | .018 | 1.026 (0.969, 1.087) | .379 | 1.144 (0.919, 1.422) | .228 |
| Model 4 | 1.156 (0.958, 1.306) | .156 | 1.071 (0.973, 1.180) | .163 | 1.144 (1.041, 1.258) | .035 | 1.052 (0.984, 1.126) | .138 | 1.290 (0.922, 1.661) | .148 |
| FPG | 30′-PG | 1h-PG | 2h-PG | HbA1c | ||||||
|---|---|---|---|---|---|---|---|---|---|---|
| β (95% CI) |
| β (95% CI) |
| β (95% CI) |
| β (95% CI) |
| β (95% CI) |
| |
| Total population | ||||||||||
| Model 1 | −.187 (−0.384; −0.001) | .049 | −.251 (−0.225; −0.036) | .008 | −.401 (−0.201; −0.080) | .000 | −.280 (−0.166; −0.036) | .003 | −.281 (−0.731; −0.060) | .021 |
| Model 2 | −.187 (−0.387; −0.000) | .049 | −.250 (−0.226; −0.034) | .008 | −.400 (−0.201; −0.079) | .000 | −.277 (−0.166; −0.034) | .003 | −.216 (−0.729; −0.052) | .024 |
| Model 3 | −.127 (−0.360; 0.146) | .400 | −.318 (−0.258; −0.014) | .030 | −.466 (−0.222; −0.062) | .001 | −.305 (−0.174; −0.006) | .030 | −.148 (−0.641; 0.199) | .296 |
| Model 4 | −.121 (−0.232; 0.027) | .118 | −.230 (−0.360; −0.027) | .032 | −.255 (−0.121; −0.034) | .005 | −.156 (−0.089; −0.003) | .035 | −.179 (−0.477; 0.056) | .115 |
| Non-DM group | ||||||||||
| Model 1 | −.074 (−0.920; 0.446) | .492 | −.175 (−0.310; 0.029) | .103 | −.426 (−0.374; −0.020) | .000 | −.321 (−0.525; −0.118) | .002 | −.151 (−1.226; 0.209) | .362 |
| Model 2 | −.077 (−0.938; 0.446) | .482 | −.185 (−0.323; 0.026) | .094 | −.427 (−0.378; −0.139) | .000 | −.319 (−0.526; −0.313) | .003 | −.148 (−1.231; 0.231) | .178 |
| Model 3 | −.160 (−1.679; 0.809) | .479 | −.594 (−0.591; 0.093) | .074 | −.704 (−0.511; −0.182) | .001 | −.518 (−0.814; −0.145) | .007 | −.155 (−1.321; 0.611) | .456 |
| Model 4 | −.194 (−1.125; 0.069) | .080 | −.375 (−0.330; 0.020) | .112 | −.314 (−0.276; −0.032) | .016 | −.099 (−0.320; 0.136) | .407 | −.176 (−0.865; 0.055) | .081 |
| DM group | ||||||||||
| Model 1 | .051 (−0.189; 0.237) | .814 | −.019 (−0.143; 0.131) | .929 | −.175 (−0.145; 0.062) | .415 | .019 (−0.082; 0.019) | .928 | −.053 (−0.393; 0.309) | .807 |
| Model 2 | .067 (−0.197; 0.262) | .770 | .079 (−0.128; 0.077) | .740 | −.130 (−0.140; 0.078) | .560 | .094 (−0.073; 0.109) | .682 | −.050 (−0.406; 0.327) | .823 |
| Model 3 | −.011 (−0.115; 0.107) | .931 | −.081 (−0.090; 0.052) | .537 | −.146 (−0.077; 0.022) | .220 | −.124 (−0.071; 0.030) | .362 | −.023 (−0.224; 0.192) | .861 |
| FPG | 30′-PG | 1h-PG | 2h-PG | HbA1c | ||||||
|---|---|---|---|---|---|---|---|---|---|---|
| OR (95%CI) |
| OR (95%CI) |
| OR (95%CI) | OR (95%CI) |
| OR (95%CI) |
| ||
| Total population | ||||||||||
| Model 1 | 1.248 (0.961, 1.622) | .097 | 1.182 (1.034, 1.967) | .014 | 1.205 (1.086, 1.337) | .000 | 1.135 (1.026, 1.256) | .014 | 1.418(0.903, 2.228) | .130 |
| Model 2 | 1.246 (0.958, 1.621) | .101 | 1.188 (1.037, 1.360) | .013 | 1.207 (1.087, 1.341) | .000 | 1.134 (1.025, 1.254) | .015 | 1.411(0.896, 2.222) | .137 |
| Model 3 | 1.312 (0.990, 1.339) | .059 | 1.195 (1.041, 1.371) | .011 | 1.212 (1.088, 1.349) | .000 | 1.150 (1.035, 1.277) | .009 | 1.391(0.881, 2.197) | .157 |
| Model 4 | 1.616 (0.883, 2.958) | .120 | 1.761 (1.076, 2.881) | .024 | 1.776 (1.051, 2.571) | .042 | 1.328 (0.962, 1.834) | .084 | 1.854 (0.703, 4.890) | .212 |
| Non-DM group | ||||||||||
| Model 1 | 1.160 (0.526, 2.560) | .712 | 1.178 (0.957, 1.449) | .123 | 1.304 (1.091, 1.560) | .004 | 1.207 (0.934, 1.559) | .150 | 0.824 (0.352, 1.926) | .655 |
| Model 2 | 1.183 (0.533, 2.624) | .680 | 1.198 (0.966, 1.485) | .100 | 1.307 (1.091, 1.566) | .004 | 1.201 (0.929, 1.553) | .161 | 0.802 (0.340, 1.891) | .614 |
| Model 3 | 1.318 (0.562, 2.088) | .525 | 1.196 (0.934, 1.463) | .173 | 1.292 (1.066, 1.566) | .009 | 1.217 (0.920, 1.608) | .168 | 0.614 (0.224, 1.678) | .341 |
| Model 4 | 1.599 (0.451, 2.967) | .285 | 1.187 (0.948, 1.272) | .124 | 2.659 (1.158, 6.274) | .021 | 1.287 (0.707, 2.343) | .410 | 0.191 (0.007, 5.122) | .824 |
| DM group | ||||||||||
| Model 1 | 1.031 (0.679, 1.564) | .887 | 1.098 (0.834, 1.444) | .506 | 1.168 (0.932, 1.463) | .178 | 1.082 (0.908, 1.288) | .378 | 1.197 (0.597, 2.397) | .613 |
| Model 2 | 0.958 (0.596, 1.539) | .859 | 0.993 (0.723, 1.364) | .964 | 1.146 (0.896, 1.464) | .277 | 1.041 (0.861, 1.260) | .677 | 1.153 (0.529, 2.512) | .720 |
| Model 3 | 0.794 (0.224, 2.813) | .720 | 0.998 (0.546, 1.825) | .994 | 1.079 (0.687, 1.693) | .741 | 0.980 (0.669, 1.436) | .919 | 1.164 (0.540, 2.173) | .780 |
- —National High Level Hospital Clinical Research Funding
- —CAMS Innovation Fund for Medical Sciences
- —National Natural Science Foundation of China10.13039/501100001809
- —CAMS Innovation Fund for Medical Sciences
Peer Reviews
No public reviews on file for this paper yet. If you reviewed it on a platform where reviews are public (OpenReview, ICLR, NeurIPS, ICML), you can paste yours below so the community can read it here.
Videos
No videos yet. Explain this paper in a talk, walkthrough, or lecture? Add one.
Taxonomy
TopicsTelomeres, Telomerase, and Senescence · Genetics, Aging, and Longevity in Model Organisms · Advanced Glycation End Products research
Aging, marked by the progressive decline in function due to molecular and cellular deterioration (1), is now recognized as the predominant risk factor for major chronic diseases, including cancer, cardiovascular disorders, dementia, and, ultimately, increased mortality (2). The World Health Organization has launched the Decade of Healthy Aging 2020-2030 initiative, aiming to ameliorate societal aging processes (3). Telomeres, which cap the ends of eukaryotic chromosomes, play a crucial role in safeguarding DNA from damage (4). Recent findings underscore that telomere shortening is pivotal in regulating cellular aging, with leukocyte telomere length (LTL) emerging as a significant aging biomarker (5). Understanding factors that accelerate telomere attrition is essential for developing strategies to slow the aging process.
Recent research has elucidated a significant correlation between plasma glucose levels and LTL. For example, LTL in diabetic (DM) patients is shorter than their age-matched but nondiabetic (non-DM) counterparts (6). The LTL in islet β-cell is inverse to the level of glycated hemoglobin (HbA1c) in DM populations (7). Shortened LTL may present a marker of glucose deterioration (8). However, traditional glycemic parameters showed instability in predicting telomere shortening and may differ among populations with varying glucose tolerance statuses (9). It is necessary to identify more effective glycemic biomarkers for detecting aging.
Increasing evidence indicates that elevated 1-hour post-load plasma glucose (1h-PG) exhibits greater sensitivity than traditional glycemic parameters such as fasting plasma glucose (FPG), 2-hour post-load plasma glucose (2h-PG), and HbA1c in identifying dysglycemia-related conditions (10). A recent study from Daqing, China, utilizing 30 years of follow-up data, revealed that non-DM individuals with 1h-PG ≥8.6 mmol/L (1 mmol/L = 18 mg/dL) had a significantly increased risk of developing diabetes [hazard ratio (HR) = 4.45, 95% confidence interval (CI) 3.43 to 5.79, P < 0.001] (11). Recently, the International Diabetes Federation issued a statement advocating that 1h-PG ≥ 8.6 mmol/L for intermediate hyperglycemia diagnosis and ≥11.6 mmol/L for DM, confirming its value in early dysglycemia detection (12). Within populations exhibiting normal glucose tolerance (NGT), an elevated 1h-PG has been shown to be a strong predictor for the complications of diabetes and increased mortality risk (13-15). To our knowledge, there were no previous studies that have explored whether 1h-PG is superior to traditional glycemic parameters in identifying and predicting telomere attrition.
Utilizing data from a Chinese community cohort, we analyzed the relationship between various glycemic parameters (FPG, 30′-PG, 1h-PG, 2h-PG, and HbA1c) and LTL in a cross-sectional study, and compared their ability to predict telomere shortening over a 7-year follow-up.
Material and Methods
Participants
The data were derived from a cohort in the Changping district of Beijing, China. The purpose of establishing the cohort is to explore the factors influencing the occurrence and progression of diabetes and its related diseases. Therefore, it includes individuals with NGT, prediabetes, and diabetes. Participants were initially recruited between March 2014 and January 2015, with follow-ups conducted every 1 to 2 years. Additionally, new participants were dynamically enrolled and regularly monitored throughout this period. Comprehensive assessments were performed at baseline and during each follow-up. All individuals provided written informed consent voluntarily and underwent a standardized 75 g oral glucose tolerance test. Additionally, they completed questionnaires detailing their sex, age, medical history, smoking, alcohol consumption, and exercise status.
The diagnostic criteria for categorizing glucose tolerance levels adhered to the 1999 World Health Organization standards (16), wherein (1) NGT is defined as FPG < 6.1 mmol/L and 2h-PG < 7.8 mmol/L; (2) impaired fasting glucose (IFG) as FPG ≥ 6.1 mmol/L but < 7.0 mmol/L with 2h-PG < 7.8 mmol/L; (3) impaired glucose tolerance (IGT) as FPG <7.0
mmol/L and 2h-PG ≥ 7.8 mmol/L but < 11.1 mmol/L; (4) DM as FPG ≥7.0 mmol/L or 2h-PG ≥11.1 mmol/L; (5) the non-DM population includes individuals with NGT, IFG, and IGT; (6) prediabetic (pre-DM) population encompasses both IFG and IGT.
In the cross-sectional study, we used data from 934 participants collected between 2018 and 2021. Exclusion criteria were consistent with baseline, and 715 participants were eligible for final analysis. In the total population, the numbers of individuals with NGT, prediabetes, and diabetes are 275, 225, and 215, respectively. Additionally, the number and proportion of individuals with elevated 1h-PG (≥8.6 mmol/L) in these 3 glucose tolerance categories are as follows: 127 (46.2%) for NGT, 186 (82.7%) for prediabetes, and 210 (97.7%) for diabetes (Fig. 1A).
*Flowchart of participants included in the study. (1A) Flowchart of cross-sectional study; (1B) flowchart of prospective study. Proportion of individuals with elevated 1-hour plasma glucose (≥8.6 mmol/L).Abbreviations: DM, diabetic group; LTL, leukocyte telomere length; NGT, normal glucose tolerance; Pre-DM, prediabetic group.
In the prospective study, we recruited 599 adults at the baseline. Exclusion criteria included (1) recent (within the past 3 months) use of steroids, antidiabetic medications, or other agents potentially affecting plasma glucose levels; (2) cardiovascular and cerebrovascular diseases or chronic kidney diseases; (3) participants without the data of glucose or LTL. After applying these criteria, 437 participants were eligible for recruitment, and there were 112 participants remaining when followed up to 2021. In the total 112 individuals, the numbers of individuals with NGT, prediabetes, and diabetes were 45, 43, and 24, respectively. Moreover, the number and percentage of individuals with 1h-PG ≥8.6 mmol/L in the 3 glucose tolerance groups were as follows: 18 (40.0%) for NGT, 38 (88.4%) for prediabetes, and 24 (100%) for diabetes (Fig. 1B).
The study's protocols received approval from the Ethics Committee of Peking Union Medical College Hospital.
LTL Assays
LTL assays were conducted using blood samples, with the methodology for LTL assessment detailed in a prior publication (17). In summary, LTL was quantified by calculating the ratio of telomere repeat copy number to single gene copy number (T/S ratio) using a monochrome multiplex quantitative PCR method (18). The efficiencies of the standard curves for both primer sets exceeded 90%, with regression coefficients of at least 0.99 across all PCR runs. The coefficient of variation (CV) within and between plates, calculated as the ratio of the SD to the mean across replicates, were 18% and 7%, respectively. For the study samples, the within-plate CV ranged from 8.2% to 14.3%.
In the cross-sectional study, the relative telomere length (RTL) of leukocytes served as a proxy for telomere length. RTL below the median (RTL ≤ P50) indicates a group with shorter telomeres. For the longitudinal study, RTL was measured at both baseline and follow-up. To mitigate potential batch effects on RTL measurements over time, RTL values were log-transformed and standardized to Z-scores by subtracting the mean and dividing by the SD, thus normalizing individual LTL measurements to the cohort mean (19). Z-scores of logs-transformed LTL at baseline (Z-scores BL) and follow-up (Z-scores FU) were separately calculated. The change of Z-scores (ΔZ-scores) were calculated as Z-scores FU minus Z-scores BL. Accelerated telomere attrition was defined as ΔZ-scores below the median(ΔZ-scores ≤ P50).
Given the various terms used to refer to telomere length in this study, we provide the following definitions and explanations for clarity: (1) LTL: telomere length. This broadly refers to the length of telomeres; (2) RTL: relative telomere length. LTL was quantified by calculating the ratio of telomere repeat copy number to single gene copy number (T/S ratio) using a monochrome multiplex quantitative PCR method. RTL represents the actual calculated telomere length used in the analysis of the cross-sectional study; (3) Z-scores of RTL: RTL was standardized using Z-scores to mitigate potential batch effects on RTL measurements over time in the longitudinal study; (4) Z-scores BL: Z-scores standardization of RTL at baseline; (5) Z-scores FU: Z-scores standardization of RTL at follow-up; (6) ΔZ-scores: the difference between Z-scores of RTL at follow-up and baseline (Z-scores FU minus Z-scores BL). This is used to assess the extent of telomere shortening in the longitudinal study.
LTL Comparison by Glucose Tolerance Status and 1h-PG Levels
Recently, the International Diabetes Federation guidelines recommended 1h-PG thresholds of 8.6 mmol/L for prediabetes and 11.6 mmol/L for diabetes diagnosis (12). These cut-off values are based on large longitudinal studies showing 1h-PG ≥8.6 mmol/L predicts future diabetes risk in individuals with NGT (20-23). Additionally, a meta-analysis of 15 studies with 35 551 participants found 1h-PG ≥11.6 mmol/L has higher sensitivity and specificity for diabetes compared to the 2h-PG ≥11.1 mmol/L (24). Thus, using elevated 1h-PG for diagnosis may enable earlier treatment when glycemic control is easier and diabetes reversal more likely. However, it remains unclear whether these new diagnostic cut-off values can differentiate telomere length among different glucose tolerance status groups. Therefore, we examined whether the NGT but with elevated 1h-PG (≥8.6 mmol/L) population has telomere lengths comparable to those in the pre-DM population, and whether pre-DM with elevated 1h-PG levels (≥11.6 mmol/L) match telomere lengths in the DM group.
Anthropometric Examination
Participants underwent height and weight assessments in light clothing and without shoes. Body mass index (BMI) was calculated as the individual's weight in kilograms divided by the square of their height in meters. Measurements of waist circumference (WC) and hip circumference (HC), along with systolic blood pressure (SBP) and diastolic blood pressure (DBP), were conducted twice by trained clinicians. WC was accurately measured to the nearest 0.1 cm at the midpoint between the iliac crest and the costal margin on both sides. Similarly, HC was determined to the nearest 0.1 cm around the hip rotor.
Dietary Assessment
Daily energy intake was evaluated through 24-hour food recalls, with dietary data gathered by trained interviewers. Nutrient intakes were computed utilizing nutrition calculation software, developed by registered dietitians and based on the Microsoft Office Access 2007 database. The nutrient consumption calculations were guided by the China Food Composition Table 2004 database.
Biochemical Measurements
Following an overnight fast of at least 10 hours, participants received a 2-hour 75 g oral glucose tolerance test in the morning. Plasma glucose levels were measured at 0, 30, 60, and 120 minutes using the glucose oxidase method. HbA1c was analyzed via high-performance liquid chromatography with intra-assay CV < 3% and interassay CV <10%. Total cholesterol, triglycerides (TG), high-density lipoprotein cholesterol (HDL-C), low-density lipoprotein cholesterol (LDL-C), uric acid (UA), creatinine (Cr), aspartate aminotransferase (AST), and alanine aminotransferase were quantified using an automated analyzer.
Statistical Analysis
The Shapiro–Wilk and Kolmogorov–Smirnov tests were utilized to assess the normality of the data distribution. Variables conforming to a normal distribution were presented as mean ± SD, whereas those not normally distributed were shown as median with interquartile range (25th-75th percentile). Categorical variables were shown as counts and percentages. Group differences were evaluated using one-way ANOVA, Student's t-test, Mann–Whitney U test, or chi-squared test, as appropriate.
In the cross-sectional analysis, RTL was divided into tertiles for comparing participant characteristics. The relationships between glycemic parameters and RTL were assessed through multiple linear regression models, adjusted for age, sex, BMI, WC, HC, SBP, plasma lipids (TG, LDL-C, HDL-C), AST, UA, Cr, and lifestyle-related factors (smoking, alcoholic drinking, daily energy intake, exercise). The ability of glycemic parameters to distinguish shorter RTL was evaluated using multivariable binary logistic regression with the same adjusted confounders as in the linear regression, and the effectiveness was measured using the area under the receiver operating characteristic (AUROC) curve.
For the longitudinal analysis, Z-scores BL and Z-scores FU were calculated, with the ΔZ-scores (Z-scores FU minus Z-scores BL) representing the change in LTL over 7-year period. ΔZ-scores below the median (ΔZ-scores ≤ P50) indicates a group with significantly accelerate telomere attrition. Multiple linear regression analyzed the association between baseline glycemic parameters and ΔZ-scores, adjusting for age, sex, BMI, WC, HC, SBP, TG, LDL-C, HDL-C, AST, UA, Cr, daily energy intake, and Z-scores BL. Participants were stratified into 2 groups based on their ΔZ-scores being equal to or less than or greater than the median, and baseline characteristics were compared between the 2 groups. The predictive capacity of glycemic parameters for accelerated telomere shortening was assessed using multivariable binary logistic regression and the AUROC curve, with Youden's index determining optimal glycemic parameter cutoffs.
All statistical tests were two-tailed, with a P value of less than .05 deemed statistically significant. Statistical analyses were performed using SPSS software, version 26.0 (IBM Corp.), and graphical representations were generated with GraphPad Prism version 10.0 (available at https://www.graphpad.com).
Results
Participant Characteristics
In the cross-sectional study, we compared the demographic and clinical features of the study population across tertiles of RTL (Table 1). Among the 715 participants, the age was 57.0 ± 10.0 years, with males comprising 35.1% of the population, and the RTL was observed at 0.8 (0.6, 1.1). There were 215 (30.1%) DM individuals in the total population. A significant trend emerged with ascending RTL tertiles: individuals tended to be younger and exhibit reduced WC, HC, and TG levels alongside higher HDL-C levels. Notably, all glycemic parameters assessed in this study demonstrated a declining trend from the lowest to the highest RTL tertile. Additionally, the lowest RTL tertile group has a higher proportion of DM individuals compared to the highest RTL tertile group.
In the prospective study, 437 patients were eligible with 112 completing the follow-up from 2014 to 2021. The cohort predominantly consisted of males (68.8%); the age was 53 ± 8 years at baseline. The ΔZ-scores were −0.3 (−1.0, 0.9), while the Z-scores BL were 0.00 (−0.68, 0.71). Compared with ΔZ-scores > P50 group, participants with a ΔZ-scores ≤ P50 exhibited higher FPG (6.7 ± 1.8 vs 6.2 ± 1.2), 30′-PG (12.1 ± 3.3 vs 10.6 ± 2.7), 1h-PG (13.1 ± 4.9 vs 9.9 ± 3.7), and 2h-PG (9.9 ± 5.0 vs 7.7 ± 3.6), though HbA1c levels did not differ significantly between groups (6.0 ± 1.0 vs 5.8 ± 0.8). There were also higher baseline Z-scores (0.62 [0.25, 1.21] vs −0.68 [−0.98, −0.25]) in ΔZ-scores ≤ P50 group. Significant differences were not observed between the 2 groups for age, anthropometric measures, plasma lipid levels, and daily energy intake (Table 2).
Association of RTL With Glycemic Parameters in Different Populations
In the cross-sectional study, a multiple linear regression analysis was conducted to determine the independent impact of glycemic parameters on RTL (Table 3). In the total population, only p load glucose including 30′-PG (β = −.086, 95% CI −0.040 to −0.002, P = .027), 1h-PG (β = −.143, 95% CI −0.037 to −0.012, P = .000), and 2h-PG (β = −.093, 95% CI −0.025 to −0.003, P = .015) retained a significant negative correlation with RTL after adjusting for confounders. When classifying the population into non-DM and DM groups, only 1h-PG showed a significant inverse correlation with RTL, even after full adjustment for confounders (β = −.106, 95% CI −0.068 to −0.007, P = .017; β = −.222, 95% CI −0.032 to −0.007, P = .002 in the non-DM and DM group, respectively).
Subsequently, we utilized multivariable binary logistic regression to determine whether glycemic parameters are associated with an increased risk of shorter RTL (Table 4). In the general population, all glycemic parameters except HbA1c were associated with shorter RTL. In the non-DM group, after adjusting for confounders, only FPG (OR = 1.523, CI 1.093 to 2.123, P = .013), 1h-PG (OR = 1.151, CI 1.069 to 1.239, P = .005), and 2h-PG (OR = 1.126, CI 1.015 to 1.250, P = .025) were found to increase the risk of shorter RTL. In the DM group, only 1h-PG significantly increased the risk (OR = 1.144, CI 1.041 to 1.258, P = .035).
In the prospective study, we analyzed the correlation between glycemic parameters and ΔZ-scores using multiple linear regression (Table 5). In the total population, after adjusting for confounders, only post-load glucose parameters including 30′-PG (β = −.230, CI −0.360 to −0.027, P = .032), 1h-PG (β = −.255, CI −0.121 to −0.034, P = .005), and 2h-PG (β = −.156, CI −0.089 to −0.003, P = .035) showed significant associations. In the non-DM group, 1h-PG remained related to ΔZ-scores (β = −.314, CI −0.276 to −0.032, P = .016) after controlling for age, sex, BMI, WC, HC, SBP, daily energy intake, plasma lipids, UA, Cr, and Z-scores BL. No correlations reached statistical difference in the diabetes group, although 1h-PG showed the lowest P-value (β = −.146, CI −0.077 to 0.022, P = .220).
Next, binary logistic regression was utilized to evaluate the predictive power of baseline glycemic parameters for accelerated telomere attrition (Table 6). In the total population, 30′-PG (OR = 1.761, CI 1.076 to 2.881, P = .024) and 1h-PG (OR = 1.776, 95% CI 1.051 to 2.571, P = .042) significantly predicted telomere shortening after adjusting for confounders. The impact of 2h-PG lessened (OR = 1.328, 95% CI 0.962 to 1.834, P = .084) after adjusting for plasma lipids and Z-scores BL. In the non-DM population, only 1h-PG at baseline significantly predicted telomere shortening (OR = 2.659, 95% CI 1.158 to 6.247, P = .021), even fully adjusting for confounders. No significant predictive effects were observed in the DM group.
The Identifying and Predictive Abilities of Glycemic Parameters for Telomere Attrition
In the cross-sectional study, AUROC results showed the ability of glycemic parameters to identify shorter RTL. For the total and non-DM populations, all glycemic parameters except HbA1c could identify shorter RTL, with 1h-PG exhibited the strongest identifying capability (AUC = 0.624, P < .001; AUC = 0.606, P < .001 for the total and non-DM populations, respectively)(Fig. 2A and 2B), with optimal cutoff at 12.5 mmol/L (47.4% sensitivity, 73.1% specificity) for the total population and 9.05 mmol/L (63.2% sensitivity, 65.8% specificity) for the non-DM population. In the DM group, only 1h-PG showed the potential (AUC = 0.592, P = .022), with the best cutoff at 13.8 mmol/L (sensitivity 89.8%, specificity 37.3%) (Fig. 2C).
AUROCs of the glycemic parameters for telomere attrition. (2A) Total population in cross-sectional study; (2B) non-DM population in cross-sectional study; (2C) DM population in cross-sectional study; (2D) total population in prospective study; (2E) non-DM population in prospective study; (2F) DM population in prospective study. P < .05 indicates statistical difference.Abbreviations: 1h-PG, 1-hour post-load plasma glucose; 2h-PG, 2-hour post-load plasma glucose; 30′-PG, 30-minute post-load plasma glucose; AUROC, area under the receiver operating characteristic; DM, diabetic; FPG, fasting plasma glucose; HbA1c, glycated hemoglobin; non-DM, nondiabetic.
In the longitudinal study, AUROC analysis revealed the predictive capabilities of glycemic parameters for accelerated telomere attrition. In the total population, post-load glucose levels demonstrated significant predictive ability, and 1h-PG had the highest predictive value with an AUROC of 0.719 (P < .001) with the optimal cutoff at 9.2 mmol/L (sensitivity: 77.3%, specificity: 62.8%) (Fig. 2D). In the non-DM group, only 1h-PG showed the predictive ability with an AUROC of 0.706 (P = .001), and the best cutoff was 9.0 mmol/L (sensitivity: 77.3%, specificity: 62.8%) (Fig. 2E). No significant predictive differences were observed in the DM group, with the highest AUROC for 1h-PG at 0.625 (P = .299) (Fig. 2F).
Comparison of RTL Across Groups Sorted by Glucose Tolerance Status and 1h-PG
First, we categorized NGT individuals into 2 groups based on 1h-PG levels (<8.6 mmol/L and ≥8.6 mmol/L) and assessed RTL differences across NGT with low 1h-PG (<8.6 mmol/L), NGT with high 1h-PG (≥8.6 mmol/L), pre-DM, and DM groups. The results showed that NGT with high 1h-PG individuals exhibited significantly shorter RTL compared to those with low 1h-PG. Furthermore, the RTL in the NGT with the high 1h-PG group paralleled that of the pre-DM group but was longer than that observed in the DM group (Fig. 3A).
*Comparison of LTL across groups sorted by glucose tolerance status and 1h-PG. (3A) Comparison of RTL across NGT with 1h-PG < 8.6 mmol/L, NGT with 1h-PG ≥ 8.6 mmol/L, pre-DM, and DM groups; (3B) comparison of RTL across NGT, pre-DM with 1h-PG < 11.6 mmol/L, pre-DM with 1h-PG ≥ 11.6 mmol/L, and DM groups; (3C) comparison of RTL across NGT, pre-DM with 1h-PG < 8.6 mmol/L, pre-DM with 8.6 ≤ 1h-PG < 11.6 mmol/L, pre-DM with 1h-PG ≥ 11.6 mmol/L, and DM groups. *P < .05; **P < .01; ***P < .0001; P < .05 indicates statistical difference. The vertical axis units in panels 3A, 3B, and 3C are the same, representing the level of RTL.Abbreviations: 1h-PG, 1-hour post-load plasma glucose; DM, diabetic group; NGT, normal glucose tolerance; ns, no significance; pre-DM, prediabetic group; RTL, relative telomere length.
Next, we categorized the pre-DM population based on 1h-PG into 2 groups: 1h-PG < 11.6 mmol/L and 1h-PG ≥ 11.6 mmol/L. We then compared the RTL among NGT, pre-DM with low 1h-PG (<11.6 mmol/L), pre-DM with high 1h-PG (≥11.6 mmol/L), and DM groups. The results showed that pre-DM with low 1h-PG had RTL comparable to the NGT group, while those with high 1h-PG showed an RTL match with the DM group (Fig. 3B).
Finally, we further subdivided the pre-DM participants based on their 1h-PG levels into 3 groups: 1h-PG < 8.6 mmol/L, 8.6 ≤ 1h-PG < 11.6 mmol/L, and 1h-PG ≥ 11.6 mmol/L. We compared the RTL of these 3 groups with those of the NGT and DM groups. The results showed that the RTL of the pre-DM group with 1h-PG between 8.6 and 11.6 mmol/L was significantly shorter than that of the pre-DM group with 1h-PG below 8.6 mmol/L. Moreover, the RTL of the pre-DM group with 1h-PG < 8.6 mmol/L was similar to that of the NGT group, while the RTL levels of the pre-DM groups with 8.6 ≤ 1h-PG < 11.6 mmol/L and 1h-PG ≥ 11.6 mmol/L, as well as the DM group, were comparable (Fig. 3C).
Additionally, to mitigate the impact of age differences on RTL levels across glucose tolerance groups, we compared their age distributions. The results showed no significant age differences, with mean ages of 55.0 ± 10.4 years for the NGT group, 57.0 ± 10.5 years for the pre-DM group, and 58.0 ± 8.3 years for the DM group. Spearman correlation analysis revealed a significant negative correlation between age and RTL in all 3 groups (Fig. 4).
The association between age and RTL across different glucose tolerance groups. (A) Normal glucose tolerance group; (B) prediabetic group; (C) diabetic group. Spearman correlation analysis was used to examine the relationship between age and RTL. P < .05 indicates statistical difference. The vertical axis units in panels A, B, and C are the same, representing the level of RTL.Abbreviation: RTL, relative telomere length.
Discussion
By conducting a cross-sectional and prospective study based on a Chinese community cohort, we found that 1h-PG was more effective at identifying and predicting telomere shortening compared to other glycemic parameters, including 2h-PG. Additionally, NGT and pre-DM but with elevated 1h-PG populations showed telomere lengths comparable to pre-DM and DM populations, respectively.
Previous studies have illuminated a relationship between traditional glucose parameters and telomere length, yet the results were varied among different studies. Krasnienkov et al (9) identified that the correlations between FPG and 2h-PG with telomere length vary by glucose tolerance status and may be influenced by age. Moreover, the relationship between HbA1c and telomere length is not yet conclusively defined (7). These results implied that traditional glucose indicators may not be a stable marker for telomere attrition with their reliability potentially affected by metabolic and age-related factors. However, no previous studies have reported the relationship between 1h-PG and telomere length.
While research about the relationship between 1h-PG and telomere length is lacking, existing evidence shows that 1h-PG detects metabolic disorders more sensitively than traditional glycemic parameters. Individuals with NGT but elevated 1h-PG (≥8.6 mmol/L) showed high levels of oxidative stress, inflammation, and endothelial dysfunction, potentially escalating the risk of cardiovascular complications (25, 26). NGT individuals with 1h-PG ≥8.6 mmol/L are at increased risk for renal impairment and microalbuminuria (27). Furthermore, patients in the early stages of nonalcoholic fatty liver disease exhibit raised 1h-PG levels but normal FPG or 2h-PG (28). Moreover, a cohort study followed up for 30 years showed that non-DM individuals with a 1h-PG > 11.1 mmol/L exhibited a 1.49-fold increased risk for death compared with 1h-PG ≤11.1 mmol/L (29). To some extent, these studies provide support for our findings that 1h-PG may also have an advantage in screening for telomere shortening.
Mechanistically, existing research emphasizes that 1h-PG may better reflect pancreatic β-cells function. Studies have found that in individuals with NGT, an elevation in 1h-PG is associated with reductions in Matsuda's insulin sensitivity index and the oral disposition index, which respectively measure insulin sensitivity and β-cell function (30). Additionally, the Insulinogenic Index, a marker for assessing early-phase insulin secretion from β-cells, and the Homeostatic Model Assessment of Beta-cell Function both exhibit a stronger negative correlation with 1h-PG compared to other glycemic markers (31). This suggests that 1h-PG has a higher potential for detecting early changes in glucose metabolism.
Recently, several large-scale cohort studies from China have shown a close relationship between LTL and metabolic diseases, particularly diabetes (32). For example, Cheng et al (8), who conducted an 8.8-year follow-up study of 5506 Chinese patients with type 2 diabetes, revealed that shorter LTL predicts diabetes progression and glycemic deterioration. The authors also found that shorter LTL increases the risk of renal function decline, end-stage renal disease, and cardiovascular events in type 2 diabetes populations (33, 34). Our findings show a significant negative correlation between LTL and 1h-PG. Compared to other glucose parameters, elevated 1h-PG can more effectively identify the risk of telomere shortening earlier, even in non-DM individuals. Therefore, the reported advantage of 1h-PG in early detection of metabolic disorders may be related to its ability to detect early telomere shortening and aging risk.
Strengths and Limitations
To the best of our knowledge, this is the first study demonstrating that 1h-PG better predicts telomere attrition than traditional glycemic parameters. We conducted both cross-sectional and longitudinal analyses and separately examined non-DM and DM populations to provide a more comprehensive interpretation.
The study has limitations. First, the longitudinal study had a low follow-up rate, primarily due to our reliance on voluntary participation for recruitment and recall, with some individuals possibly abstaining due to personal reasons. Second, in the longitudinal study, the results for the DM group were not statistically significant, possibly due to a small sample size. Further research with larger samples is needed to confirm these findings. Third, although we accounted for multiple significant confounding factors, the possibility of other influencing factors not being excluded cannot be dismissed. Fourth, our research was conducted in a Chinese population and may not be applicable to a broader demographic, warranting verification through studies in different ethnicities or regions.
Conclusions
In summary, our study first found a significant negative correlation between 1h-PG and LTL and demonstrated a unique advantage over other glycemic parameters in predicting telomere attrition. This study broadens the predictive value of 1h-PG in aging, further providing substantial evidence about the superiority of 1h-PG in forecasting metabolic disorders compared to traditional glucose parameters.
The reference list from the paper itself. Each links out to its DOI / PubMed record.
- 1Moqri M, Herzog C, Poganik JR, et al Biomarkers of aging for the identification and evaluation of longevity interventions. Cell. 2023;186(18):3758‐3775.37657418 10.1016/j.cell.2023.08.003PMC 11088934 · doi ↗ · pubmed ↗
- 2Keshavarz M, Xie K, Bano D, Ehninger D. Aging-What it is and how to measure it. Mech Ageing Dev. 2023;213:111837.37302556 10.1016/j.mad.2023.111837 · doi ↗ · pubmed ↗
- 3Behr LC, Simm A, Kluttig A, Grosskopf Großkopf A. 60 years of healthy aging: on definitions, biomarkers, scores and challenges. Ageing Res Rev. 2023;88:101934.37059401 10.1016/j.arr.2023.101934 · doi ↗ · pubmed ↗
- 4Aguado J, d'Adda di Fagagna F, Wolvetang E. Telomere transcription in ageing. Ageing Res Rev. 2020;62:101115.32565330 10.1016/j.arr.2020.101115 · doi ↗ · pubmed ↗
- 5López-Otín C, Blasco MA, Partridge L, Serrano M, Kroemer G. Hallmarks of aging: an expanding universe. Cell. 2023;186(2):243‐278.36599349 10.1016/j.cell.2022.11.001 · doi ↗ · pubmed ↗
- 6Tamura Y, Takubo K, Aida J, Araki A, Ito H. Telomere attrition and diabetes mellitus. Geriatr Gerontol Int. 2016;16 Suppl 1(S 1):66‐74.27018285 10.1111/ggi.12738 · doi ↗ · pubmed ↗
- 7Tamura Y, Izumiyama-Shimomura N, Kimbara Y, et al β-cell telomere attrition in diabetes: inverse correlation between Hb A 1c and telomere length. J Clin Endocrinol Metab. 2014;99(8):2771‐2777.24735425 10.1210/jc.2014-1222 · doi ↗ · pubmed ↗
- 8Cheng F, Luk AO, Shi M, et al Shortened leukocyte telomere length is associated with glycemic progression in type 2 diabetes: a prospective and Mendelian randomization analysis. Diabetes Care. 2022;45(3):701‐709.35085380 10.2337/dc 21-1609 PMC 8918237 · doi ↗ · pubmed ↗