On the approximation of sum of lognormal for correlated variates and implementation
Asyraf Nadia Mohd Yunus, Nora Muda, Abdul Rahman Othman, Sonia Aïssa

TL;DR
This paper compares three methods for approximating the sum of correlated lognormal variables and finds that the Wilkinson method performs best across various scenarios.
Contribution
The study provides new empirical evidence that the Wilkinson method outperforms others for correlated lognormal sums.
Findings
Wilkinson approximation has the lowest Type I error rates across all tested correlation structures and sample sizes.
Results were validated using real-world datasets from engineering and finance, confirming Wilkinson's superior performance.
The findings contradict prior telecommunications literature that favored the Schwartz & Yeh method.
Abstract
In probabilistic modeling across engineering, finance, and telecommunications, sums of lognormal random variables frequently occur, yet no closed-form expression exists for their distribution. This study systematically evaluates three approximation methods—Wilkinson (W), Schwartz & Yeh (SY), and Inverse (I)—for correlated lognormal variates across varying sample sizes and correlation structures. Using Monte Carlo simulations with 5, 15, 25, and 30 samples and correlation coefficients of 0.3, 0.6, and 0.9, we compared Type I error rates through Anderson-Darling goodness-of-fit tests. Our findings demonstrate that the Wilkinson approximation consistently outperforms the other methods for correlated variates, exhibiting the lowest Type I error rates across all tested scenarios. This contradicts some previous findings in telecommunications literature where SY was preferred. We validated…
Genes, proteins, chemicals, diseases, species, mutations and cell lines named across the full text — each resolved to its canonical identifier and authoritative record.
Click any figure to enlarge with its caption.
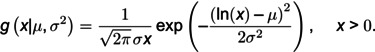 Figure 1
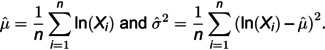 Figure 2
 Figure 3
 Figure 4
 Figure 5
 Figure 6
 Figure 7
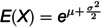 Figure 8
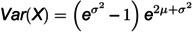 Figure 9
 Figure 10
 Figure 11
 Figure 12
 Figure 13
 Figure 14
 Figure 15
 Figure 16
 Figure 17
 Figure 18
 Figure 19
 Figure 20
 Figure 21
 Figure 22
 Figure 23
 Figure 24
 Figure 25
 Figure 26
 Figure 27
 Figure 28
 Figure 29
 Figure 30
 Figure 31
 Figure 32
 Figure 33
 Figure 34
 Figure 35
 Figure 36
 Figure 37
 Figure 38
 Figure 39
 Figure 40
 Figure 41
 Figure 42
 Figure 43
 Figure 44
 Figure 45
 Figure 46
 Figure 47
 Figure 48
 Figure 49
 Figure 50
Peer Reviews
No public reviews on file for this paper yet. If you reviewed it on a platform where reviews are public (OpenReview, ICLR, NeurIPS, ICML), you can paste yours below so the community can read it here.
Videos
No videos yet. Explain this paper in a talk, walkthrough, or lecture? Add one.
Taxonomy
TopicsImage and Signal Denoising Methods