Assessing Renal Function in Chronic Kidney Disease: A Comparative Evaluation of Glomerular Filtration Rate Prediction Equations in the North-Central Region of Nigeria
Olawale Bakare, Emmanuel I Agaba, Zumnan M Gimba, Esala E Abene, Lucius Imoh, Joseph Maji

TL;DR
This study compares different equations for estimating kidney function in Nigerian patients with chronic kidney disease and finds them to be accurate when compared to a 24-hour urine test.
Contribution
The study evaluates the performance of GFR prediction equations in a Nigerian CKD population and identifies the Cockcroft-Gault equation as the most precise.
Findings
All three GFR equations (CG, MDRD, CKD-EPI) showed strong correlation with measured creatinine clearance.
The Cockcroft-Gault equation had the least bias and highest precision in patients with GFR below 45 mL/min.
Albuminuria was significantly associated with all GFR equations, and age correlated with CrCl and GFR estimates.
Abstract
Background: The glomerular filtration rate (GFR) is considered the gold standard for assessing renal function. According to the Kidney Disease: Improving Global Outcomes (KDIGO) guidelines, GFR estimation is often carried out using predictive equations that incorporate serum creatinine levels, along with demographic factors such as age, gender, race, and body size. However, these equations exhibit varying levels of accuracy across different populations, necessitating the evaluation of their performance and clinical relevance in diverse patient groups. Objectives: This study aimed to evaluate the performance of three commonly used GFR estimation equations, the Cockcroft-Gault (CG), Modification of Diet in Renal Disease (MDRD), and Chronic Kidney Disease Epidemiology Collaboration (CKD-EPI) equations, along with their race-modified versions, by comparing them with measured 24-hour…
Genes, proteins, chemicals, diseases, species, mutations and cell lines named across the full text — each resolved to its canonical identifier and authoritative record.
Click any figure to enlarge with its caption.
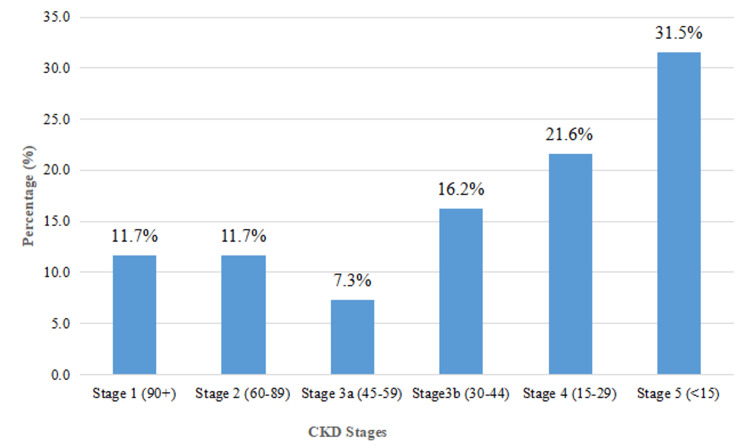 Figure 1
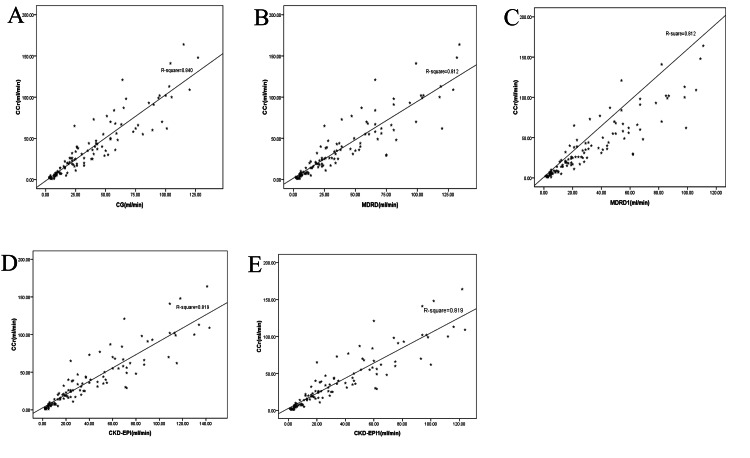 Figure 2
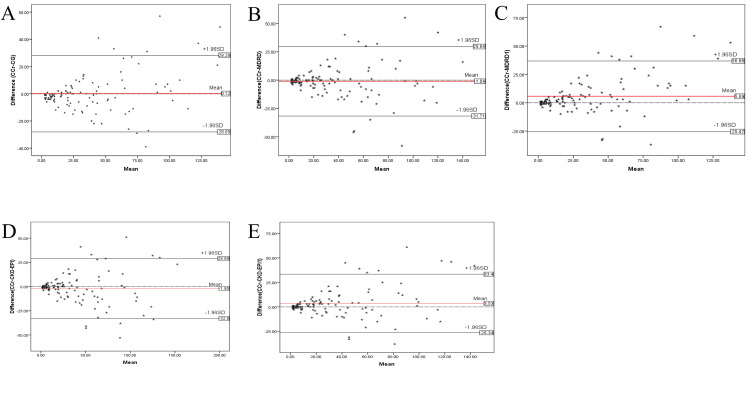 Figure 3
| Variable | Frequency | Percent |
| Mean age (51.1±15.5 years) | ||
| Sex | ||
| Male | 58 | 52.3 |
| Female | 53 | 47.7 |
| Employment status | ||
| Employed | 67 | 60.4 |
| Unemployed or retired | 44 | 39.6 |
| Settlement pattern | ||
| Urban | 107 | 96.4 |
| Rural | 4 | 3.6 |
| Median duration of CKD: 12.6 months (IQR: 6-48 months) | ||
| Family history of CKD | ||
| No known family history | 93 | 83.8 |
| At least one family member affected by CKD | 18 | 16.2 |
| Causes of CKD | ||
| DM | 42 | 37.8 |
| CGN | 26 | 23.4 |
| HTN | 14 | 12.6 |
| ADPKD | 11 | 9.9 |
| Obstructive nephropathy | 9 | 8.1 |
| Unknown | 3 | 2.7 |
| MCD | 2 | 1.8 |
| Multiple myeloma | 1 | 0.9 |
| IGA nephropathy | 1 | 0.9 |
| Sickle cell nephropathy | 1 | 0.9 |
| SLE | 1 | 0.9 |
| Variables | Overall | Male | Female | T-test | p-value |
| Weight (kg), mean±SD | 68.6±13.0 | 69.5±10.9 | 67.7±15.1 | 0.735 | 0.464 |
| Height (m), mean±SD | 1.64±0.09 | 1.70±0.06 | 1.58±0.06 | 10.848 | <0.001* |
| BMI (kg/m2), mean±SD | 25.7±5.3 | 24.1±3.9 | 27.4±6.1 | 3.358 | 0.001* |
| BSA (m2), mean±SD | 1.7±0.3 | 1.8±0.3 | 1.7±0.2 | 0.611 | 0.543 |
| SBP (mm/Hg), mean±SD | 148.5±34.1 | 151.6±27.7 | 145.0±40.0 | 1.013 | 0.313 |
| DBP (mm/Hg), mean±SD | 91.2±20.2 | 93.9±21.1 | 88.1±18.9 | 1.547 | 0.125 |
| Duration of CKD (months), median (IQR) | 12.4 (6-48) | 12 (6-36) | 12 (6.5-66.0) | U=1395.000 | 0.362 |
| Urinalysis | N (%) OR median (IQR) |
| Dipstix protein | |
| Yes | 84 (75.7) |
| No | 27 (24.3) |
| Urine volume in 24 hours (mL) | 2020.0 (1320.0-2920.0) |
| Urine albumin concentration (mg/L) | 168.0 (27.0-1758.3) |
| Urine Cr (umol/L) | 4220.0 (3240.0-6390.0) |
| ACR (mg/g) | 395.5 (45.3-2887.0) |
| Serum Cr (umol/L) | 219.0 (108.0-536) |
| Equation | Median (IQR) | W-test | P-value |
| CrCl | 26 (9-56) | Ref. | Ref. |
| CG | 26 (12-54) | 1.261 | 0.207 |
| MDRD | 26 (11-60) | 1.672 | 0.095 |
| MDRD1 | 22 (9-50) | 3.924 | <0.001* |
| CKD-EPI | 26 (10-62) | 1.770 | 0.077 |
| CKD-EPI1 | 22 (9-53) | 2.332 | 0.020* |
| Equation | Bias (mL/min/1.73m2) | Precision | Accuracy (%) |
| CG | 0.12 | 14.4 | 59.5 |
| MDRD | -1.04 | 15.65 | 59.5 |
| MDRD1 | 5.69 | 15.90 | 62.2 |
| CKD-EPI | -1.95 | 15.80 | 58.6 |
| CKD-EPI1 | 3.53 | 15.24 | 61.3 |
| Equations | CrCl | Urinary ACR | ||
| Rho | P-value | Rho | P-value | |
| CG | 0.948 | <0.001* | -0.520 | <0.001* |
| MDRD | 0.940 | <0.001* | -0.528 | <0.001* |
| MDRD1 | 0.939 | <0.001* | -0.527 | <0.001* |
| CKD-EPI | 0.943 | <0.001* | -0.527 | <0.001* |
| CKD-EPI1 | 0.942 | <0.001* | -0.525 | <0.001* |
| Equations | Stage 1 | Stage 2 | Stage 3a | Stage 3b | Stage 4 | Stage 5 | ||||||
| Rho | P-value | Rho | P-value | Rho | P-value | Rho | P-value | Rho | P-value | Rho | P-value | |
| CG | 0.602 | 0.029* | -0.441 | 0.132 | 0.518 | 0.188 | 0.076 | 0.765 | 0.076 | 0.765 | 0.815 | <0.001* |
| MDRD | 0.556 | 0.048 | -0.499 | 0.082 | 0.204 | 0.629 | 0.005 | 0.984 | 0.005 | 0.984 | 0.825 | <0.001* |
| MDRD1 | 0.546 | 0.053 | -0.515 | 0.072 | 0.204 | 0.629 | 0.012 | 0.961 | 0.012 | 0.961 | 0.804 | <0.001* |
| CKD-EPI | 0.445 | 0.128 | -0.505 | 0.782 | 0.157 | 0.711 | -0.024 | 0.925 | -0.024 | 0.925 | 0.828 | <0.001* |
| CKD-EPI1 | 0.445 | 0.128 | -0.505 | 0.782 | 0.157 | 0.711 | -0.032 | 0.901 | -0.032 | 0.901 | 0.823 | <0.001* |
| CKD stages (mean±SD) | Creatine clearance (mean±SD) | CG (mean±SD) | MDRD (mean±SD) | MDRD1 (mean±SD) | CKD-EPI (mean±SD) | CKD-EPI1 (mean±SD) | F-test (P-value) |
| Stage 1 | 117.4±25.5 | 99.5±21.9 | 100.1±24.7 | 82.8±20.4 | 105.7±25.6 | 91.2±22.3 | 3.339(0.009)* |
| Stage 2 | 71.0±8.9 | 71.3±23.7 | 70.5±26.5 | 58.3±21.8 | 74.1±28.7 | 64.0±25.0 | 0.955(0.450) |
| Stage 3a | 51.7±4.8 | 50.8±9.3 | 54.3±20.7 | 45.2±17.2 | 55.3±19.4 | 47.7±16.7 | 0.364(0.869) |
| Stagg 3b | 38.5±12.8 | 40.4±11.8 | 41.3±15.3 | 34.1±12.7 | 41.4±15.6 | 35.6±13.3 | 1.063(0.385) |
| Stage 4 | 23.1±10.5 | 24.6±8.8 | 25.5±12.9 | 21.0±10.8 | 24.7±12.6 | 21.4±11.0 | 0.939(0.458) |
| Stage 5 | 6.0±4.7 | 9.1±5.1 | 7.5±5.1 | 6.3±4.3 | 7.2±5.0 | 6.2±4.4 | 2.229(0.053) |
| Overall mean | 39.0±37.1 | 38.9±32.9 | 38.9±34.6 | 32.2±28.6 | 39.9±36.6 | 34.4±31.6 | 0.963(0.440) |
| F (ANOVA) | 292.241 | 109.477 | 76.990 | 77.145 | 81.842 | 81.182 | - |
| P-value | <0.001* | <0.001* | <0.001* | <0.001* | <0.001* | <0.001* | - |
| Equation | Coef. | Equations | ||||
| CG | MDRD | MDRD1 | CKD-EPI | CKD-EPI1 | ||
| CG | Rho | Ref. | 0. 985 | 0. 984 | 0. 989 | 0. 988 |
| p-value | Ref. | <0.001* | <0.001* | <0.001* | <0.001* | |
| MDRD | Rho | 0. 985 | Ref. | 1.000 | 0.998 | 0.999 |
| p-value | <0.001* | Ref. | <0.001* | <0.001* | <0.001* | |
| MDRD1 | Rho | 0. 984 | 1.000 | Ref. | 0.999 | 0.999 |
| p-value | <0.001* | <0.001* | Ref. | <0.001* | <0.001* | |
| CKD-EPI | Rho | 0. 989 | 0.999 | 0.998 | Ref. | 0.999 |
| p-value | <0.001* | <0.001* | <0.001* | Ref. | <0.001* | |
| CKD-EPI1 | Rho | 0. 988 | 0.999 | 0.999 | 0.999 | Ref. |
| p-value | <0.001* | <0.001* | <0.001* | <0.001* | Ref. | |
| Variable | Unadjusted | Multiple regression | ||
| Coefficient (B) | P-value | Coefficient (B) | P-value | |
| (Constant) | Ref. | Ref. | 67.121 | 0.001 |
| Age | -0.528 | 0.016* | -0. 585 | 0.010* |
| Sex | -3.837 | 0.574 | 5.599 | 0.449 |
| Residence | 11.514 | 0.529 | 10.980 | 0.531 |
| BMI | 0.115 | 0.863 | 0.447 | 0.518 |
| HTN | -15.204 | 0.027* | -9.145 | 0.214 |
| Diabetes | -6.964 | 0.847 | -14.788 | 0.673 |
| Connective tissue disease | 24.318 | 0.501 | 13.156 | 0.706 |
| Albumin | -0.008 | 0.002* | -0.009 | 0.001* |
| CG | ||||
| (Constant) | Ref. | Ref. | 59.336 | 0.001 |
| Age | -0.478 | 0.013* | -0.528 | 0.007* |
| Sex | -7.058 | 0. 238 | 2.225 | 0.727 |
| Residence | 11.636 | 0.469 | 12.046 | 0.465 |
| BMI | 0.451 | 0.439 | 0.655 | 0.272 |
| HTN | -15.330 | 0.001* | 24.306 | 0.419 |
| Diabetes | -7.855 | 0.804 | -13.543 | 0.654 |
| Connective tissue disease | 37.555 | 0.235 | -9.610 | 0.131 |
| Albumin | -0.007 | 0.001* | -0.007 | 0.001* |
| MDRD | ||||
| (Constant) | Ref. | Ref. | 85.654 | 0.079 |
| Age | -0.353 | 0.097 | -0.381 | 0.074 |
| Sex | -3.190 | 0.629 | -5.804 | 0.415 |
| Residence | 12.773 | 0.470 | -9.642 | 0.568 |
| BMI | -0.197 | 0.759 | -0.030 | 0.964 |
| HTN | 19.467 | 0.004 | 16.351 | 0.025* |
| Diabetes | -4.982 | 0.887 | -21.187 | 0.513 |
| Connective tissue disease | 32.355 | 0.354 | 17.597 | 0.600 |
| Albumin | -0.008 | -0.001* | -0.008 | 0.001* |
| MDRD1 | ||||
| (Constant) | Ref. | Ref. | 58.869 | 0.081 |
| Age | -0.288 | 0.101 | -0.312 | 0.076 |
| Sex | -2.528 | 0.643 | -4.948 | 0.401 |
| Residence | 10.418 | 0.476 | -7.806 | 0.576 |
| BMI | -0.160 | 0.763 | 0.029 | 0.958 |
| HTN | 16.125 | 0.004 | 13.561 | 0.025* |
| Diabetes | -4.245 | 0.883 | -17.789 | 0.524 |
| Connective tissue disease | 27.036 | 0.348 | 14.837 | 0.592 |
| Albumin | -0.007 | 0.001* | -0.007 | 0.001* |
| CKD-EPI | ||||
| (Constant) | Ref. | Ref. | 80.878 | 0.058 |
| Age | -0.496 | 0.027* | -0.517 | 0.021* |
| Sex | -3.706 | 0.597 | -5.974 | 0.423 |
| Residence | 14.154 | 0.451 | -10. 813 | 0.540 |
| BMI | -0.325 | 0.632 | -0.012 | 0.986 |
| HTN | 21.964 | 0.002* | 18.276 | 0.017* |
| Diabetes | -6.918 | 0.852 | -22.844 | 0.518 |
| Connective tissue disease | 35.464 | 0.338 | 20.001 | 0.569 |
| Albumin | -0.008 | 0.002* | -0.009 | 0.001* |
| CKD-EPI1 | ||||
| (Constant) | Ref. | Ref. | 89.909 | 0.058 |
| Age | -0.428 | 0.027* | -0.446 | 0.021* |
| Sex | -3.157 | 0.602 | -5.167 | 0.422 |
| Residence | 12.065 | 0.456 | -9.187 | 0.547 |
| BMI | -0.290 | 0.621 | -0.022 | 0.971 |
| HTN | 18.879 | 0.002 | 15.683 | 0.018* |
| Diabetes | -6.427 | 0.841 | -20.120 | 0.510 |
| Connective tissue disease | 30.909 | 0.333 | 17.684 | 0.560 |
| Albumin | -0.007 | 0.002* | -0.008 | 0.001* |
Peer Reviews
No public reviews on file for this paper yet. If you reviewed it on a platform where reviews are public (OpenReview, ICLR, NeurIPS, ICML), you can paste yours below so the community can read it here.
Videos
No videos yet. Explain this paper in a talk, walkthrough, or lecture? Add one.
Taxonomy
TopicsChronic Kidney Disease and Diabetes · Insurance, Mortality, Demography, Risk Management · Blood Pressure and Hypertension Studies
Introduction
Chronic kidney disease (CKD) is a clinical syndrome marked by abnormalities in kidney structure or function persisting for over three months, with significant implications for overall health [1,2]. According to the National Kidney Foundation's Kidney Disease Outcomes Quality Initiative (NKF/KDOQI), CKD is diagnosed when kidney damage lasts more than three months, with or without reduced glomerular filtration rate (GFR). Diagnosis is established through pathological abnormalities, markers of kidney damage, or a history of kidney transplantation. Alternatively, CKD is identified when an individual's GFR remains below 60 mL/min/1.73 m² for three months or longer, even in the absence of overt kidney damage [3].
The global burden of CKD is escalating, with an annual increase of 8%, disproportionately affecting developing nations [4,5]. In 2015, the World Health Organization (WHO) estimated 1.2 million deaths from renal failure globally, with the current toll reaching 5-10 million deaths annually [6]. In Africa, the CKD prevalence is estimated at 15.8%, with sub-Saharan Africa bearing the heaviest burden [7]. Nigeria, in particular, faces a high CKD prevalence, with rates ranging from 1.6% to 12.4% across various studies [8].
Estimating GFR from serum creatinine levels is a standard practice, using equations that account for age, sex, race, and body size to reflect creatinine generation [9,10]. The Cockroft-Gault (CG) formula, introduced in 1976, estimates creatinine clearance (CrCl) based on these factors but has limitations, including imprecision at higher GFR levels [11,12]. It estimates CrCl rather than true GFR, leading to an overestimation due to unaccounted creatinine secretion [12,13]. Additionally, the CG formula was developed using older creatinine assay methods, which may produce inaccuracies with modern techniques [11,13].
The Modification of Diet in Renal Disease (MDRD) study equation, developed from a multi-center trial involving 1,628 CKD patients, estimates GFR using serum creatinine, age, sex, and race [13]. While validated in African-Americans, diabetic nephropathy patients, and transplant recipients, the MDRD equation tends to underestimate GFR in individuals with higher renal function, potentially leading to CKD over-diagnosis [14]. To address these limitations, the Chronic Kidney Disease Epidemiology Collaboration (CKD-EPI) equation was developed in 2009 [13]. Using the same four variables, the CKD-EPI equation provides more accurate GFR estimates, particularly for values above 60 mL/min/1.73 m², and is now recommended by the National Kidney Foundation and Kidney Disease: Improving Global Outcomes (KDIGO) guidelines for adult GFR estimation [15].
The accuracy of these predictive equations depends on their correlation with measured GFR, but concerns arise regarding their applicability across diverse populations. Most equations were developed in Caucasian and African-American populations with a racial correction factor, whose validity for other populations of African ancestry is debated [16]. Studies in healthy Congolese adults, Malawian HIV-positive and HIV-negative individuals, and Ghanaian cohorts suggest that omitting the racial correction factor may improve equation performance [17-20]. Similarly, Nigerian studies indicate that the CG and MDRD equations reliably estimate GFR in CKD patients, with stronger correlations between the MDRD and CKD-EPI equations [21]. However, research in sickle cell disease patients has shown correlations between the CKD-EPI and CG formulas [22], emphasizing the need for validation in various clinical populations.
Given the KDIGO guidelines' endorsement of equations like CG, MDRD, and CKD-EPI for GFR estimation, it is crucial to assess their performance in Nigerian CKD patients. Ensuring accurate diagnosis and staging through validated predictive equations is essential for optimizing patient care and health outcomes in this high-burden population.
Aim
This study aimed to evaluate the performance of the three commonly used GFR estimation equations - Cockcroft-Gault (CG), MDRD, and CKD-EPI - with and without race modifications, compared to the 24-hour CrCl measurement in adult patients with CKD.
Materials and methods
Between November 2019 and July 2020, a hospital-based cross-sectional study was conducted at Jos University Teaching Hospital (JUTH), a 520-bed facility offering both inpatient and outpatient services. Eligible and consenting patients with CKD aged 18 years and older who were accessing nephrology services at JUTH were recruited consecutively through a convenience sampling method. The sample size was calculated using Modified Cochran’s formula, yielding a minimum of 102 participants, though 111 patients were ultimately recruited to enhance the robustness of the study.
Participants were eligible for inclusion if they were 18 years or older and had stable renal function, defined as no significant change in estimated glomerular filtration rate (eGFR) or serum creatinine levels over the preceding four weeks. Patients with acute kidney injury (AKI), those undergoing dialysis for end-stage renal disease (ESRD), individuals with congestive cardiac failure, pregnant women, and renal transplant recipients were excluded to ensure a well-defined study population for accurate assessment of kidney function and the applicability of predictive equations in CKD diagnosis and staging.
Data collection involved the use of consent forms and structured questionnaires to capture relevant clinical and demographic information (Appendices A and B (Table 11)). For sample collection and physical assessments, various materials and equipment were utilized, including 5 L wide-mouth containers for urine collection, measuring jars, plain sample bottles for serum and urine creatinine determination, sterile needles and syringes, tourniquets, latex gloves, cotton wool, methylated spirit, and plaster. Weight and height measurements were taken using a SECA bathroom scale and SECA stadiometer (SECA GmbH & Co. KG, Hamburg, Germany), while blood pressure was measured using an Accoson sphygmomanometer (Accoson Ltd., Essex, UK) with appropriately sized cuffs.
Participants were interviewed by the researcher to collect demographic data, medical history, and duration of illness. Information on etiological diagnosis, family history of CKD, comorbidities, and drug history was documented, with any recall difficulties addressed by extracting relevant data from the participant's medical records. Consenting participants were admitted to the ward on a predetermined date for 24-hour urine collection and blood sample collection. They were instructed to void at zero hours, discarding the initial urine sample, while subsequent samples were collected in wide-mouth containers containing boric acid until the 24th hour when the final sample was obtained. The entire collection process was closely supervised to ensure accuracy and completeness. After urine collection, approximately 5 mL of venous blood was drawn from each participant into plain bottles, after which they were discharged home.
The total volume of urine collected over 24 hours in the laboratory was measured using a calibrated measuring jar. Two-milliliter aliquots of urine were taken and stored in plain bottles for further analysis. Blood samples were centrifuged to separate serum, and serum and urinary creatinine were analyzed using a kinetic colorimetric assay based on Jaffe's method with an automated Cobas C111 chemistry analyzer (Roche Diagnostics, Mannheim, Germany). This assay involves the formation of a yellow-red complex between creatinine and picrate in an alkaline solution, with the rate of dye formation proportional to the creatinine concentration in the specimen. The method incorporates "rate-blanking" to minimize interference from bilirubin and corrects for non-specific reactions caused by pseudo-creatinine chromogens, such as proteins and ketones.
Urinary albumin was measured using an immunofluorescence method on a semi-automated Ichroma Analyzer (Boditech Med. Inc, South Korea). This assay utilizes a sandwich immunodetection method, where a labeled detector antibody binds to albumin in the urine sample, forming an antigen-antibody complex. This complex is subsequently captured by another immobilized labeled antibody for detection, with the intensity of fluorescence directly proportional to the albumin concentration in the urine sample.
This meticulous methodology, from patient recruitment to sample analysis, ensured reliable data collection and accurate laboratory assessments, providing a robust framework for evaluating kidney function and the role of predictive equations in CKD diagnosis and staging. Operational and statistical definitions are in Appendix C.
Determination of GFR using 24-hour CrCl
The GFR was calculated using the following formula:
\begin{document} CrCl = UCr * V/PCr \end{document}
(CrCl = creatinine clearance (mL/min), UCr = urinary concentration of creatinine (mg/dL), V = urine flow rate (volume voided per minute, 1440 minutes for 24-hour collection), PCr = serum creatinine concentration (mg/dL)).
To standardize the measured CrCl for each participant, the value was corrected to a body surface area (BSA) of 1.73 m² using the following equation:
\begin{document} Corrected CrCl = CrCl (Measured 24-hour)* BSA/1.73m2 \end{document}
CrCl was used as the reference standard for this study.
Determination of eGFR using the CG equation
eGFR was calculated using the CG equation as follows:
\begin{document} eGFR = (140 - Age * weight)/ 0.814 * Scr(umol/L) \end{document} for men,and;
\begin{document} (140 - Age * weight)/ 0.814 * Scr(umol/L) * 0.85 \end{document} in women
(Age = age of the participant in years, Weight = weight of the participant in kg, Scr = serum creatinine concentration in µmol/L).
The electronic version of the CG equation was used for all participants. The predicted estimates for each participant were corrected to a BSA of 1.73 m² for uniformity with other equations and the measured 24-hour CrCl as follows:
\begin{document} CG= estimated CG * BSA/1.73m2 \end{document}
Determination of EGFR using the MDRD and MDRD1 equations
The eGFR was determined using the MDRD equations. The electronic calculator app was employed with inputs of serum creatinine, age, sex, and race. The manual calculation is outlined below:
\begin{document} GFR(mL/min/1.73m2) = 30,849 * SCr(umol/L)-1.154 * age-0.203 * 0.742(if female) * 1.210 (if black) \end{document}
\begin{document} GFR(mL/min/1.73m2) = 30,849 * SCr(umol/L)-1.154 * age-0.203 * 0.742(if female) \end{document}
Two results were obtained by including race in the equation (MDRD (Black)) and without race adjustment (MDRD1).
Determination of eGFR using the CKD-EPI and CKD-EPI1 equations
The eGFR was determined using the CKD-EP collaboration equations. The electronic calculator app was used with inputs of serum creatinine, age, sex, and race. The manual calculation formula is as follows:
\begin{document} GFR (mL/min/1.73m2) = 141 * min (SCr/k, 1) * max(SCr/k, 1)1.209 * 0.933age * 1.018(if female) * 1.57(if black) \end{document}
The formula without race correction is \begin{document} GFR (mL/min/1.73m2) = 141 * min (SCr/k, 1) * max(SCr/k, 1)1.209 * 0.933age * 1.018(if female) \end{document}
Results were generated with and without race input, producing the CKD-EPI and chronic kidney disease epidemiology collaboration without race correction (CKD-EPI1) estimates, respectively.
ACR
Two urine aliquots were collected to measure albumin concentration (mg) and creatinine concentration (g). The albumin-to-creatinine ratio (ACR) was expressed in mg/g, reflecting the daily protein excretion in milligrams.
Ethical considerations
Ethical clearance for the study was obtained from the Human Research and Ethical Committee of JUTH with approval number JUTH/DCS/ADM/127/XXVII/923 prior to the commencement of data collection. Informed consent was obtained from all participants before their inclusion in the study, and confidentiality was strictly maintained throughout the research process. Participants were fully informed of their right to withdraw or decline participation at any stage, with the assurance that their decision would be respected and would not affect the quality or continuity of their medical care. Furthermore, all investigations and hospital admissions related to the study were provided at no cost to the participants, ensuring equitable access to the necessary assessments without financial burden.
Data and statistical analysis
The data obtained from the questionnaires were meticulously edited, cleaned, coded, and entered into Microsoft Excel for initial processing. Subsequent data analysis was conducted using the Statistical Package for the Social Sciences (SPSS), version 20 (Chicago, Illinois, USA). Quantitative variables, such as age, weight, height, body mass index (BMI), and BSA, were summarized using means and standard deviations (SDs), while non-normally distributed variables, including the duration of CKD, urine volume, and other skewed measurements, were expressed as medians with interquartile ranges (IQRs). Categorical variables, such as sex and place of residence, were presented as percentages to provide a clear demographic overview of the study population.
To compare the mean eGFR derived from each equation across different GFR stages, analysis of variance (ANOVA) was employed. The Wilcoxon signed-rank test was used to compare the median values of each equation with the measured 24-hour CrCl, offering insight into how closely each equation approximated actual renal function. Spearman's rank correlation was applied to assess associations between 24-hour CrCl, urinary ACR, and the various eGFR equations, allowing for an evaluation of the strength and direction of these relationships.
Bland-Altman plots were generated to visually and statistically evaluate the performance of the equations against measured 24-hour CrCl, facilitating the determination of bias, precision, and accuracy. Agreement between the equations was further assessed using Spearman’s rank correlation, ensuring a robust comparison of their clinical applicability. Regression analysis was performed to investigate the correlation between eGFR equations and socio-demographic as well as cardiovascular risk factors, including age, sex, place of residence, hypertension, diabetes, and the presence of albuminuria. A p-value of less than 0.05 was considered statistically significant, with the confidence interval set at 95%. This rigorous statistical approach ensured a comprehensive evaluation of the equations’ validity and their potential utility in CKD diagnosis and management.
Results
Socio-demographic characteristics of study participants
The mean±standard deviation (SD) age of the participants was 51.1±15.5 years. More than half, 58 (52.3%) of the participants were male. Among the 111 participants, 67 (60.4%) were employed, while the remaining 44 (39.6%) were either unemployed or retired. The majority of the participants, 107 (96.4%), resided in urban areas, while four (3.6%) lived in rural settings.
Clinical characteristics of study participants
The median duration of CKD among the participants was 12.6 months, with an IQR of six to 48 months. A majority of the participants, 93 (83.8%), reported no known family history of CKD, while 18 (16.2%) had at least one family member affected by the condition. The etiological factors for CKD are presented in Table 1. The study found that 92 patients (82.9%) had hypertension as the most common co-morbidity. Additionally, one (0.9%) participant with hypertensive nephrosclerosis also had diabetes mellitus. Other comorbidities included chronic liver disease in two (1.8%) participants, obstructive uropathy in six (5.4%), connective tissue disease in one (0.9%), and retroviral disease in one (0.9%). Regarding medications, the most commonly used were angiotensin-converting enzyme (ACE) inhibitors or angiotensin receptor blockers (ARBs) (95 patients (85.6%)), diuretics (86 patients (77.5%)), and calcium channel blockers (75 patients (67.6%)).
Physical examination
The overall mean±SD weight of the participants was 68.6±13.0 kg. Male participants had a mean weight of 69.5±10.9 kg, while female participants had a mean weight of 67.7±15.1 kg. This difference was not statistically significant (p=0.464). The overall mean height was 1.64±0.09 m, with males having significantly greater mean height than females (p=0.017). In contrast, female participants had a significantly higher mean BMI of 27.4±6.1 kg/m² compared to male participants (p=0.001) (Table 2). The overall mean BSA was 1.7±0.3 m², with no statistically significant difference between male and female participants (p=0.543). The overall mean systolic blood pressure (SBP) was 148.5±34.1 mmHg, while the overall mean diastolic blood pressure (DBP) was 91.2±20.2 mmHg (Table 2).
Laboratory variables of study participants
Dipstick urinalysis revealed that 84 participants (75.7%) had proteinuria. The overall median urine volume over 24 hours was 2020 mL, with an IQR of 1320-2920 mL. The median urine albumin concentration was 168.0 mg/L, with an IQR of 27.0-1758.3 mg/L. The median serum creatinine level was 219.0 µmol/L, with an IQR of 108.0-536.0 µmol/L. The median urinary creatinine concentration was 4220.0 µmol/L, with an IQR of 3240.0-6390.0 µmol/L. The median ACR was 395.5 mg/g, with an IQR of 45.3-2887.0 mg/g (Table 3).
CrCl and eGFR calculated from the various equations
The median CrCl of the participants was 26 mL/min/1.73 m², with an IQR of 9-56 mL/min. The median values for the eGFR calculated using the various equations are presented in Table 4.
CKD stages
Based on the median CrCl, participants were classified into five stages of CKD. The majority were in stage 5 CKD (35 participants (31.5%)), followed by stage 4 (24 (21.6%)), stage 3b (18 (16.2%)), stages 1 and 2 (13 each (11.7%)), and stage 3a (8 (7.3%)) (Figure 1).
CKD stages with percentage distributionCKD, chronic kidney disease
Relationship between CrCl and the various equations
The study demonstrated a strong positive correlation between CrCl and the various eGFR equations. CrCl showed a robust positive correlation with the CG equation (Spearman’s correlation, r=0.948, p=0.001), the MDRD equation (r=0.940, p=0.001), MDRD1 (r=0.939, p=0.001), CKD-EPI (r=0.943, p=0.001), and CKD-EPI1 (r=0.942, p=0.001). Linear regression plots of the various equations against 24-hour CrCl indicated a significant positive correlation for all equations: CG (r=0.917), MDRD (r=0.901), MDRD1 (r=0.901), CKD-EPI (r=0.905), and CKD-EPI1 (r=0.905) (Figure 2).
Plot of measured 24-hour CrCl against the various equations A = plot of measured 24-hour CrCl against CG-predicted GFR values; B = plot of measured 24-hour CrCl against MDRD-predicted GFR values; C = plot of measured 24-hour CrCl against MDRD1-predicted GFR values; D = plot of measured 24-hour CrCl against CKD-EPI-predicted GFR values; E = plot of measured 24-hour CrCl against CKD-EPI1-predicted GFR valuesCrCl = creatinine clearance, CG = Cockroft-Gault, GFR = glomerular filtration rate, MDRD = Modification of Diet in Renal Disease, MDRD1 = Modification of Diet in Renal Disease without race correction, CKD-EPI = Chronic Kidney Disease Epidemiology Collaboration, CKD-EPI1 = Chronic Kidney Disease Epidemiology Collaboration without race correction
The mean difference between the CG-predicted CrCl and the measured 24-hour CrCl was 0.12±14.40 mL/min, with discordance observed at CrCl values >48 mL/min. Eight measurements were outside the 95% confidence interval. The mean difference between the MDRD-predicted GFR and the measured 24-hour CrCl was -1.04±15.65 mL/min, with discordance at CrCl values >45 mL/min. Nine measurements were outside the 95% confidence interval. The mean difference between the MDRD1-predicted GFR and the measured 24-hour CrCl was 5.69±15.90 mL/min, with discordance at CrCl values >45 mL/min. Ten measurements were outside the 95% confidence interval. The mean difference between the CKD-EPI-predicted GFR and the measured 24-hour CrCl was -1.95±15.80 mL/min, with discordance at CrCl values >48 mL/min. Ten measurements were outside the 95% confidence interval. The mean difference between the CKD-EPI1-predicted GFR and the measured 24-hour CrCl was -3.53±15.24 mL/min, with discordance at CrCl values >45 mL/min. Eleven measurements were outside the 95% confidence interval (Figure 3).
The mean difference between 24-hour CrCl against the various equationsA = plot showing the difference between the CG-predicted CrCl and the measured 24-hour CrCl. B = plot showing the difference between the MDRD-predicted GFR and the measured 24-hour CrCl; C = plot showing the difference between the MDRD1-predicted GFR and the measured 24-hour CrCl. D = plot showing the difference between the CKD-EPI-predicted GFR and the measured 24-hour CrCl; E = plot showing the difference between the CKD-EPI1-predicted GFR and the measured 24-hour CrClCrCl = creatinine clearance, CG = Cockroft-Gault, GFR = glomerular filtration rate, MDRD = Modification of Diet in Renal Disease, MDRD1 = Modification of Diet in Renal Disease without race correction, CKD-EPI = Chronic Kidney Disease Epidemiology Collaboration, CKD-EPI1 = Chronic Kidney Disease Epidemiology Collaboration without race correction
The findings in Table 5 show the number of measurements within the 30% limits of the measured CrCl. MDRD1 exhibited the highest accuracy, followed by CKD-EPI1. CG and MDRD showed similar accuracy, while CKD-EPI demonstrated the lowest accuracy.
Relationship between urinary ACR and the various equations
Urinary ACR showed a negative correlation with all the eGFR equations. Specifically, the correlations were as follows: CG (r=-0.520, p=0.001), MDRD (r=-0.528, p=0.001), MDRD1 (r=-0.527, p=0.001), CKD-EPI (r=-0.527, p=0.001), and CKD-EPI1 (r=-0.525, p=0.001) (Table 6).
Relationship between the various equations (CG, MDRD, MDRD1, CKD-EPI, and CKD-EPI1) at different CKD stages
A positive correlation was observed between the measured 24-hour CrCl and CG-predicted CrCl at stage 1 of the GFR classification (Spearman's correlation, r=0.602, p=0.029) (Table 7). However, no statistically significant correlation was found between the measured 24-hour CrCl and the predicted GFR from the other equations at stages 1-3b. Additionally, CG did not correlate with the measured 24-hour CrCl estimate of GFR from stages 2-4.
All prediction equations demonstrated a significant correlation with the measured 24-hour CrCl estimate of GFR at stages 4 and 5. Among these, CKD-EPI showed the best correlation at stage 5 (r=0.828, p<0.001) (Table 7). Notably, no correlation was observed between the measured 24-hour CrCl and CG at the stage 4 GFR category.
The means±SD for the measured 24-hour CrCl, predicted CrCl by the CG equation, and estimated GFRs by MDRD, MDRD1, CKD-EPI, and CKD-EPI1 at stage 1 of the GFR classification were as follows: measured 24-hour CrCl: 117.4±25.5 mL/min, CG-predicted CrCl: 99.5±21.9 mL/min, MDRD: 100.1±24.7 mL/min, MDRD1: 82.8±20.4 mL/min, CKD-EPI: 105.7±25.6 mL/min, and CKD-EPI1: 91.2±22.3 mL/min. The analysis of variance (ANOVA) yielded a significant difference between the groups (F=3.339, p=0.009).
There was no significant difference between the mean GFR estimates from the measured 24-hour CrCl and the various equations (CG, MDRD, MDRD1, CKD-EPI, and CKD-EPI1) at stages 2, 3a, 3b, 4, and 5. The results of ANOVA for these stages were as follows: stage 2: F=0.955 (p=0.450), stage 3a: F=0.364 (p=0.869), stage 3b: F=1.063 (p=0.385), stage 4: F=0.939 (p=0.458), and stage 5: F=2.229 (p=0.053) (Table 8).
Correlation and agreement between the various equations
The relationship between the various equations, CG, MDRD, MDRD1, CKD-EPI, and CKD-EPI1, was assessed using Spearman's correlation, as detailed in Table 9. The results demonstrated generally strong positive correlations between the equations, indicating a high degree of agreement. This suggests that all the equations provide similar estimates of kidney function, with little variation in the results when comparing the different methods.
The regression analysis of demographic factors and selected cardiovascular risk factors associated with the various equations is presented in Table 10, including both unadjusted and multiple regression results. The study revealed that for the CG equation, age and albuminuria were the only significant factors associated with its predicted values. In contrast, the MDRD and MDRD1 equations were significantly associated solely with the presence of albuminuria. The CKD-EPI and CKD-EPI1 equations, however, were significantly associated with both age and albuminuria. These findings suggest that the factors influencing kidney function estimates differ between equations, with CG being affected by both age and albuminuria, while the MDRD equations are primarily associated with albuminuria, and the CKD-EPI equations are influenced by both demographic factors and albuminuria.
Discussion
The GFR is widely acknowledged as the best index for renal function [12]. GFR estimating equations are vital tools in evaluating renal function, but these equations must be validated across different populations for their clinical relevance. Accurate GFR estimation is crucial for diagnosing and staging CKD, facilitating appropriate management and providing prognostication. Literature on the performance of GFR estimating equations in CKD patients is scarce in Northern Nigeria, and most available studies from other regions in the country have focused on population screening rather than assessing the equations' performance in CKD patients.
This study demonstrates that GFR predictive equations can be used to assess renal function in CKD patients, particularly when GFR is low. Additionally, it reveals that the latest equations may not always be the best, as the CG equation outperforms the CKD-EPI equation. Overall, the findings contribute to the body of knowledge regarding the validity of predictive equations for CKD patients and compare the performance of different equations within the same cohort.
Demographics
The mean age of participants was 51.1±15.5 years, consistent with the observed national average for CKD incidence in Nigeria. This contrasts with developed countries, where CKD predominantly affects individuals over 65 years. Several factors explain this difference, such as the genetic makeup of people of Black ancestry, which is associated with a higher CKD prevalence and poorer prognosis. Notable genetic variations include the APOL-1 gene polymorphism, which is linked to focal segmental glomerulosclerosis, HIV nephropathy, and diabetic nephropathy [23,24]. The high prevalence of sickle cell trait is also a risk factor for CKD, as it is associated with hematuria and abnormal tubular function. Additionally, the poor socio-economic status in developing countries contributes to infections and infestations, which are risk factors for CKD. Chronic glomerulonephritis is particularly common in this environment [4]. These factors may explain the relatively higher prevalence of CKD in younger populations in developing countries like Nigeria compared to developed countries. [25].
There was a slight preponderance of male participants in the study, which contrasts with findings from the United States Department of Health and Human Services [25] and a systematic review of CKD prevalence in Nigeria by Chukwuonye et al. [26], both of which report a higher CKD prevalence in women. The male-dominant finding in this study could be attributed to economic empowerment, which influences healthcare access. Moreover, male patients are more likely to progress to end-stage kidney disease, which may explain the higher number of males, as they tend to present at later disease stages.
The majority of participants were urban dwellers, reflecting the higher CKD prevalence in urban areas compared to rural ones. The hospital's urban location offers better access for city dwellers, and the study design also favored urban patients who were more willing to participate in 24-hour urine collection, unlike rural patients who often declined due to the distance.
The most common co-morbidity observed was hypertension, which is both a cause and consequence of CKD [26]. Obstructive uropathy, found in approximately 10% of male participants, is another notable co-morbidity, highlighting the high prevalence of prostatic enlargement in middle-aged men. A significant observation was the co-existence of diabetes mellitus in patients with clinical and imaging features indicative of hypertensive nephrosclerosis.
Clinical features
The relatively short duration of CKD in this study is consistent with the general observation that most CKD patients seek care late [27]. Additionally, a significant portion of participants had stage 5 CKD. Diabetic kidney disease was the most common cause of CKD, in line with global trends [3,28,29]. However, this differs from many studies in Nigeria, where chronic glomerulonephritis and hypertension are typically the leading causes of CKD [4,29,30]. This suggests that the epidemiology of CKD in Nigeria is changing, similar to other developing countries like India, where Westernized lifestyles and diets have led to an increased incidence of diabetes mellitus and, consequently, diabetic kidney disease [31]. Alebiosu et al. [4] noted a similar trend in 2006, indicating that diabetic nephropathy is becoming a significant cause of ESRD in Nigeria.
Less than a fifth of participants had a positive family history of CKD. The overall mean BMI was in the overweight range, with females having a significantly higher BMI than males (p<0.001). However, there was no significant association between BMI and CKD according to any of the estimation equations in regression analysis. The mean SBP and DBP were higher than the benchmark for diagnosing hypertension (140/90 mmHg), indicating the high prevalence of hypertension among participants. Elevated blood pressure was found to be associated with all predictive equations in regression analysis.
Laboratory features
Over three-fourths of participants had positive dipstick proteinuria, with 52% showing an ACR >300 mg/g, and up to 82% having ACR >30 mg/g. This high incidence suggests that the dipstick test has a high positive predictive value for proteinuria detection, with a performance rate of 75.7%. Although dipstick testing is prone to observer error and has a high false discovery rate, it remains a valuable initial screening tool in CKD assessment [32-37]. This finding aligns with Ulasi et al. [27] community-based study, which reported a proteinuria prevalence of 16.2% in CKD patients, with values increasing in later stages.
The median serum creatinine was significantly elevated above the normal reference range, as expected in a group of CKD patients, with a substantial portion in stage 5 disease. The median CrCl, corrected to 1.73 m² BSA, was used to categorize participants into different CKD stages. Over a quarter were in stage 5, which is consistent with the late presentation observed in other studies in Nigeria [27,29,30].
Glomerular filtration rate equations
The median estimated GFR derived from the CG, MDRD, and CKD-EPI equations closely matched the measured 24-hour CrCl. In contrast, the values obtained from MDRD1 and CKD-EPI1 were significantly lower than the measured 24-hour CrCl (p≤0.001 and p=0.020, respectively). These findings suggest that CG, MDRD, and CKD-EPI can be used with a reasonable degree of confidence in estimating GFR within the studied population.
When the results from the predictive equations were plotted against the measured 24-hour CrCl using Bland-Altman analysis, CG demonstrated the least bias and the highest precision (0.12±14.40 mL/min). The number of measurements outside the 95% limits of agreement ranged between 8 and 11, with CG having the fewest outliers (n=8). Discordances with measured CrCl occurred at GFR values >48 mL/min for CG and CKD-EPI, and >45 mL/min for MDRD, MDRD1, and CKD-EPI1. Although CG and CKD-EPI performed slightly better at detecting reduced renal function at higher GFRs, the clinical significance of this finding is minimal, as these values fall within the same CKD staging category.
These results align with previous studies. Agaba et al. [36] reported that CG had the least bias and best precision when compared to MDRD, with discordance thresholds at 30 mL/min and 40 mL/min, respectively. Similarly, Dimandopoulos et al. [38] observed that predictive equations performed best at GFR stages 4 and 5, with correlations diminishing at higher GFR values. CrCl correlated strongly with eGFR derived from CG, CKD-EPI, CKD-EPI1, and MDRD, with correlation coefficients of r=0.949, 0.939, 0.938, and 0.936, respectively. Despite the lack of statistically significant differences, CG emerged as the least biased equation for estimating CrCl. Similar observations were made by Abefe et al. [37] in Southwestern Nigeria, where CG showed a good correlation with measured CrCl, and MDRD did not demonstrate superiority over CG.
Significant negative correlations were found between the mean values of the predictive equations and the urinary ACR. This inverse relationship is expected, as albuminuria is a marker of CKD progression, with higher albumin excretion rates observed in advanced CKD stages. Studies in Nigeria have consistently demonstrated an association between low eGFR and increasing albuminuria, reinforcing the interplay between declining renal function and proteinuria [27,39,40].
There was a significant correlation between CG, MDRD, and CKD-EPI across CKD stages, except for stage 1, where MDRD1 significantly underestimated GFR. CG was the only equation that correlated with measured CrCl at stage 1, while all equations showed stronger correlations at stages 4 and 5, with increasing coefficients as GFR declined. This finding aligns with previous reviews by Coresh et al. [41,42], who reported that predictive equations become less accurate at GFR values above 60 mL/min, with bias increasing at higher GFRs.
Interestingly, while CKD-EPI has been shown to outperform MDRD at higher GFRs in other populations, the present study suggests that CG and CKD-EPI may be more appropriate for estimating renal function in CKD patients with reduced GFR. The discrepancy between studies by Eastwood et al. [20] and Shittu et al. [43], where MDRD and CKD-EPI overestimated GFR when adjusted for race, may be attributable to differences in population characteristics, as their cohorts included more individuals with normal renal function.
This study demonstrates strong agreement among predictive equations, particularly at GFR values <45 mL/min, with CG showing the least bias and best precision. While MDRD1 overestimated GFR, it had the highest number of measurements within 30% of the measured CrCl, supporting its accuracy in lower GFR ranges. The CG and CKD-EPI equations may be better suited for clinical use in this population, especially in patients with advanced CKD. Age and hypertension were significant factors influencing eGFR values, with CG showing greater underestimation in elderly patients. Despite subtle differences, all tested equations exhibited good predictive performance, reinforcing their utility in routine clinical practice. However, given the variability in equation performance across populations, local validation remains essential to ensure accurate GFR estimation and optimal CKD management.
This study is limited by the use of CrCl to eGFR rather than inulin clearance or radioisotope methods, which are considered the gold standard for measuring GFR. Although CrCl remains a widely used and practical alternative, its accuracy may be influenced by factors such as muscle mass, tubular secretion, and incomplete urine collection. Future studies may benefit from employing gold-standard techniques for more precise GFR assessment.
Conclusions
This study confirms that GFR prediction equations, CG, MDRD, and CKD-EPI, provide reliable estimates of renal function in CKD patients, particularly at lower GFR stages. The CG equation showed the least bias and best precision among the equations analyzed. Albuminuria was significantly associated with CKD stage and GFR estimates. The findings suggest that these equations should be validated locally to ensure accurate CKD diagnosis and staging, which is crucial for optimal management. Further research is needed to validate these results in larger, population-based studies and explore the influence of genetic and socioeconomic factors on CKD progression and outcomes.
The reference list from the paper itself. Each links out to its DOI / PubMed record.
- 1Chronic kidney disease diagnosis and management: a review J Am Med Assoc Chen TK Knicely DH Grams ME 12941304322201910.1001/jama.2019.14745 PMC 701567031573641 · doi ↗ · pubmed ↗
- 2Kidney disease: improving global outcomes (KDIGO) CKD work group. KDIGO 2012 clinical practice guideline for the evaluation and management of chronic kidney disease Kidney Int Suppl Levin A Stevens PE Bilous RW 132011
- 3KDOQI US commentary on the 2012 KDIGO clinical practice guideline for the evaluation and management of CKD Am J Kidney Dis Inker LA Astor BC Fox CH 7137356320142464705010.1053/j.ajkd.2014.01.416 · doi ↗ · pubmed ↗
- 4The global burden of chronic kidney disease and the way forward Ethn Dis Alebiosu CO Ayodele OE 418423152005 http://pubmed.ncbi.nlm.nih.gov/16108301/16108301 · pubmed ↗
- 5The enormity of chronic kidney disease in Nigeria: the situation in a teaching hospital in South-East Nigeria J Trop Med Ulasi II Ijoma CK 501957201020102061394510.1155/2010/501957 PMC 2896838 · doi ↗ · pubmed ↗
- 6The global burden of kidney disease and the sustainable development goals Bull World Health Organ Luyckx VA Tonelli M Stanifer JW 4144229620182990422410.2471/BLT.17.206441 PMC 5996218 · doi ↗ · pubmed ↗
- 7Burden of chronic kidney disease on the African continent: a systematic review and meta-analysis BMC Nephrol Kaze AD Ilori T Jaar BG Echouffo-Tcheugui JB 1251920182985904610.1186/s 12882-018-0930-5PMC 5984759 · doi ↗ · pubmed ↗
- 8The prevalence of chronic kidney disease in apparently healthy retired subjects in Asaba, Nigeria Ann Med Health Sci Res Odenigbo C Oguejiofor O Onwubuya E Onwukwe Ch 0324201410.4103/2141-9248.138031 PMC 414550925184079 · doi ↗ · pubmed ↗