The impact of historical redlining policies on community composition and the COVID-19 pandemic in Boston
Nicole B. Alkhouri, Victoria Fisher, Isaacson Michel, Caitlin O’Connor, Nadia N. Abuelezam

TL;DR
This study examines how historical redlining policies in Boston relate to the impact of the COVID-19 pandemic on different communities.
Contribution
The study explores the downstream effects of redlining, such as gentrification, on public health outcomes during the pandemic.
Findings
No significant association was found between historical redlining and monthly COVID-19 incidence rates.
Gentrification and higher median home values were linked to increased monthly COVID-19 incidence rates.
The study emphasizes the importance of historical context in understanding public health disparities.
Abstract
The COVID-19 pandemic has accentuated racial and socioeconomic disparities that have existed in the U.S. because of structural racism. We aimed to understand how the legacy of historical redlining policies was associated with COVID-19 incidence in Boston ZIP code tabulation areas (ZCTAs) from March 2020 to December 2022. Data were extracted from the Institute for Social Research at the University of Michigan, the Boston Public Health Commission, the Boston Planning & Development Agency, and the American Community Survey. We ran a generalized linear model accounting for time to explore the association between historical redlining, characterized as Homeowners’ Loan Corporation (HOLC) grade, and monthly COVID-19 incidence rate. Models were adjusted for the proportion of the ZCTA population identified as non-White, were older than 75, homeowners, and foreign-born. We also accounted for the…
Genes, proteins, chemicals, diseases, species, mutations and cell lines named across the full text — each resolved to its canonical identifier and authoritative record.
Click any figure to enlarge with its caption.
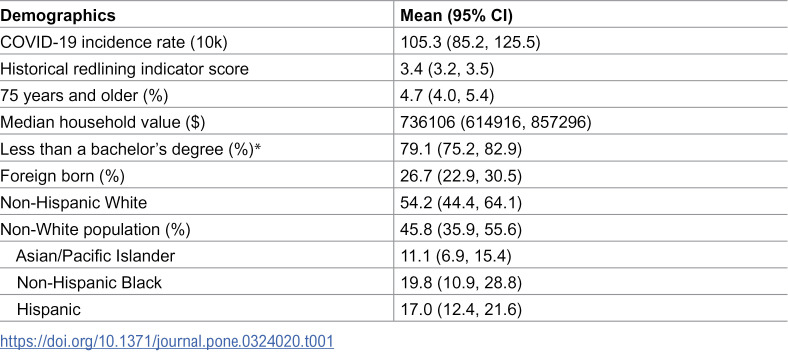 Figure 1
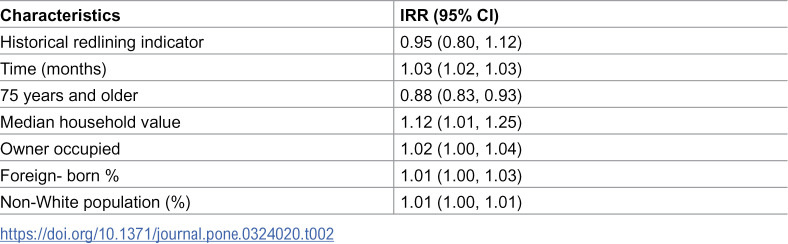 Figure 2
- —http://dx.doi.org/10.13039/100000057National Institute of General Medical Sciences
Peer Reviews
No public reviews on file for this paper yet. If you reviewed it on a platform where reviews are public (OpenReview, ICLR, NeurIPS, ICML), you can paste yours below so the community can read it here.
Videos
No videos yet. Explain this paper in a talk, walkthrough, or lecture? Add one.
Taxonomy
TopicsHealth disparities and outcomes · Urban, Neighborhood, and Segregation Studies · Homelessness and Social Issues
Introduction
COVID-19 has been ravaging communities across the United States (U.S.) since March of 2020. The COVID-19 pandemic has brought attention to racial and socioeconomic disparities that have existed in the U.S. that can largely be attributed to structural racism [1]. Structural racism has been linked to a number of health issues including preterm birth [2], mental health outcomes [3,4], and COVID-19 in communities of color [5]. Current disparities in health are a product of historical injustices and policies that impact both the living environment and health outcomes [1,6].
One historical policy with long term implications for health and wellness is redlining. Redlining policies segregated communities on racial and ethnic lines [1,7]. In the 1930s, cities across the U.S. were demarcated and distinguished based on potential investment value by the Homeowners’ Loan Corporation (HOLC) in collaboration with the Federal Housing Administration (FHA) [8,9]. The HOLC created maps that distinguished neighborhoods based on a predetermined rating system that influenced different groups’ ability to obtain home loans. Neighborhoods were given one of four letter grades: ‘A’ (Best), ‘B’ (Desirable), ‘C’ (Declining), and ‘D’ (Hazardous) [1,7]. Neighborhoods awarded the grades ‘A’ or ‘B’ were predominately White wealthy neighborhoods that easily received home loans, and those graded ‘C’ or ‘D’ were occupied by the working class, European immigrants, Mexican, and Black/African American communities [1,7]. Redlining had a negative impact on neighborhood development [8,10]. Reduction in credit access led to lower demands for housing, which directly led to a decrease in housing investment; homeowners were left owing more than the house’s market value [11,12]. This eventually led to poor upkeep for properties as their value diminished [8,13–15]. Active divestment in neighborhoods deemed “hazardous” or “declining” led to increased rates of home vacancies and their dilapidation [6]. A neighborhood’s rating impacted long-term investment into the community. The passing of the Fair Housing Act of 1968 called for the legal end of housing discrimination. While redlining policies have been outlawed, their consequences are still being seen decades later [10,16].
One significant implication of redlining was demographic change in neighborhood composition influenced by local and federal practices. The historical patterns in Boston, Massachusetts (MA) exemplify these changes. A small proportion of Black/African American residents in any Boston neighborhood brought the HOLC rating down, despite a quality environment [17]. Roxbury, a neighborhood in Boston, was given a “hazardous” rating due to an “infiltration of Negroes [17,18].” European immigrant groups, including Irish, Jewish, and Italian residents, were also among those affected by redlining practices in Boston [19]. After the Fair Housing Act of 1968 passed, the Boston Banks Urban Renewal Group (B-BURG) was formed to provide Black Bostonians loans for home ownership and to correct past injustices [17,20]. Black/African American residents were limited to purchasing homes exclusively in areas located in Roxbury, Dorchester, and Mattapan [20]. Purchases outside of these designated areas were denied [21]. The influx of Black/African American residents, into what formerly were predominantly Jewish communities, caused the Jewish residents to leave [17]. This process, called ‘blockbusting,’ involved real estate brokers scaring off residents to quickly sell their homes [21]. As decades passed, these neighborhoods became predominantly Black/African American communities [22,23]. This program ultimately failed to alleviate housing discrimination [20,21]. Homes purchased through B-BURG by Black/African Americans residents were poorly maintained and the residents lacked the resources to improve their housing conditions [21]. The inability to take care of their homes and to build equity led to foreclosures and abandonment [21].
Housing is a well-established social determinant of health. Poor living conditions translate to increased vulnerability to infectious diseases and poor health outcomes. A study from Louisiana linked neighborhoods most deprived of resources to increased risk of contracting COVID-19 [24,25]. Adverse housing factors, such as crowding, poor ventilation, and deprivation have been shown to have a negative impact on health [10,26]. Exposure to mold, dampness, pest, and toxic substances was associated with respiratory issues, lung cancer, and chronic illness [27–33]. Redlined communities were more susceptible to chronic illness due to a lack of investment in housing infrastructure and maintenance [10,33]. A nationwide study across U.S. counties observed an increase in COVID-19 incidence and mortality associated with the percentage of households with poor housing conditions [34]. Cumulatively, these studies suggest that housing influences infectious disease risk.
Prior studies have focused on the impact of redlining policies on chronic disease incidence in New York [2,35], while others have examined the association between redlining and COVID-19 outcomes in both New York City and California [6,36,37]. To our knowledge, little or no prior work has examined how the legacy of redlining has impacted infectious disease outcomes in Boston, MA [6,26]. We aim to understand how historical redlining policies were associated with COVID-19 incidence in Boston from March 2020 through December 2022.
Methods
Data
Redlining data were extracted at the census tract level from the Institute for Social Research at the University of Michigan [38]. COVID-19 incidence rates were extracted from the Boston Public Health Commission’s COVID-19 Dashboard [39]. Boston’s demographic data was obtained from the 2020 Decennial data and the 2016–2020 American Community Survey via the Boston Planning & Development Agency [22,40,41].
Outcome
The primary outcome for this study was the COVID-19 incidence rate, defined as the number of COVID-19 cases per 10,000 residents [39]. We calculated this by dividing the monthly COVID-19 cases per ZIP code tabulation area (ZCTA) by the annual population of ZCTA. This analysis examined monthly incidence rates from March 2020 through December 2022 [39].
Exposures
The primary exposure was the numerical indicator of the HOLC grade of a ZCTA [38]. Grades were converted to a continuous numerical range of 1–4, averaged based on the proportion of the ZCTA corresponding to each grade. A higher numerical score indicates greater overall redlining, such that A = 1, B = 2, C = 3, and D = 4, etc. The HOLC scores are given at the Census Tract level and were aggregated up to ZCTA using the Department of Housing and Urban Development (HUD) 2010–2020 census tract to ZCTA crosswalk files. Only ZCTAs with historical redlining and COVID-19 data were included in the analysis (N = 25). Two ZCTAs did not have COVID-19 cases and three had no historic redlining data (S1 Fig in S1 File).
Covariates
The final model was adjusted for a variety of covariates based on a priori knowledge, and data availability. We adjusted for time, the proportion of the ZCTA population older than 75, the proportion of the ZCTA population identifying as foreign-born, the proportion of the ZCTA population identifying as non-White, standardized median household values, and the proportion of the ZCTA population that owned their dwelling unit.
Statistical analysis
After excluding missing data in COVID-19 cases, HOLC grades, and covariates across the entire study period, 25 ZCTAs were included in the final analysis across 34 months, totaling 850 observations. The incidence rate was log-transformed to obtain a normal distribution. Generalized linear models (glm) with gaussian family were conducted to account for ZCTA repeated measures.
The statistical analysis was performed in R 4.2.1. The code used for this research is available on GitHub {https://github.com/victoriapfisher/Redlining_PLOSOne.git}.
Results
Descriptive statistics
On average, 54% of all ZCTA residents identified as White (95% CI: 44%, 64%), and 46% identified as non-White (95% CI: 36%, 56%) (Table 1). Of those who identified as non-White, 17% identified as Hispanic (95% CI: 12%, 22%), 20% identified as non-Hispanic Black (95% CI: 11%, 29%), and 11% identified as Asian/Pacific Islander (95% CI: 7%, 15%). For ZCTAs included in this analysis, mean historical redlining score was 3.4 (95% CI: 3.2, 3.5) and mean COVID-19 incidence rate per 10,000 people was 105.3 (95% CI: 85.2, 125.5).
Table 1: Average demographics across Boston ZIP code tabulation areas (ZCTAs) (N = 25), 2020–2022.
Regression results
There was no significant association between historical redlining of Boston ZCTAs and COVID-19 incidence rate after adjusting for all covariates (IRR: 0.95; 95% CI: 0.80, 1.12) (Table 2). Advanced age (75 years and older) was significantly associated with a lower COVID-19 incidence rate (IRR: 0.88; 95% CI: 0.83, 0.93). Additionally, an increase of one standard deviation in ZCTA median household value corresponded to a 1.12 times higher COVID-19 incidence rate (95% CI: 1.01, 1.25). Similarly, ZCTAs with a higher proportion of homeowners, foreign-born residents, and non-White populations experienced 1.02 (95% CI: 1.00, 1.04), 1.01 (95% CI: 1.00, 1.03), and 1.01 (95% CI: 1.00, 1.01) times the COVID-19 incidence rates, respectively, compared to the mean.
Table 2: Generalized Linear Model (GLM) regression results.
This table shows the association between historical redlining (a continuous indicator that ranges from 1 to 4) and COVID-19 incidence rate per 10,000 residents adjusting for the proportion of the ZCTA population that is 75 years and older, foreign-born, dwelling owners, and non-White. Models were additionally adjusted for median household value and time.
Discussion
We aimed to examine how historical redlining in Boston was associated with COVID-19 incidence from 2020 to 2022. We found no significant association between redlining and COVID-19 incidence in Boston. However, our results indicated that ZCTAs with higher median household income and a higher proportion of dwelling owners, foreign-born individuals, and non-White individuals had higher COVID-19 incidence.
One facet of the legacy of historical redlining policies manifested as poor housing and worse living conditions, which previous studies reported were associated with infectious disease outcomes [34,42–44]. As such, we used median household value as a proxy for housing conditions as higher median values often indicate neighborhood living conditions [45]. However, for the data included in this analysis, median household value in 2020 and 2021 was significantly associated with higher redlining scores, or worse original grades [S1 Table in S1 File]. In Boston, disinvestment allowed for developers and opportunists looking to purchase units at low cost in Boston’s historic neighborhoods and redevelop, or gentrify, into higher value properties [46]. That our study detected no significant association between historical redlining and COVID-19 outcomes is on par with Boston’s development history in the years since redlining was outlawed. Studies in Massachusetts have hypothesized that rising house prices might be associated with displacement pressure for low-income families, resulting in higher COVID-19 transmission in higher median home value areas as low-income residents took up more jobs that required them to work outside the home [46–48].
From a historical perspective, the redlined neighborhoods of Boston were primarily home to European immigrants in the early 20th century—these include South Boston, the North End, and the South End, all areas with high home value today. Introduced in the 1930s, redlining and other racist urban development practices primarily (often explicitly) targeted Black and Brown populations, which comprised less than 2% of Boston’s population at the time [49]. Although White European immigrants were not immune to violence and racism, including redlining, historical records suggest they were targeted by acts of violence at the same rate as White Americans [50]. Today, the historically redlined neighborhoods of Boston continue to be home predominantly to descendants of those White and White-passing immigrant groups–Italian, Irish, and Central European. A consistent increase in Black and Brown residents in Boston did not start until the 1980s and 90s [51,52], by which time redlining was outlawed. As a result, Black and Brown Bostonians experienced different residential contexts than those who may have moved to places such as Detroit, Chicago, and other industrial northern cities during the Great Migration. For example, Mehdipanah et al. found that historically redlined neighborhoods in Detroit, which were and continue to be home to predominantly Black residents, were associated with worse access to critical determinants of health today [53]. This is not to say that non-White Bostonians have greater access to health resources than Black and Brown residents living in multigenerational redlined areas; rather, non-White Bostonians are less likely to live in formerly redlined parts of the city compared to other redlined cities. Indeed, our results suggest that non-White residents were at greater risk for COVID-19 infection, though redlining is unlikely the defining mechanism for this result. Our work adds nuance to the ways in which redlining should be used as an exposure in public health research [54], acknowledging the importance of history and place-based context in infectious disease epidemiology [55].
Through rapid gentrification, historical redlining has impacted the racial composition of neighborhoods in Boston [56]. Our findings were consistent with prior literature linking high non-White community composition with increased COVID-19 risk and incidence [25,53]. A New York City study found that predominantly Black/African American and Hispanic areas had higher COVID-19 infection rates [6]. In Boston, neighborhoods with higher Hispanic populations had 25% higher COVID-19 incidence [57]. At the beginning of the pandemic, infections among Black Bostonians accounted for 40% of the COVID-19 cases [58]. This disproportionate impact can be attributed to factors such as limited access to healthcare, food insecurity, lack of clean water, overcrowded living conditions, and the types of jobs these communities are more likely to hold [59].
Our study had several limitations. Boston is home to a large population of college students. We hypothesize that Boston’s dynamic, transient population may have influenced the concentration of COVID-19 cases, particularly around campuses. Many of the campuses and student housing are located in Boston’s historically redlined communities [60]. Consequently, this could have obscured patterns of health disparities for long-term Boston residents. Additionally, the demographic data we obtained from ACS was annual compared to our outcome data which was monthly. This temporal mismatch could have introduced discrepancies in our analysis. Lastly, the redlining data we utilized was available on the census tract level, which required us to crosswalk the data to ZCTAs. Both ZCTAs and tracts may have undergone significant changes since HOLC grading was implemented, potentially leading to inaccurate description of geographic areas impacted by redlining [7].
Our study adds to a growing body of literature that explores the link between historical redlining and contemporary health disparities. Our findings indicated that downstream effects of redlining, such as gentrification and higher median household value, were associated with higher COVID-19 incidence rates, illustrating the variety of consequences racist historical policies can have on infectious diseases. Future work in other urban contexts is necessary to expand our understanding of how structural factors impact health outcomes beyond COVID-19.
Supporting information
S1 FileSupplementary materials for “The impact of historical redlining policies on community composition and the COVID-19 pandemic in Boston.”This supplement contains an additional table with linear regression results and a redlining map of Historical Redlining Grades.(DOCX)
The reference list from the paper itself. Each links out to its DOI / PubMed record.
- 1Richardson J, Mitchell BC, Meier HCS, Lynch E. The lasting impact of historic “Redlining” on neighborhood health: Higher prevalence of COVID-19 risk factors. National Community Reinvestment Coalition [Internet]; 10 Sep 2020 [cited 16 Sep 2024]. Available from: https://ncrc.org/holc-health/
- 2Krieger N, Van Wye G, Huynh M, Waterman PD, Maduro G, Li W, et al. Structural racism, historical redlining, and risk of preterm birth in New York City, 2013-2017. Am J Public Health. 2020;110(7):1046–53. doi: 10.2105/AJPH.2020.305656 32437270 PMC 7287548 · doi ↗ · pubmed ↗
- 3Bailey ZD, Feldman JM, Bassett MT. How structural racism works - racist policies as a root cause of U.S. racial health inequities. N Engl J Med. 2021;384(8):768–73. doi: 10.1056/NEJ Mms 2025396 33326717 PMC 11393777 · doi ↗ · pubmed ↗
- 4Williams DR, Lawrence JA, Davis BA. Racism and Health: Evidence and Needed Research. Annu Rev Public Health. 2019;40:105–25. doi: 10.1146/annurev-publhealth-040218-043750 30601726 PMC 6532402 · doi ↗ · pubmed ↗
- 5Zalla LC, Martin CL, Edwards JK, Gartner DR, Noppert GA. A geography of risk: structural racism and coronavirus disease 2019 mortality in the United States. Am J Epidemiol. 2021;190(8):1439–46. doi: 10.1093/aje/kwab 059 33710272 PMC 7989642 · doi ↗ · pubmed ↗
- 6Li M, Yuan F. Historical redlining and resident exposure to COVID-19: a study of New York City. Race Soc Probl. 2022;14(2):85–100. doi: 10.1007/s 12552-021-09338-z 34178163 PMC 8212581 · doi ↗ · pubmed ↗
- 7Meier HCS, Mitchell BC. Tracing the Legacy of Redlining: A New Method for Tracking the Origins of Housing Segregation NCRC. National Community Reinvestment Coalition [Internet]; 24 Feb 2022 [cited 16 Sep 2024]. Available from: https://ncrc.org/redlining-score/
- 8Aaronson D, Hartley D, Mazumder B. The effects of the 1930 s HOLC “Redlining” Maps. Am Econ J. 2021;13(4):355–92. doi: 10.1257/pol.20190414 · doi ↗