A genome-wide SNP-SNP interaction analysis exploring novel interacting loci associated with the risk of recurrence in colorectal cancer
Aaron A. Curtis, Yajun Yu, Megan Carey, Yildiz E. Yilmaz, Sevtap Savas

TL;DR
This study explores how pairs of genetic variants may influence the risk of colorectal cancer recurrence, using genome-wide interaction analysis.
Contribution
This is the first genome-wide SNP-SNP interaction analysis in colorectal cancer outcomes.
Findings
No SNP-SNP interaction remained significant after Bonferroni correction for multiple testing.
The top 20 interactions had p-values ranging from 1.37E-8 to 2.14E-9.
Three additional interaction models were identified by analyzing SNPs in the same genomic regions.
Abstract
Genetic factors can influence and predict patient outcomes. The association of interactions of germline SNPs with patient outcomes is an understudied area of prognostic research. In this study, we applied the first genome-wide SNP-SNP interaction analysis in relation to colorectal cancer outcomes. Our objective was to explore interacting SNP loci at the genome-wide level that predict the risk of local or distant recurrence (RMFS) in a cohort of stage I-III colorectal cancer patients from the Canadian province of Newfoundland and Labrador. The patient cohort consisted of 430 unrelated Caucasian patients. Genetic and medical data was collected previously and the genetic data consisted of a total of 384,415 genotyped SNPs. The PLINK epistasis function was utilized to examine pairwise SNP interactions. Select interactions were assessed by multivariable Cox-regression models, adjusting for…
Genes, proteins, chemicals, diseases, species, mutations and cell lines named across the full text — each resolved to its canonical identifier and authoritative record.
Click any figure to enlarge with its caption.
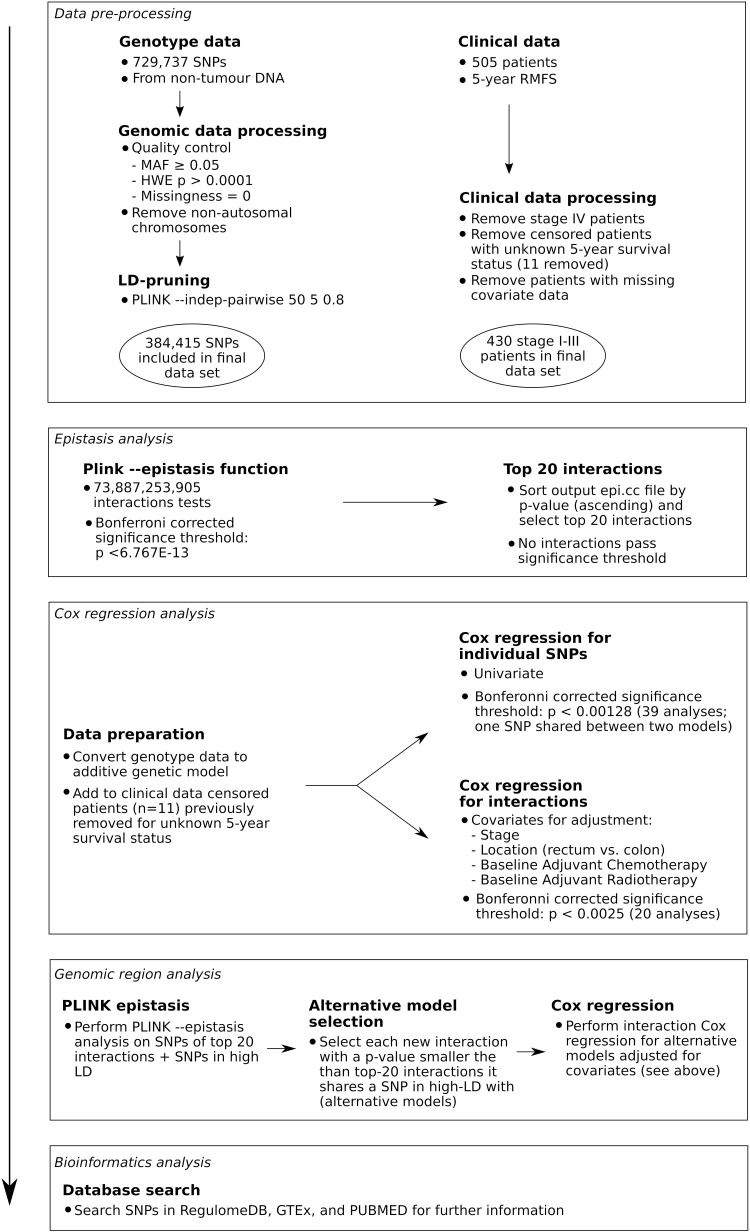 Fig 1
Fig 1- —http://dx.doi.org/10.13039/501100010630Faculty of Medicine, Memorial University of Newfoundland
Peer Reviews
No public reviews on file for this paper yet. If you reviewed it on a platform where reviews are public (OpenReview, ICLR, NeurIPS, ICML), you can paste yours below so the community can read it here.
Videos
No videos yet. Explain this paper in a talk, walkthrough, or lecture? Add one.
Taxonomy
TopicsGenetic factors in colorectal cancer · Genetic Associations and Epidemiology · Helicobacter pylori-related gastroenterology studies
Introduction
Colorectal cancer is one the most common cancers globally [1–3]. As in the case of many complex diseases, in colorectal cancer there has been a great interest in identifying prognostic biomarkers (including genetic variants such as Single Nucleotide Polymorphisms [SNPs]) [4]. The past decade has witnessed tremendous progress in our fundamental understanding of biology, health, and disease, as well as in technology, which has allowed researchers to conduct larger and more challenging studies, such as genome-wide association studies (GWASs).
While the GWAS–which often examines individual associations of SNPs with an outcome–is a widely applied method [5–10], it is important to move beyond it. This is because GWAS identified variants usually explain only a small fraction of the phenotypic variation among patients, suggesting that there are genetic mechanisms or variations still waiting to be discovered (i.e., “missing heritability” [11–14]). Genetic interactions are one of the possible mechanisms that can help elucidate the missing heritability. In simple terms, interactions (sometimes also referred to as epistasis) are when the effect of a variant on a phenotype is dependent on another variant, where its effect may increase (synergistic interaction) or decrease (antagonistic interaction) in the presence of the other locus [11–17]. As GWASs only examine the effect of one SNP at a time, they cannot identify these interactive effects.
A number of methods have been developed to examine interactions [14,18–29] and further development in this area is expected, including further artificial intelligence-based methods [29]. Since interaction analyses are advanced when compared to one-SNP-at-a-time type analyses, examining interactions can provide unique, novel, and exciting information that can support current studies and further progress prognostic research. Interactions, however, are not well studied in colorectal cancer prognosis. One of the reasons for this is the computational load required to examine interactions and a lack of availability of tools that can handle the large-scale data that is common in genome-wide settings. A few interaction studies in colorectal cancer outcomes, some led by our lab, have been published [30–35]; while these studies opened new ways to examine prognostic biomarkers, they were restricted to candidate genes and/or pathways, missing the opportunity to provide a more comprehensive landscape of the interactions at the genome-wide level.
In the presented study, our aim was to explore genome-wide SNP-SNP interactions that may be associated with the 5-year (local or distant) recurrence risk in colorectal cancer. Our findings underline the potential utility of examining SNP-SNP interactions in biomarker research, can inform future studies, and can inspire other groups to integrate interaction analyses into their studies.
Methods
Ethics statement
This study has been approved by the provincial Health Ethics Research Board (HREB #2018.051; #2009.106). As this study was a secondary use of data study, HREB waived the requirement for patient consent. For this study, authors did not require access to information that could identify individual participants during or after data collection. However, previously Megan Carey had access to patient identifiers while updating the outcome data (HREB # 15.006).
Patient cohort, SNP genotyping and clinical data
The patient clinical and genetic data used in this study were collected by the Newfoundland Familial Colorectal Cancer Registry (NFCCR) investigators between January 1, 1999 and January 24, 2018. The data used in this study was accessed between October 22, 2022 and July 9, 2024. In brief, the NFCCR recruited around 750 patients diagnosed with colorectal cancer between January 1999–December 2003 [36]. Genome-wide SNP genotype data was previously obtained using the Illumina® Omni1-Quad human SNP genotyping platform at a genotyping facility (Centrillion Biosciences, USA) [7]. DNA extracted from non-tumor (e.g., blood) samples was used in genotyping reactions. Patients whose genotype data failed the standard quality control (QC) measures as well as those patients who were non-Caucasian and 1^st^-, 2^nd^-, or 3^rd^-degree relatives were removed from the patient cohort, leaving 505 patients with genome-wide SNP genotype data (consisting of 729,737 SNPs) [7]. Clinical and demographic data was collected using a variety of resources over time, including medical charts, patient questionnaires, and data from local tumor registries [36–38]. The last follow up date was January 24, 2018 [38].
PLINK uses logistic regression in its epistasis analysis. Therefore, we processed the outcome data to fit this method. The clinical endpoint used for this study was 5-year recurrence or metastasis free survival (RMFS) status, where events were defined as recurrence or metastasis at or before 5 years after diagnosis of colorectal cancer. Initially, patients who did not experience recurrence or metastasis and whose last follow-up time was before 5 years were removed from the dataset, as their survival at 5 years was unknown (censored patients; n = 11). Stage IV patients were also removed from the data as our study focuses on the risk of recurrence or metastasis and stage I, II, and III patients are susceptible to these outcomes (i.e., stage IV patients would already have metastases at the time of diagnosis). Patients with missing covariate data were also excluded. After these data processing steps, there remained 430 stage I-III patients in the cohort for the PLINK interaction analysis. Baseline features for this patient cohort are shown in Table 1.
Table 1: Baseline characteristics of the patient cohort included to the PLINK epistasis analysis.
SNP genotype data extraction and quality control measures
All genotype data processing prior to analysis was performed using PLINK 1.9 [39]. Genotypes of SNPs were extracted for the patient cohort using PLINK with the following standard parameters: Missing genotypes = 0, Minor Allele Frequency (MAF) ≥ 0.05, Hardy-Weinberg Equilibrium (HWE) p-value > 0.0001. Genotype data was restricted to autosomal chromosomes, as association analysis of genotypes of the variants on sex chromosomes requires special approaches in cohorts including both men and women, such as ours [41].
The SNP dataset, once extracted, was then subject to pruning. Linkage Disequilibrium (LD)-based pruning was performed using the PLINK commands --indep-pairwise 50 5 0.8 and --extract [42]. This removed one SNP of each pair of SNPs with an r^2^ greater than 0.8, within a window of 50 SNPs, moving the window by 5 SNPs each step. As a result, 384,415 SNPs were included in the final data set.
PLINK epistasis function
Epistasis analysis was performed using PLINK 1.9. [39] and the --epistasis command. With this command, PLINK performs logistic regression analysis for every pair of SNPs in the dataset. PLINK was chosen for this analysis due to its speed, robustness, memory efficiency, and simplicity. The output of the --epistasis command was retrieved and stored in two files (an epi.cc and an epi.cc.summary file). As a result of this epistasis analysis, 73,887,253,905 interactions were tested.
Statistical analyses
After Bonferroni correction for multiple testing, none of the interaction p-values remained significant. We report the 20 SNP pairs identified in the epi.cc output file with the lowest interaction p-values (“top 20 SNP pairs”). Genotype data was extracted for these pairs using an additive genetic model with the PLINK command --recodeA.
We constructed univariable Cox regression models for the top SNPs as well as two-SNP Cox regression models (with interaction term) adjusting for clinical covariates of location (rectum vs. colon), stage (II vs I and III vs I), adjuvant chemotherapy (yes vs no), and baseline radiotherapy (yes vs no) [38]. Time to recurrence data was utilized in Cox regression analyses. During these latter analyses, 11 patients who were censored, and hence removed from the PLINK analysis, were added back to the dataset in order to limit bias. Statistical analyses were done using SPSS (IBM; version 29.0.0.0 (241) for Windows). Bonferroni-adjusted significance thresholds are p < 0.00128 and p < 0.0025 for univariable and multivariable Cox regression analyses, respectively.
Analysis of the interactions in identified genomic regions
As LD-pruning was performed, which removes one SNP of each high-LD pair from the dataset, only a subset of SNPs in our dataset were directly included in our initial PLINK epistasis analysis. In order to address the possibility that interactions involving the pruned SNPs may have stronger associations with RMFS than the interactions identified in our initial analysis, a subsequent analysis was performed. SNPs which were in LD with those identified in the top 20 interactions of our initial epistasis analysis (PLINK r2 inter-chr function) were used to form a new dataset, along with the 39 unique SNPs from the top 20 interactions (one SNP appeared in two interactions). The PLINK epistasis function was again run using this new dataset. There were 30 models found with a p-value ≤ 1.37E-8 (the lowest p-value identified in the initial PLINK interaction analysis). These models included the original 20 interactions, leaving 10 new models for us to consider. In the latter models, each model included one SNP in common with an original interaction set and a new SNP (that is in high-LD with the second SNP from the original interaction). Among those, only three new alternative interactions had a PLINK interaction p-value lower than the original interaction which it corresponded to – these are noted in this manuscript. For each of these alternative interactions, 2-SNP (with interaction term) Cox regression analyses adjusting for covariates were performed as described above.
Bioinformatics tools and databases
In order to explore the biological knowledge available about the identified loci, we utilized published resources including RegulomeDB [43], GTEx [44], and PUBMED. RegulomeDB ranks variants based on functionality using a scoring system (rank scores vary between 1–7), where with decreasing rank score, the evidence for functionality increases. For example, a ranking score of 1 means the variant is at least an expression quantitative trait/chromatin accessibility quantitative trait locus (eQTL/caQTL) and a transcription factor binding site (https://regulomedb.org/regulome-help/), and hence, is more likely to have functional consequences compared to a variant with a higher ranking score. GTEx, on the other hand, includes expression and eQTL data for normal tissues. Since GTEx does not include data from rectum, here we present the GTEx data extracted for sigmoid and transverse colon only. We note that since none of the interactions remained significant after correction for multiple testing (see Results), the results of these analyses should rather be taken as explorative in terms of how they relate to colorectal cancer outcomes, but not definitive.
Results
The flow-chart of the study workflow is shown in Fig 1. After applying the Bonferroni correction, none of the interactions identified by PLINK remained significant. The top 20 pairs of SNPs with the lowest interaction p-values identified by PLINK are shown in Table 2. Except for two cases, interacting SNPs were located in different chromosomes. One SNP (rs742257 on chromosome 1) was identified in two interacting SNP sets.
Table 2: PLINK epistasis analysis results for the top 20 interactions (sorted by p-value).
The study workflow.LD: Linkage Disequilibrium; RMFS: Recurrence-Metastasis Free Survival; SNP: Single Nucleotide Polymorphism.
We performed univariable Cox regression (for each SNP; Table 3) and multivariable Cox regression analyses (for each SNP pair: Table 4) to examine the SNPs’ relationships with the outcome. No SNP was individually associated with RMFS in the univariable Cox regression analysis (Bonferroni adjusted significance threshold < 0.00128). This is expected, as interacting SNPs are not expected to be associated with the outcome individually. In the multivariable models, all interactions had p-values varying between 1.04E-5 and 3.48E-10 (Bonferroni corrected significance threshold is p < 0.0025).
Table 3: Univariable Cox regression analysis results for the SNPs in the top 20 list.
Table 4: Multivariable Cox regression analysis results for the SNPs and interactions identified in this study.
We next examined whether there were interactions with smaller p-values that may have been missed because of SNP pruning, within the genomic regions captured by the identified SNPs. As a result, three new interacting SNP pairs were found (also called “alternative” sets or models in this manuscript). In these new models, one of the SNPs was the same variant between the original and the alternative models): rs4678497 and rs7212295, as an alternative to rs4678497-rs12601535; rs6757680-kgp11888590 as an alternative to rs6757680-rs9305669; and rs4485715 and rs914491 as an alternative to rs9855001-rs914491. In multivariable Cox regression analyses, two of these interactions had a p-value lower than the original interaction (Table 4).
S1 Table summarizes the MAFs, genetic locations, associated genes, RegulomeDB rankings, and eQTL information for the SNPs. Many of the SNPs were intronic SNPs and two SNPs were located in coding regions (rs12601535, a synonymous substitution located in MYO18A, and rs9671369, a missense variant in the SYNE3 gene). Twenty SNPs identified in this study were highly likely to be functional (based on RegulomeDB [43] rank of 1a-1f; S1 Table). Interestingly, in some cases both of the interacting SNPs were likely functional (Table 2).
Based on the GTEx [44] data, four of the SNPs in the list were eQTLs in sigmoid and/or transverse colon tissues (eQTLs are variants that are associated with the expression levels of certain genes [43]) (rs2247213; rs6056615; rs12436380; and rs35579818 being eQTLs for LINC01352, HLX-AS1, and RP11-295M18.6; RSPO4; TRIM9; and TMEM80, HRAS, and RNH1 genes, respectively). Additionally, rs9984518 identified in one of the alternative SNP sets was found to be an eQTL for WRB in transverse colon. No entry was returned when PUBMED and dbCPCO [45] databases were searched with the IDs of the SNPs identified in this study. Lastly, a literature search showed that many of the genes identified in this study were linked to colorectal cancer development, progression, or outcomes previously (see Discussion).
Discussion
Colorectal cancer is a common disease worldwide [1–3] and in Canada [46]. New prognostic markers can help prognosis, improve understanding of the biological reasons for variable prognosis among patients, and aid in the development of better therapeutic agents and prognostic tools. In this study, by following a robust and easy-to-apply approach, we aimed to explore the SNP-SNP interactions that are associated with the local or distant recurrence-free survival times in a cohort of colorectal cancer patients from Canada.
Prognostic GWASs are widely performed studies. While they are quite popular, their analytical abilities are restricted to analysis of the relationship of individual variants to an outcome measure. This may potentially lead to missing at least a part of the “heritability” component of prognostic variability, which can be explained by interacting loci [11–14]. Previously, our group [30,31] and others [33–35] have seen this possibility and applied interaction analyses at candidate gene or pathway settings in colorectal cancer. A genome-wide interaction analysis, as we have done here, however, has not been done in colorectal cancer before. Our analysis explored candidate SNP-SNP interactions in relation to recurrence in colorectal cancer. While further studies are needed to validate these findings and the accuracy of the models, and assess the potential short-term and long-term effects of the SNP interactions, we invite all researchers with genetic and RMFS data to test our findings in their datasets.
There may be also a timely opportunity to investigate or confirm the biological features of the SNPs reported in this manuscript, and their relation to disease recurrence in colorectal cancer using experimental approaches. Note that many of the SNPs highlighted in our study were estimated to affect biological functions/gene regulation. In some cases, both SNPs in the interaction set were predicted to be functional (e.g., based on the RegulomeDB scores or GTEx eQTL information). These SNPs are likely “lead SNPs” [47] that can be prioritized for further studies. In addition, literature search showed that some of the genes that SNPs identified here-in were located in (e.g., LAMB3 [48,49]; SYNE3 [50]; HRAS [51,52]; DIAPH3 [53]; NLRP3 [54,55]); PEBP4 [56]; GABRG3 [57]; LGALS8 [58]; OPCML [59]; MYO18A [60]; HAUS6 [61,62]; HLX [63,64] and some of the genes that were linked to eQTLs identified here-in (e.g., HRAS [51,52]) were previously linked to colorectal cancer. Altogether, this information strengthens the potential biological connections of some of the SNPs identified in this study with colorectal cancer.
The key strengths and limitations of this study can be summarized as follows: PLINK [39] is a fast and robust tool and it handled our large dataset reasonably quickly (less than a day), however, the PLINK epistasis function currently cannot adjust for covariates and can examine two SNP interactions only. Therefore, PLINK misses higher-order interactions (3-SNP and higher) and requires follow-up analyses with multivariable modeling to examine whether interactions are independent of established clinical covariates. There is also a need for robust tools that can handle time-to-event analyses while examining large number of interactions. The cohort for this study has a long follow-up time, but it included only Caucasian patients, and as such, results may not be applicable to other ethnicities. X-linked and Y-linked SNPs were excluded from the analysis, therefore additional information can be gained by examining the variants on these chromosomes in future studies. The SNP dataset included common SNPs with a MAF of at least 5%, hence, interactions involving rare variants also remain to be examined. Our cohort size was small and none of the p-values provided by PLINK remained significant after the Bonferroni correction. Therefore, further research in bigger cohorts with comparable characteristics (e.g., ancestry, treatment features) is required to test the results of this hypothesis generating study and before any of these interactions can be included in a prognostic model in the clinic. Lastly, this is the first time such an extensive interaction analysis has been performed in colorectal cancer, and as such, our results encourage new ways to examine prognostic biomarkers beyond the traditional GWAS approach.
Conclusions
Interaction analyses can identify collective relations of multi-variables in relation to a phenotype. While conducting genome-wide interaction studies is challenging, a few computational methods have been developed that can be utilized for such purposes. Here we present such a study performed using PLINK, the first genome-wide SNP-SNP interaction analysis in colorectal cancer outcomes. Our study brings new depth to the prognostic research, can inform future studies, and is expected to inspire other groups to integrate interaction analyses in their prognostic studies. Further studies building on our findings can also advance prognostic research, identify new interactions, and help address the missing heritability in colorectal cancer prognosis.
Supporting information
S1 TableInformation about the SNPs identified in this study.Chr: Chromosome; eQTL: expression Quantitative Trait Locus; MAF: Minor Allele Frequency; SNP: Single Nucleotide Polymorphism. * This SNP shares the same location as kgp5016729. ** This SNP shares the same location as kgp11888590. ^μ^Alternative interacting SNP identified through analysis of the genomic regions where the original top 20 interacting SNPs were located. ^£^Reference genome: hg19.(PDF)
The reference list from the paper itself. Each links out to its DOI / PubMed record.
- 1Bray F, Ferlay J, Soerjomataram I, Siegel RL, Torre LA, Jemal A. Global cancer statistics 2018: GLOBOCAN estimates of incidence and mortality worldwide for 36 cancers in 185 countries. CA Cancer J Clin. 2018;68(6):394–424. doi: 10.3322/caac.21492 30207593 · doi ↗ · pubmed ↗
- 2Arnold M, Rutherford MJ, Bardot A, Ferlay J, Andersson TML, Myklebust TÅ. Progress in cancer survival, mortality, and incidence in seven high-income countries 1995–2014 (ICBP SURVMARK-2): a population-based study. Lancet Onc. 2019;20(11):1493–505.10.1016/S 1470-2045(19)30456-5PMC 683867131521509 · doi ↗ · pubmed ↗
- 3Ferlay J, Soerjomataram I, Dikshit R, Eser S, Mathers C, Rebelo M, et al. Cancer incidence and mortality worldwide: sources, methods and major patterns in GLOBOCAN 2012. Int J Cancer. 2015;136(5):E 359-86. doi: 10.1002/ijc.29210 25220842 · doi ↗ · pubmed ↗
- 4Savas S, Liu G. Genetic variations as cancer prognostic markers: review and update. Hum Mutat. 2009;30(10):1369–77.19639655 10.1002/humu.21078 · doi ↗ · pubmed ↗
- 5Labadie JD, Savas S, Harrison TA, Banbury B, Huang Y, Buchanan DD, et al. Genome-wide association study identifies tumor anatomical site-specific risk variants for colorectal cancer survival. Sci Rep. 2022;12(1):127. doi: 10.1038/s 41598-021-03945-x 34996992 PMC 8741984 · doi ↗ · pubmed ↗
- 6Yu Y, Werdyani S, Carey M, Parfrey P, Yilmaz YE, Savas S. A comprehensive analysis of SN Ps and CN Vs identifies novel markers associated with disease outcomes in colorectal cancer. Mol Oncol. 2021;15(12):3329–47. doi: 10.1002/1878-0261.13067 34309201 PMC 8637572 · doi ↗ · pubmed ↗
- 7Xu W, Xu J, Shestopaloff K, Dicks E, Green J, Parfrey P, et al. A genome wide association study on Newfoundland colorectal cancer patients’ survival outcomes. Biomark Res. 2015;3:6. doi: 10.1186/s 40364-015-0031-6 25866641 PMC 4393623 · doi ↗ · pubmed ↗
- 8Pander J, van Huis-Tanja L, Böhringer S, van der Straaten T, Gelderblom H, Punt C, et al. Genome Wide Association Study for Predictors of Progression Free Survival in Patients on Capecitabine, Oxaliplatin, Bevacizumab and Cetuximab in First-Line Therapy of Metastatic Colorectal Cancer. P Lo S One. 2015;10(7):e 0131091. doi: 10.1371/journal.pone.0131091 26222057 PMC 4519298 · doi ↗ · pubmed ↗