Trends and burden of gout among adolescents aged 10–24 years: insights from the global burden of disease study 2021
Yueshan Pang, Yiran Yuan, Wei Zhou, Shan Liu, Yanbin Du

TL;DR
Gout is becoming more common in adolescents worldwide, with high BMI being a major risk factor, and urgent interventions are needed to address this growing health issue.
Contribution
This study provides the first comprehensive global analysis of gout trends and risk factors in adolescents using the GBD 2021 database.
Findings
The global incidence of gout in adolescents increased by 23.47% from 1990 to 2021.
High BMI was identified as the leading risk factor for years lived with disability due to gout.
Higher sociodemographic index levels correlated with greater gout incidence and disease burden in adolescents.
Abstract
Gout increasingly affects adolescents. However, comprehensive data on adolescent gout are scarce. This study aimed to analyse the incidence, prevalence, years lived with disability (YLDs), and risk factors for gout in adolescents aged 10–24 years via the Global Burden of Disease (GBD) database from 1990 to 2021. This study employed cross-sectional data from the GBD 2021 study in adolescents aged 10–24 years. The incidence, prevalence, YLD, and risk factor rates or numbers for gout were extracted, and trends across different sociodemographic index (SDI) levels and exponential annualized percentage change (EAPC) rates were analysed via linear regression analysis. Bayesian age-period-cohot (BAPC) model with an integrated nested Laplace approximation to predict the age-standardized incidence rate of gout among adolescents over the next 15 years in Global, China, Taiwan (Province of China),…
Genes, proteins, chemicals, diseases, species, mutations and cell lines named across the full text — each resolved to its canonical identifier and authoritative record.
Click any figure to enlarge with its caption.
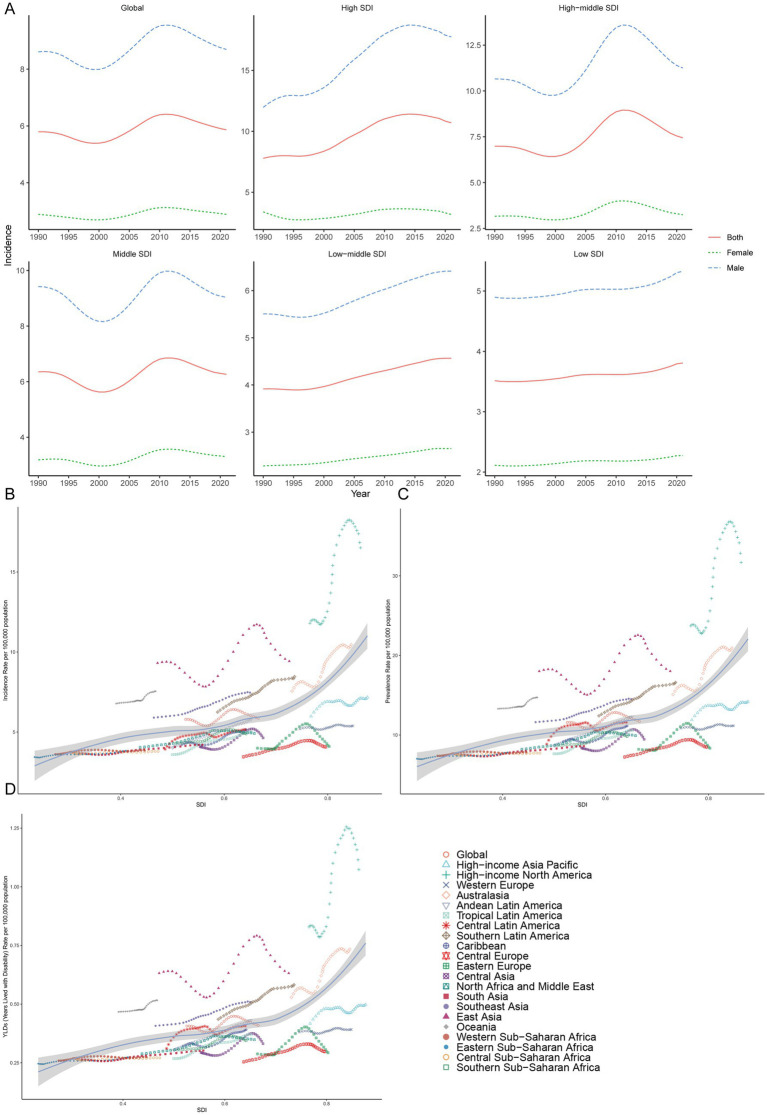 Figure 1
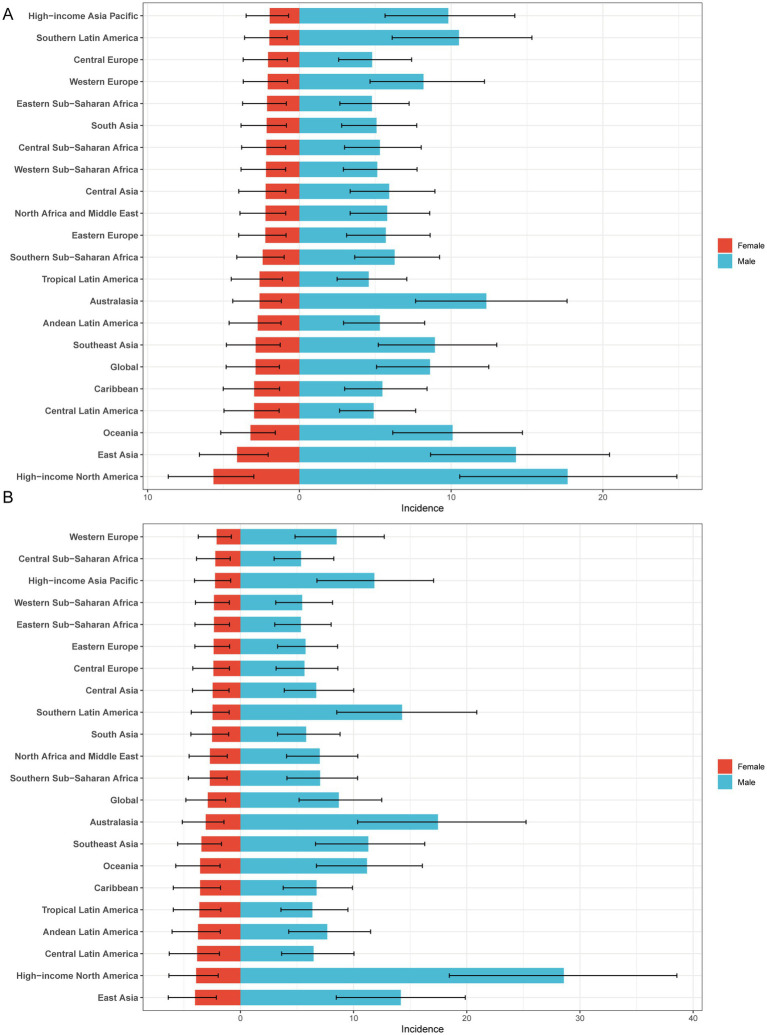 Figure 2
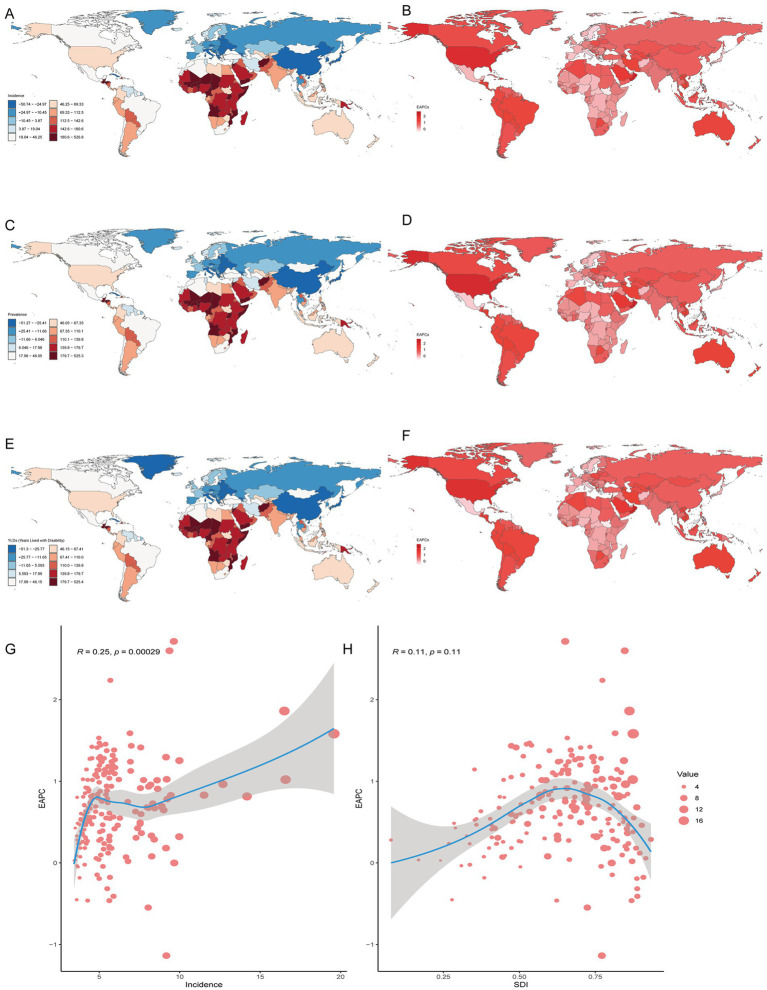 Figure 3
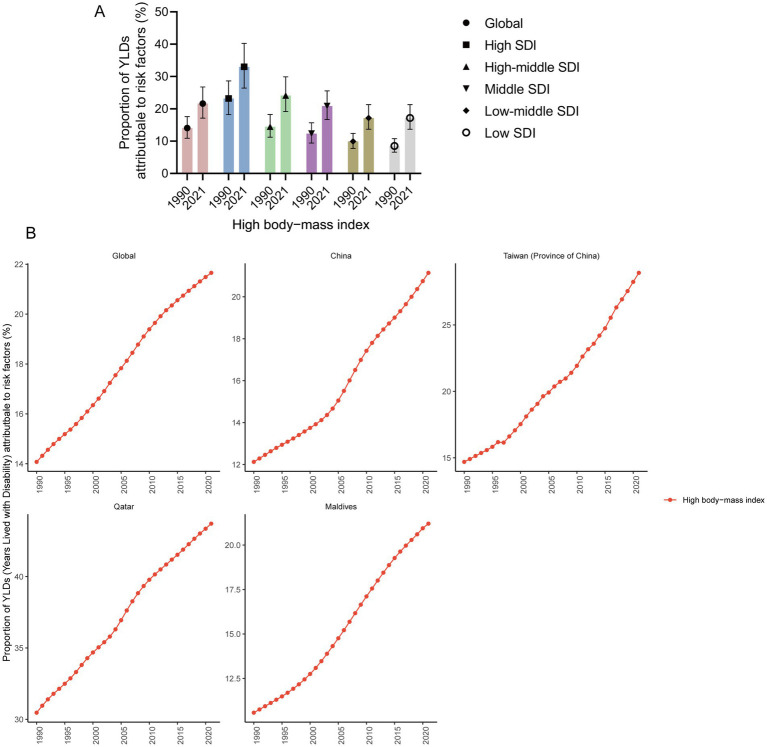 Figure 4
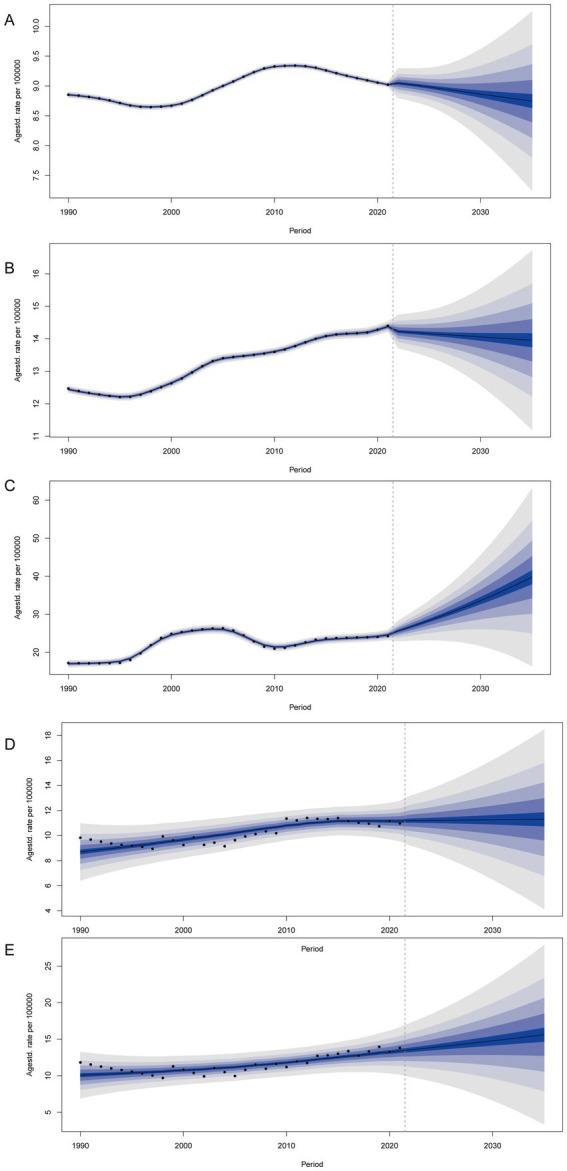 Figure 5
| Location | Rate per 100,000 (95% UI) | |||||
|---|---|---|---|---|---|---|
| 1990 (95% UI) | 2021 (95% UI) | 1990–2021 | ||||
| Incidence cases | Age-standardized incidence rates | Incidence cases | Age-standardized incidence rates | Cases change (%) (95% UI) | Rates EAPC (%) (95% CI) | |
| Global | 89630.16 (50708.96–133466.20) | 5.79 (3.28–8.63) | 110664.59 (62543.83–163447.37) | 5.86 (3.31–8.66) | 23.47 (21.66–25.92) | 0.39 (0.21–0.56) |
| High | 15251.63 (8834.97–22091.92) | 7.79 (4.51–11.28) | 19851.10 (11989.41–27842.28) | 10.70 (6.46–15.00) | 30.16 (20.60–43.82) | 1.51 (1.30–1.71) |
| High middle | 19811.65 (11343.40–29210.33) | 6.98 (4.00–10.29) | 16811.29 (9729.10–24499.96) | 7.44 (4.31–10.85) | −15.14 (−18.14 – −11.80) | 0.86 (0.53–1.19) |
| Middle SDI | 34871.45 (19906.56–51134.56) | 6.35 (3.63–9.32) | 34620.06 (19777.25–51378.11) | 6.26 (3.58–9.30) | −0.72 (−2.87 – −1.17) | 0.32 (0.10–0.54) |
| Low middle | 14165.27 (7734.54–21944.70) | 3.92 (2.14–6.07) | 25239.67 (13909.27–38640.83) | 4.57 (2.52–6.99) | 78.18 (73.29–85.08) | 0.62 (0.57–0.66) |
| Low SDI | 5469.36 (2894.45–8559.10) | 3.51 (1.86–5.50) | 14064.40 (7670.11–21822.36) | 3.81 (2.08–5.91) | 157.15 (151.36–167.23) | 0.24 (0.21–0.27) |
| Regions | ||||||
| Andean Latin America | 494.31 (258.83–778.23) | 4.02 (2.10–6.32) | 995.64 (544.71–1520.70) | 5.77 (3.16–8.81) | 101.42 (81.32–128.53) | 1.22 (1.19–1.25) |
| Australasia | 363.57 (225.00–527.14) | 7.56 (4.68–10.96) | 600.14 (350.45–867.37) | 10.46 (6.11–15.12) | 65.07 (47.05–94.17) | 1.20 (1.05–1.34) |
| Caribbean | 450.10 (234.24–707.47) | 4.21 (2.19–6.63) | 584.48 (318.12–905.88) | 5.16 (2.81–8.00) | 29.85 (22.00–42.34) | 0.75 (0.63–0.87) |
| Central Asia | 809.92 (437.02–1245.86) | 4.08 (2.20–6.28) | 1026.08 (564.81–1566.49) | 4.64 (2.55–7.08) | 26.69 (19.00–35.75) | 1.01 (0.78–1.23) |
| Central Europe | 1008.74 (515.21–1602.00) | 3.45 (1.76–5.49) | 738.39 (393.59–1167.76) | 4.07 (2.17–6.44) | −26.80 (−30.44 – −21.93) | 0.70 (0.51–0.88) |
| Central Latin America | 2131.21 (1114.91–3438.74) | 3.93 (2.05–6.34) | 3350.93 (1838.30–5302.46) | 5.15 (2.83–8.15) | 57.23 (48.02–70.21) | 0.54 (0.39–0.68) |
| Central Sub-Saharan Africa | 649.07 (350.45–1009.92) | 3.75 (2.02–5.84) | 1704.05 (902.08–2672.74) | 3.79 (2.01–5.95) | 162.54 (139.31–186.71) | 0.10 (0.05–0.14) |
| East Asia | 34668.93 (20697.02–49650.54) | 9.32 (5.56–13.34) | 22908.87 (13663.27–32620.73) | 9.43 (5.62–13.42) | −33.92 (−36.46 – −31.35) | 0.80 (0.38–1.23) |
| Eastern Europe | 1887.25 (1000.96–2970.95) | 4.00 (2.12–6.29) | 1353.45 (736.33–2105.19) | 4.10 (2.23–6.38) | −28.28 (−31.59 – −24.62) | 0.73 (0.32–1.14) |
| Eastern Sub-Saharan Africa | 2131.74 (1128.99–3379.84) | 3.44 (1.82–5.45) | 5576.84 (3022.95–8634.66) | 3.83 (2.08–5.94) | 161.61 (152.44–174.72) | 0.32 (0.29–0.36) |
| High-income Asia Pacific | 2521.14 (1444.30–3729.64) | 5.98 (3.43–8.85) | 1871.42 (1077.01–2731.85) | 7.17 (4.13–10.46) | −25.77 (−29.59 – −21.00) | 0.26 (0.14–0.38) |
| High-income North America | 7220.23 (4267.75–10166.95) | 11.80 (6.98–16.62) | 11769.64 (7609.74–16045.64) | 16.51 (10.68–22.51) | 63.01 (47.44–88.50) | 1.78 (1.49–2.08) |
| North Africa and Middle East | 4408.48 (2425.91–6845.88) | 4.05 (2.23–6.29) | 7985.88 (4368.93–12204.24) | 4.92 (2.69–7.52) | 81.15 (71.39–92.62) | 0.82 (0.69–0.95) |
| Oceania | 141.82 (85.45–209.60) | 6.78 (4.08–10.02) | 304.34 (181.91–445.03) | 7.55 (4.51–11.04) | 114.59 (97.49–131.76) | 0.35 (0.29–0.40) |
| South Asia | 12277.91 (6481.92–19228.76) | 3.67 (1.94–5.75) | 22116.65 (11929.70–34681.90) | 4.21 (2.27–6.60) | 80.13 (75.31–85.83) | 0.57 (0.50–0.63) |
| Southeast Asia | 8755.59 (5066.74–12906.36) | 5.90 (3.42–8.70) | 12771.59 (7491.00–18805.09) | 7.47 (4.38–11.00) | 45.87 (39.34–54.45) | 0.86 (0.83–0.90) |
| Southern Latin America | 827.25 (471.29–1230.27) | 6.25 (3.56–9.29) | 1297.02 (749.49–1887.13) | 8.46 (4.89–12.30) | 56.79 (41.90–75.63) | 0.95 (0.90–1.01) |
| Southern Sub-Saharan Africa | 734.51 (402.42–1122.44) | 4.30 (2.36–6.57) | 1065.28 (598.82–1599.47) | 4.88 (2.75–7.33) | 45.03 (39.00–52.57) | 0.65 (0.53–0.78) |
| Tropical Latin America | 1718.61 (882.44–2759.19) | 3.59 (1.84–5.77) | 2535.06 (1363.71–3826.45) | 5.01 (2.70–7.57) | 47.51 (36.29–65.92) | 1.20 (1.12–1.27) |
| Western Europe | 4270.93 (2404.50–6537.35) | 5.20 (2.93–7.95) | 3888.32 (2172.30–5860.48) | 5.39 (3.01–8.13) | −8.96 (−13.88 – −4.03) | 0.14 (0.09–0.19) |
| Western Sub-Saharan Africa | 2158.85 (1151.08–3384.27) | 3.61 (1.92–5.66) | 6220.54 (3381.40–9644.18) | 3.85 (2.10–5.98) | 188.14 (179.75–198.20) | 0.19 (0.12–0.25) |
| Burdens of gout among adolescents (case and rate) | 1990 (location, value 95% UI) | 2021 (location, value 95% UI) | 1990–2021 | ||||||
|---|---|---|---|---|---|---|---|---|---|
| Lowest | Most | Lowest | Most | Cases change (%) (location, value 95% UI) | Rate EAPC (%) (location, value 95% CI) | ||||
| Decrease | Increase | Decrease | Increase | ||||||
| Incidence | cases | Tokelau, 0.03 (0.09–0.05) | China, 33470.93 (19972.80–47941.56) | Tokelau, 0.03 (0.09–0.04) | China, 21592.01 (12822.88–30840.12) | Latvia, −50.74 (−56.46 – −44.42) | Qatar, 526.83 (449.67–620.13) | Romania, −2.23 (−2.51 – −1.95) | Qatar, 9.08 (7.80–10.37) |
| rates per 100,000 | Yemen, 3.00 (1.49–4.86) | Greenland, 14.54 (8.59–20.85) | Chad, 3.44 (1.78–5.38) | Taiwan (Province of China), 19.59 (12.60–27.60) | Northern Mariana Islands, −11.26 (−22.87 – −1.44) | Taiwan (Province of China), 68.96 (50.10–97.83) | Northern Mariana Islands, −1.14 (−1.53 – −0.74) | Maldives, 2.71 (2.30–3.13) | |
| Prevalence | cases | Tokelau, 0.06 (0.03–0.10) | China, 64691.25 (36666.85–103079.44) | Tokelau, 0.06 (0.03–0.09) | China, 41152.75 (23815.21–64186.99) | Latvia, −51.27 (−57.03 – −44.51) | Qatar, 525.30 (457.17–628.31) | Romania, −2.27 (−2.56–−1.971) | Qatar, 9.08 (7.80–10.37) |
| rates per 100,000 | Yemen, 6.10 (2.66–10.46) | Greenland, 29.95 (17.736–45.45) | Chad, 6.99 (3.07–11.93) | Taiwan (Province of China), 40.46 (24.50–61.82) | Northern Mariana Islands, −12.84 (−22.58 – −4.57) | Taiwan (Province of China), 76.16 (53.64–109.39) | Northern Mariana Islands, −1.27 (−1.67 – −0.86) | Maldives, 2.69 (2.26–3.11) | |
| YLDs | cases | Tokelau, 0.00 (0.00–0.01) | China, 2269.78 (1140.512–3912.66) | Tokelau, 0.00 (0.00–0.00) | China, 1443.98 (743.35–2464.09) | Latvia, −51.30 (−57.03 – −44.51) | Qatar, 525.39 (457.17–628.31) | Romania, −2.26 (−2.55 – −1.97) | Qatar, 9.06 (7.79–10.36) |
| rates per 100,000 | Yemen, 0.21 (0.09–0.41) | Greenland, 1.05 (0.54–1.74) | Chad, 0.25 (0.11–0.47) | Taiwan (Province of China), 1.39 (0.41–2.81) | Northern Mariana Islands, −12.79 (−22.58 – −4.57) | Taiwan (Province of China), 72.24 (−28.93–194.22) | Northern Mariana Islands, −1.27 (−1.67 – −0.86) | Maldives, 2.68 (2.26–3.11) | |
Peer Reviews
No public reviews on file for this paper yet. If you reviewed it on a platform where reviews are public (OpenReview, ICLR, NeurIPS, ICML), you can paste yours below so the community can read it here.
Videos
No videos yet. Explain this paper in a talk, walkthrough, or lecture? Add one.
Taxonomy
TopicsGout, Hyperuricemia, Uric Acid · Health and Wellbeing Research
Introduction
Gout is a type of crystalline inflammatory arthritis characterized by the accumulation of monosodium urate crystals within joint structures, leading to chronic conditions. Studies have reported an increasing incidence of gout among adolescents (1). Gout not only causes joint pain and deformities in adolescents (2) but also leads to liver and kidney dysfunction, dyslipidemia (2, 3), and hypertension (2), promoting the progression of chronic kidney disease (CKD) and triggering cardiovascular diseases (2). Additionally, it increases the risk of degenerative neurological disorders (4), diminishes adolescents’ interpersonal skills and stress coping abilities (5), and even increases the risk of mortality (2, 6). Therefore, the epidemic of gout among adolescents requires attention from various countries and regions; however, there have been no reports on the prevalence of adolescent gout in the recent Global Burden of Disease Study 2021 (GBD 2021).
The incidence of gout has increased in young people. Zhang et al. (1) reported a significant increase in the gout incidence among adolescents aged 15–39 years in 2019 compared with 1990. From 1990 to 1999, the incidence of gout was 12 cases per 255,950 males and 1 case per 246,346 females under the age of 25 in Britain (7). There is also report related to adolescent gout in Korea (8). From 2007 to 2015, in South Korea, the incidence of gout among individuals aged 0 to 9 years was reported to be 2 to 3 cases per 100,000 people; however, in the 10 to 19 age group, the incidence was 9 to 20 cases per 100,000 people (8). In 2021, the global incidence of gout increased by 22.5% compared with that in 1990 (9). However, there have been no reported cases of gout among adolescents aged 10–24 years in the Global Burden of Disease (GBD) 2021.
This study utilizes the GBD database to analyse trends in incidence, prevalence, years lived with disability (YLDs) related to gout, and risk factors among adolescents aged 10–24 years from 1990 to 2021. Additionally, an attribution analysis of the countries or regions with the most significant increase in incidence is conducted, and their prevalence trends are predicted. This study will promote global, regional, and national attention to the prevalence of gout among adolescents. These findings will contribute to the development of new prevention strategies and treatment approaches worldwide, helping to alleviate the burden of gout in this age group and improve health outcomes.
Methods
Study population and data collection
This study utilized repeated cross-sectional data obtained from the GBD (2021), which assessed the burden of 371 diseases and 88 risk factors in 21 regions and 204 countries and territories from 1990 to 20211 (10, 11). The GBD project is led by the Institute for Health Metrics and Evaluation at the University of Washington, which works collaboratively with partners to collect and curate the comprehensive dataset. The GBD 2021 data have been standardized, including input data, age and sex segmentation, cause of death clustering and noise reduction; then, the main models, such as the cause of death ensemble model, spatiotemporal Gaussian process regression and DisMod-MR, have been used for analysis (11).
The incidence of gout tends to occur at a relatively young age (1). This study adopts the broad age definition of 10–24 years old for adolescents, as it accurately captures the biological, social, and neurocognitive development of this population (12). Using GBD 2021, we extracted the following data, including incidence, prevalence, years lived with disability, and risk factors for gout among adolescents aged 10–24 years and conducted a secondary analysis. This study involved only data analysis and no identifiable personal information.
We conducted an analysis of the disease burden of gout among adolescents across 21 global regions, 204 countries and territories, and different regions at the sociodemographic index (SDI) level. The SDI has a scale ranging from 0 to 1, where higher values signify greater development of the social economy. The five quintiles of low, low-middle, middle, high-middle, and high were divided according to the different SDI levels. We analysed the relationships between different SDI levels across countries and regions and gout among adolescents.
Statistical analysis
The incidence, prevalence, and YLDs of gout in adolescents were extracted from the GBD 2021, along with their corresponding age-standardized rates, as the main indicators used to describe the disease burden of gout in adolescents. In the GBD database, the age-standardized rate is estimated using the world population age standard. The direct standardization method yields standardized rates (also termed age-adjusted rates), which represent weighted averages of age-specific rates. These weights, derived from the relative age distribution of an external reference population, are applied uniformly across study populations to compute a summary measure. This approach estimates the expected disease burden under the assumption that all compared populations share identical age structures, thereby enabling cross-population comparisons while controlling for demographic variations. According to the GBD algorithms, a 95% uncertainty interval (UI) is provided for every rate reported per 100,000 people. The estimated annual percentage change (EAPC) was used to evaluate the temporal trend between 1990 and 2021. If both the EAPC and its upper 95% confidence interval (CI) were negative, the age-standardized rate exhibited a downward trend; accordingly, if both the EAPC and its lower limit of the 95% CI were greater than 0, the age-standardized rate exhibited a an increasing trend. To conduct the prediction analysis, we used the Bayesian age-period-cohort (BAPC) model on the basis of the literature (13). The BAPC model is a statistical model that considers the influence of age, period, and cohort factors on disease distribution. It combines the sample information and prior information through the Bayesian method to obtain unique parameter estimates, which makes the results more robust and reliable. BAPC models can not only describe the trends of diseases according to age, period, and birth cohort but also predict future changes on the basis of these trends. Analysis of the incidence, prevalence, and YLD of gout among adolescents from 1990 to 2021 was conducted via joinpoint regression to identify temporal trends.
All the data were statistically analyzed via GraphPad Prism (version 8.0), the Joinpoint Regression Program (version 5.0.2), and R (version 4.2.3). p < 0.05 was considered statistically significant.
Results
Global trends
Incidence
The incidence of gout among adolescents aged 10–24 years globally increased from 89630.16 (95% UI 50708.96 to 133466.20) in 1990 to 110664.59 (95% UI 62543.83 to 163447.37) in 2021, with a percentage change (PC) of 23.47% (95% UI 21.66 to 25.92). The age-standardized incidence rate increased from 5.79 per 100,000 people (95% UI 3.28 to 8.63) in 1990 to 5.86 per 100,000 people (95% UI 3.31 to 8.66) in 2021, with an EAPC of 0.39 (95% CI 0.21 to 0.56) from 1990 to 2021 (Table 1).
Prevalence
The prevalence of gout among adolescents aged 10–24 worldwide increased from 179232.87 (95% UI 93890.46 to 296682.18) in 1990 to 220881.48 (95% UI 116542.40 to 364750.66) in 2021, with a PC 23.24% (95% UI 21.55 to 25.75). The age-standardized prevalence rate increased from 11.58 per 100,000 people (95% UI 6.07 to 19.18) in 1990 to 11.70 per 100,000 people (95% UI 6.17 to 19.32) in 2021, with an EAPC of 0.381 (95% CI 0.205 to 0.558) from 1990 to 2021 (Supplementary Table 1).
YLDs
Globally, the YLD for gout among adolescents aged 10–24 years increased from 6287.14 (95% UI 2958.23 to 10998.57) in 1990 to 7722.32 (95% UI 3648.10 to 13409.75) cases in 2021, with a PC of 22.83% (95% UI 19.88 to 26.45). The age-standardized YLD rate for gout among adolescents remained consistent between 1990 and 2021, with an EAPC of 0.368 (95% UI 0.19 to 0.54) from 1990 to 2021 (Supplementary Table 2).
SDI regional trends
Incidence
The higher the SDI region is, the greater the incidence in adolescents. In regions with high, high-middle, and middle SDI, the age-standardized incidence rates of gout among adolescents peaked at 11.42 (95% UI 8.14 to 14.90), 8.95 (95% UI 5.26 to 13.05), and 6.85 (95% UI 3.92 to 10.13) per 100,000 people in 2014, 2011 and 2012, respectively, and then declined. Although the gout age-standardized incidence rate among adolescents was relatively low in low-middle and low SDI regions in 1990, there was a consistent increasing trend from 1990 to 2021. By 2021, the age-standardized incidence rate among adolescents had risen to 4.57 per 100,000 people (95% UI 2.52 to 6.99) in low-middle SDI regions and 3.81 per 100,000 people (95% UI 2.08 to 5.91) in low SDI regions. Regardless of the SDI, females presented a lower age-standardized incidence rate than males did (Table 1; Figure 1A).
Prevalence of gout among adolescents in different SDI regions. (A) The age-standardized incidence rate of gout among adolescents in high, high-middle, middle, low-middle, low SDI regions. Incidence (B), prevalence (C) and YDL (D) rates across in geographic regions.
Prevalence
In regions with high, high-middle, and middle SDI, the gout age-standardized prevalence rate among adolescents peaked at 23.06 (95% UI 15.53 to 32.85), 17.56 (95% UI 9.76 to 28.14) and 13.62 (95% UI 7.12 to 22.43) per 100,000 people in 2014, 2011 and 2012 respectively, and then declined. The gout age-standardized prevalence rate among adolescents was relatively low in low-middle and low SDI regions in 1990, but there was a consistent increasing trend from 1990 to 2021. By 2021, the age-standardized prevalence rates among adolescents had risen to 9.31 (95% UI 4.53 to 15.76) and 7.75 (95% UI 3.59 to 13.28) per 100,000 people in low-middle and low SDI regions, respectively. Regardless of the SDI, males had a higher age-standardized prevalence rate than females did among adolescents (Supplementary Table 1; Supplementary Figure 1).
YLDs
In regions with high, high-middle and middle SDI, the number of gout YLDs among adolescents peaked at 1530.14 (95% UI 874.97 to 2421.19), 1624.91 (95% UI 803.45 to 2809.99) and 2784.92 (95% UI 1343.24 to 4869.23) in 2013, 2010 and 2010 respectively, and then declined. The YLD among adolescents was relatively low in the low-middle and low SDI regions in 1990, but there was a consistent increasing trend from 1990 to 2021. By 2021, the YLDs had risen to 1805.84 (95% UI 794.88 to 3271.24) and 1005.11 (95% UI 441.51 to 1847.31) in the low-middle and low SDI regions, respectively. Regardless of the SDI, the gouty YLD among adolescents is greater in males than in females (Supplementary Figure 1B; Supplementary Table 2).
21 geographic regional trends
In both 1990 and 2021, among the 21 geographic regions, the regions with the highest incidence, prevalence and YLD number of gout cases among adolescents were East Asia; however, the highest age-standardized incidence, prevalence and YLD rates were found in high-income North America. The incidence of PC decreased 33.92% (95% UI-36.46 to-31.35) from 1990 to 2021 in East Asia. However, the age-standardized incidence rate of EAPC in high-income North America increased by 1.78 (95% CI 1.49 to 2.08). In both 1990 and 2021, Oceania had the lowest incidence, prevalence and YLD number of gout among adolescents, and central sub-Saharan Africa had the lowest age-standardized incidence, prevalence and YLD rates. In both 1990 and 2021, the age-standardized incidence rates of gout among adolescents were higher in males than in females across 21 geographic regions (Figures 2B–D, 3; Table 1; Supplementary Tables 1, 2). Our study found positive correlations between SDI and gout incidence, prevalence, and YLD rates across 21 regions. Higher SDI areas consistently showed elevated adolescent gout metrics, demonstrating a clear dose-response relationship (Figures 1B–D).
Sex-specific age-standardized incidence rate of gout in adolescents. (A) 1990 age-standardized incidence rate of gout in adolescents. (B) 2021 age-standardized incidence rate of gout in adolescents.
Prevalence of gout among adolescents in 204 countries and territories. (A,C,E) PCs of incidence, prevalence and YDL number. (B,D,F) EAPCs in the incidence, prevalence and YDL rates. (G, H) Analysis of correlations among incidence, EAPC, and SDI.
National trends
In both 1990 and 2021, among the 204 countries and territories, the highest incidence, prevalence and number of YLDs among adolescents were in China. In 1990, the highest age-standardized incidence, prevalence and YLD rates of gout among adolescents were reported in Greenland. However, in 2021, the highest age-standardized incidence, prevalence and YLD rates were reported in Taiwan (Province of China). From 1990 to 2021, the greatest increase in the PC in the incidence, prevalence and YLD number of gout among adolescents was in Qatar, and the largest decrease was in Latvia. From 1990 to 2021, the greatest increase in the PC in the age-standardized incidence, prevalence and YLD rates of gout among adolescents occurred in Taiwan (Province of China), and the largest decrease occurred in the northern Mariana Islands. From 1990 to 2021, Romania exhibited the largest decrease in the incidence, prevalence and YLD number of EAPC, and Qatar exhibited the largest increase in the incidence, prevalence and YLD number of EAPC. From 1990 to 2021, the greatest increase in the age-standardized incidence, prevalence and YLD rates of EAPC was reported in Maldives, and the largest decrease was reported in the northern Mariana Islands. There was a linear relationship between the incidence, prevalence, YLD rate and EAPC; the higher the age-standardized incidence, prevalence and YLD rate were, the greater the EAPC was (p < 0.05). However, there was no significant correlation between the SDI and the incidence, prevalence, or YLD rates of EACP in 204 countries or territories (Table 2; Figure 3; Supplementary Figure 2).
Risk factors
For adolescents aged 10–24 years, a high BMI is the primary risk factor for YLD of gout among adolescents. Globally, in 2021, a high BMI accounted for 21.66% of YLDs (95% UI 17.14 to 26.76%). The higher the SDI is, the greater the impact of high BMI on YLD. In 2021, in high SDI regions, a high BMI accounted for 33.00% of YLDs (95% UI 26.43 to 40.25%). However, in low SDI regions, a high BMI accounted for only 13.09% of YLD (95% UI 10.39 to 16.21%). From 1990 to 2021, the proportion of YLDs attributed to a high BMI among adolescent gout patients increased, and there was a continuing increasing trend in global, China, Taiwan (Province of China), Qatar and Maldives. In 2021, the highest proportion of high BMIs, accounting for 43.71% (95% UI 0.34.87 to 52.86%) of YLDs, was reported in Qatar, followed by Taiwan (Province of China), accounting for 28.92% (95% UI 20.83 to 37.17%) (Figure 4).
Proportion of YLDs attributable to risk factors. (A) Proportion of YLD attributable to risk factors in high, high-middle, middle, low-middle, and low SDI regions in 1990 and 2021 (95% UI). (B) Proportion of YLDs attributable to risk factors in global, China, Taiwan (Province of China), Qatar, and Maldives from 1990 to 2021.
BAPC analysis
We predicted the age-standardized incidence rate of gout among adolescents aged 10–24 years in global, China, Taiwan (Province of China), Qatar, and the Maldives. By 2035, it is projected that the age-standardized incidence rates of gout among adolescents will be on a declining trend both globally and in China. However, the age-standardized incidence rate of gout among adolescents in Taiwan (Province of China) and the Maldives still shows an increasing trend. By 2035, the incidence of gout among adolescents is expected to be 39.77 per 100,000 people (95% UI 11.85 to 67.69) in Taiwan (Province of China) and 15.61 per 100,000 people (95% UI 1.00 to 30.22) in the Maldives. By 2035, the age-standardized incidence rate of gout among adolescents in Qatar is not expected to change significantly (Figure 5).
BAPC analysis of global (A), China (B), Taiwan (Province of China) (C), Qatar (D), and Maldives (E).
Discussion
Data from the GBD 2021 indicate an increase in the global incidence of gout (9); however, there have been no reports on the incidence of gout among adolescents aged 10–24 years. This is the first research report focusing on the incidence, prevalence, YLDs, risk factors, and predicted trends of gout in adolescents. From 1990 to 2021, there was a significant increase in the incidence, prevalence and YLD number and rates of gout among adolescents. A high BMI is the main risk factor for YLD. Gout can lead to various diseases in adolescents, such as joint deformities (2, 14), neurodegenerative changes (4), renal dysfunction (15), diabetes insipidus (16), and cardiovascular and cerebrovascular diseases (6). Adolescents are the reserve force of our social development. Therefore, focusing on adolescent health, reducing the disease burden of gout among adolescents, and improving health outcomes for adolescents are currently global public health issues.
The incidence of gout among adolescents, particularly males, has increased. In recent years, there have been frequent reports of gout cases among adolescents (17–19). There are many reasons why uric acid can be elevated in adolescents. Unhealthy eating habits are an important cause of gout (20). The consumption of excessive amounts of meat, seafood, carbonated beverages, and beer can increase blood uric acid levels (21–23). Genetic factors can increase the incidence of gout among adolescents. Mutations in SLC2A9 (24) and ABCG2 (25) can both lead to hyperuricemia and the occurrence of gout. Less physical activity were associated with a less favorable metabolic profile in adolescents (26). Less exercise easily leads to obesity. Obesity not only affects aesthetics but also, more importantly, increases the production and excretion of uric acid in the body, thereby increasing the risk of gout (27). The incidence of some underlying diseases, such as type 1 diabetes mellitus (28) and kidney disease (29), is increasing in adolescents, which increases the incidence of gout. Hormones are also a factor in gout (18). During puberty, high levels of testosterone in boys can increase serum uric acid levels, whereas estrogen in females can increase the excretion of uric acid (30). In summary, many causes lead to gout in adolescents. The prevention and control of gout in adolescents aged 10–24 years should be strengthened.
In 204 countries and territories, there was no significant correlation between the EAPC and the SDI. Changes in the EAPC may be related to policy. For example, the incidence of gout among Chinese adolescents has increased significantly with economic growth since 2001, reaching a peak in 2011 before beginning to decline. With the growth of China’s economy, the continuous improvement in the Chinese health level, and the implementation of a comprehensive medical security system, there is a certain relationship between these factors and the reduction in the incidence of gout (31).
High BMI is the primary risk factor for YLD, and it shows an increasing trend. This suggests that we should pay more attention to weight issues in the prevention and control of gout in adolescents. Excessive consumption of high-energy foods in adolescents is one of the reasons for high BMI and high uric acid levels (21, 32). High triglyceride levels can also increase the incidence of gout; for each unit increase in the triglyceride index, the risk of gout increases by 40% (33).
The prevalence of gout among adolescents shows a national or territorial trend. This study revealed that Taiwan (Province of China) had the highest age-standardized incidence, prevalence and YLD rate of gout among adolescents in 2021. Furthermore, an increasing trend in the age-standardized incidence rate was predicted by 2035. As early as 2003, a study reported that local children had relatively high levels of blood uric acid in Taiwan (Province of China) (34). Genetic factors have been implicated in the high prevalence of gout in Taiwan (Province of China) (35). The genes ABCG2 and SLC2A9 were found to be the major genetic factors governing gout in Taiwan (Province of China) (36). The prevalence of obesity in Taiwanese adolescents is another reason for the increased incidence of gout (37). Studies have shown that Taiwanese adolescents consume high amounts of fast food, high-fat snacks, processed meats, and sugar-sweetened beverages (38), which can increase the risk of gout. These findings suggest that more measures need to be taken in Taiwan (Province of China) to strengthen the prevention and control of gout among adolescents.
Strategies for coping with adolescent gout. The most direct method to control gout is to reduce and manage blood uric acid levels (39). Patients with blood uric acid levels ≤6.0 mg/dL have a lower incidence of gout (39). On the basis of the study (40), healthy eating guidelines or gout dietary guidelines for adolescents can be developed and publicized in the community or school. Exercise interventions should be carried out in adolescents to reduce the prevalence of obesity and risk factors for gout (41). For example, relevant policies can be developed to strengthen the assessment of physical activity among adolescents. For adolescents with a high BMI, losing weight is the most direct and safe way to reduce gout attacks (42, 43). Finally, for adolescents with familial inheritance tendencies, uric acid screening should be strengthened, and interventions related to diet, lifestyle, exercise and other aspects should be carried out as soon as possible.
The data for this study were obtained from the GBD database. Owing to differences in economic conditions across countries and regions, the data on adolescent gout in the GBD database are not comprehensive (9). In cases where data are insufficient to provide burden estimates for all 204 countries and territories, by year, sex, and age, data estimates depend on the out-of-sample predictive validity of the modeling process (11). The disease burden of gout in adolescents in low and middle economic areas may be much greater than that reported in the GBD database. Differences in healthcare systems, diagnostic standards, and availability of advanced diagnostic tools across regions can result in underdiagnosis or misclassification of gout, especially in areas with limited resources. For example, asymptomatic hyperuricemia or cases with unclear clinical presentations may not be consistently documented. Moreover, changes in diagnostic approaches over time can introduce temporal biases, making longitudinal comparisons more challenging. These inconsistencies may skew the accurate estimation of disease burden and highlight the need for careful interpretation when analyzing gout trends.
Conclusion
Adolescent gout is a global public health issue, particularly in countries and regions where the age-standardized incidence rate is increasing rapidly. It is strongly recommended that adolescents’ dietary patterns be adjusted, weight intervention be strengthened, and the disease burden of gout in adolescents be reduced.
The reference list from the paper itself. Each links out to its DOI / PubMed record.
- 1Zhang J Jin C Ma B Sun H Chen Y Zhong Y. Global, regional and national burdens of gout in the young population from 1990 to 2019: a population-based study. RMD Open. (2023) 9:e 003025. doi: 10.1136/rmdopen-2023-003025, PMID: 37094981 PMC 10152042 · doi ↗ · pubmed ↗
- 2Singh JA Gaffo A. Gout epidemiology and comorbidities. Semin Arthritis Rheum. (2020) 50:S 11–6. doi: 10.1016/j.semarthrit.2020.04.008, PMID: 32620196 · doi ↗ · pubmed ↗
- 3Jia E Zhu H Geng H Liu R Wo X Zeng Y. The effects of aerobic exercise on body composition in overweight and obese patients with gout: a randomized, open-labeled, controlled trial. Trials. (2022) 23:745. doi: 10.1186/s 13063-022-06695-x 36064594 PMC 9446810 · doi ↗ · pubmed ↗
- 4Topiwala A Mankia K Bell S Webb A Ebmeier KP Howard I. Association of gout with brain reserve and vulnerability to neurodegenerative disease. Nat Commun. (2023) 14:2844. doi: 10.1038/s 41467-023-38602-6, PMID: 37202397 PMC 10195870 · doi ↗ · pubmed ↗
- 5Peng J Yin L Wang K Zhang T Liu H Yang J. A study on the relationship between adolescent health behavior, BMI, and blood physical and chemical properties. Front Public Health. (2022) 10:766101. doi: 10.3389/fpubh.2022.766101, PMID: 35372227 PMC 8964522 · doi ↗ · pubmed ↗
- 6Ferguson LD Molenberghs G Verbeke G Rahimi K Rao S Mc Innes IB. Gout and incidence of 12 cardiovascular diseases: a case-control study including 152 663 individuals with gout and 709 981 matched controls. Lancet Rheumatol. (2024) 6:e 156–67. doi: 10.1016/S 2665-9913(23)00338-7, PMID: 38383089 · doi ↗ · pubmed ↗
- 7Mikuls TR Farrar JT Bilker WB Fernandes S Schumacher HR Jr Saag KG. Gout epidemiology: results from the UK general practice research database, 1990-1999. Ann Rheum Dis. (2005) 64:267–72. doi: 10.1136/ard.2004.024091, PMID: 15647434 PMC 1755343 · doi ↗ · pubmed ↗
- 8Kim JW Kwak SG Lee H Kim SK Choe JY Park SH. Prevalence and incidence of gout in Korea: data from the national health claims database 2007-2015. Rheumatol Int. (2017) 37:1499–506. doi: 10.1007/s 00296-017-3768-4, PMID: 28676911 · doi ↗ · pubmed ↗