Enhancing vehicle performance through the application of airfoils as spoilers with movable trailing edge
Ahmad Karaki, Mohammad Abu Sirreya, Majdi Zalloum, Husein Amro, Mustafa S. Abood, Aniello Riccio

TL;DR
This paper shows how adjustable spoilers on cars can improve performance and stability by dynamically controlling aerodynamic forces.
Contribution
The novelty lies in using airfoils with movable trailing edges to dynamically adjust downforce and lift forces for vehicle performance.
Findings
Adjusting the trailing edge angle increased negative lift force by up to 36% at 30 degrees.
Positive lift force improved vehicle acceleration with a 15% increase in total lift force.
Drag coefficient simulations showed a 6% discrepancy compared to Tesla's reported value.
Abstract
Vehicle safety and stability are paramount in the automotive industry, with aerodynamics playing a crucial role in enhancing these attributes. Spoilers, often used to modify airflow around vehicles, can significantly impact performance depending on their design and configuration. This study explores the use of airfoils as spoilers with adjustable trailing edges to dynamically control downforce and lift forces, aiming to improve vehicle stability and performance. Computational Fluid Dynamics (CFD) simulations were performed using ANSYS Fluent ® software (ANSYS, Inc., Canonsburg, PA, USA) The authors confirm that they have obtained the necessary license for the use of this software in academic research. to analyses the aerodynamic effects of spoilers with varying trailing edge angles (AOTE). A Tesla car model was designed in CATIA™ software (Dassault Systèmes), Vélizy-Villacoublay,…
Genes, proteins, chemicals, diseases, species, mutations and cell lines named across the full text — each resolved to its canonical identifier and authoritative record.
Click any figure to enlarge with its caption.
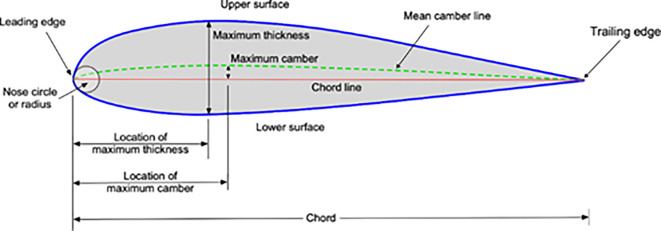 Figure 1
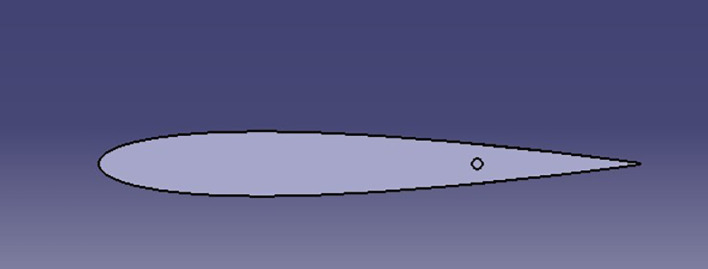 Figure 2
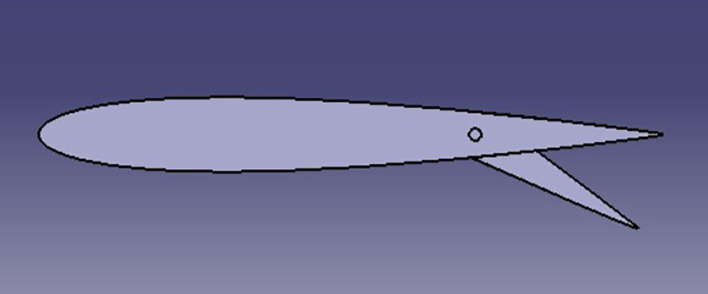 Figure 3
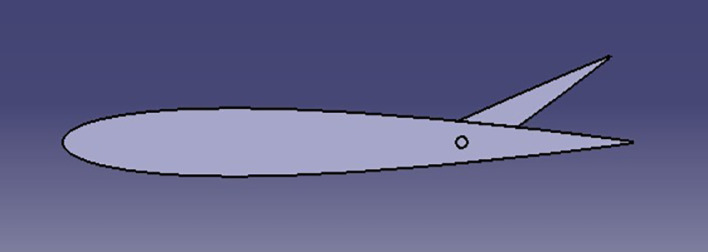 Figure 4
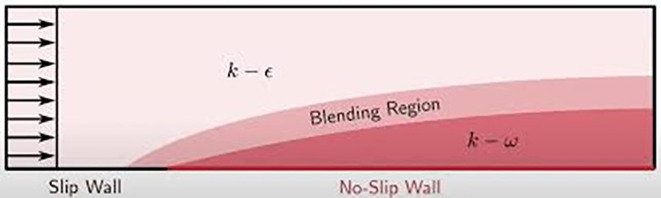 Figure 5
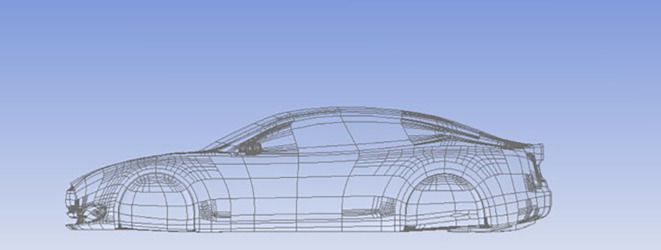 Figure 6
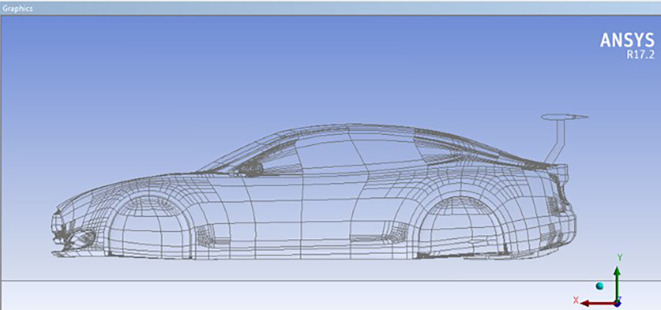 Figure 7
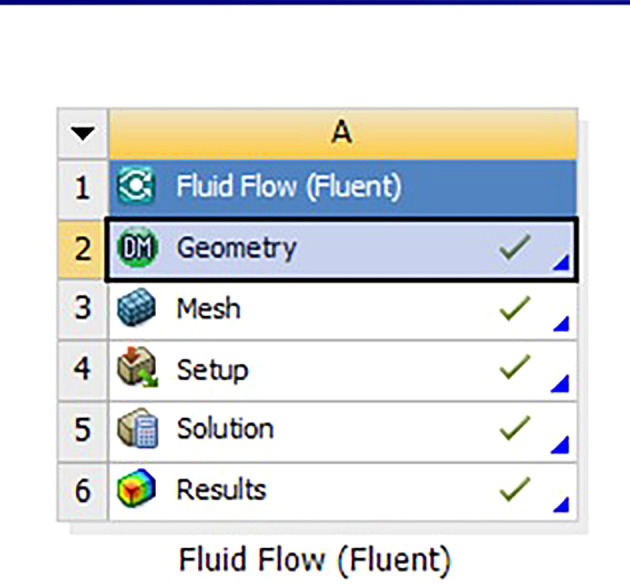 Figure 8
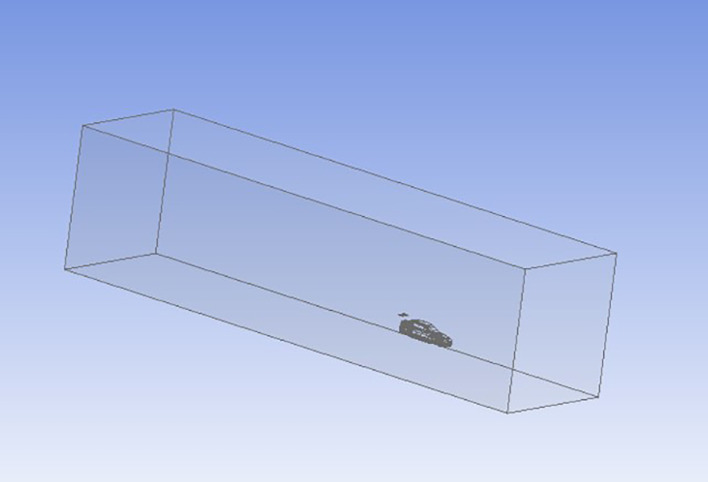 Figure 9
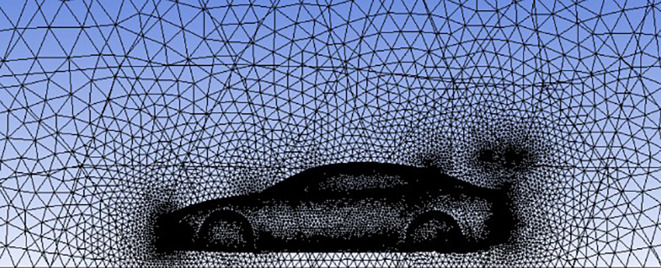 Figure 10
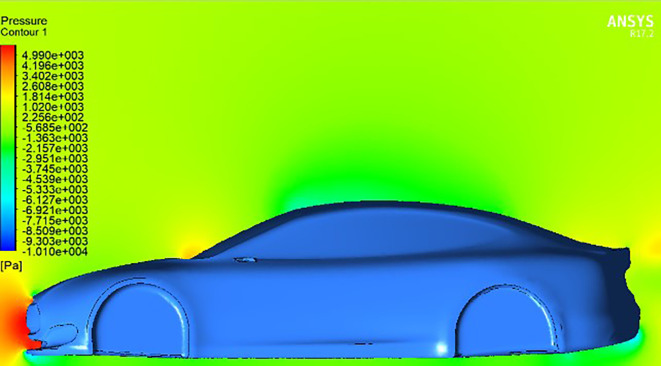 Figure 11
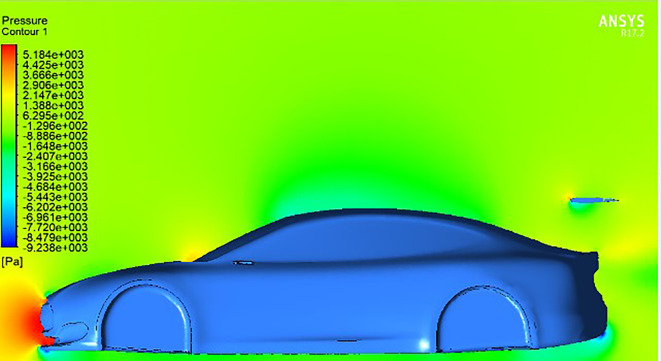 Figure 12
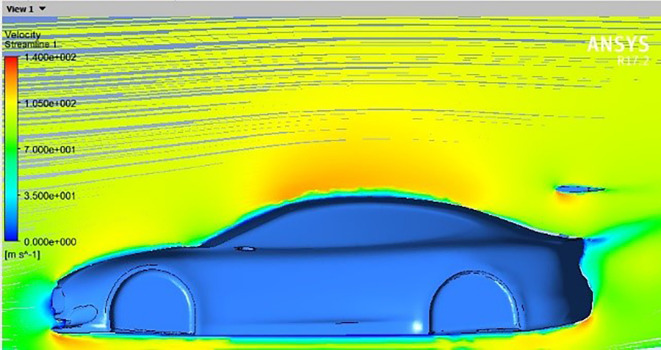 Figure 13
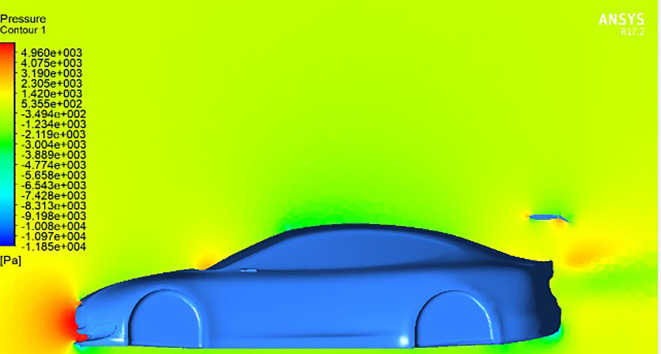 Figure 14
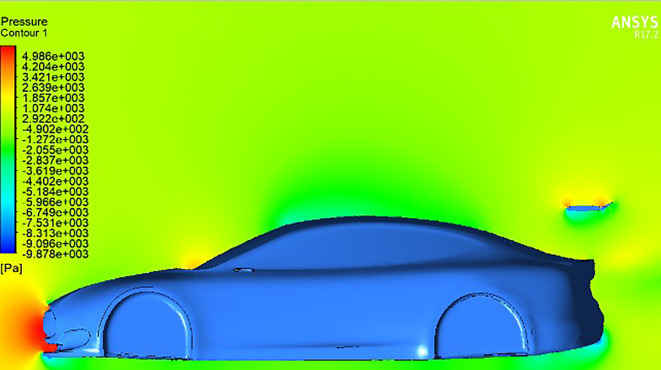 Figure 15
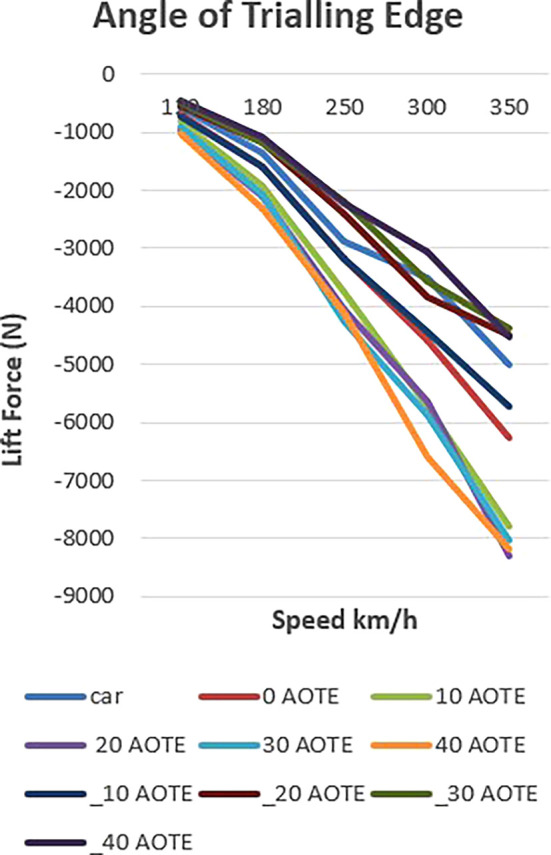 Figure 16
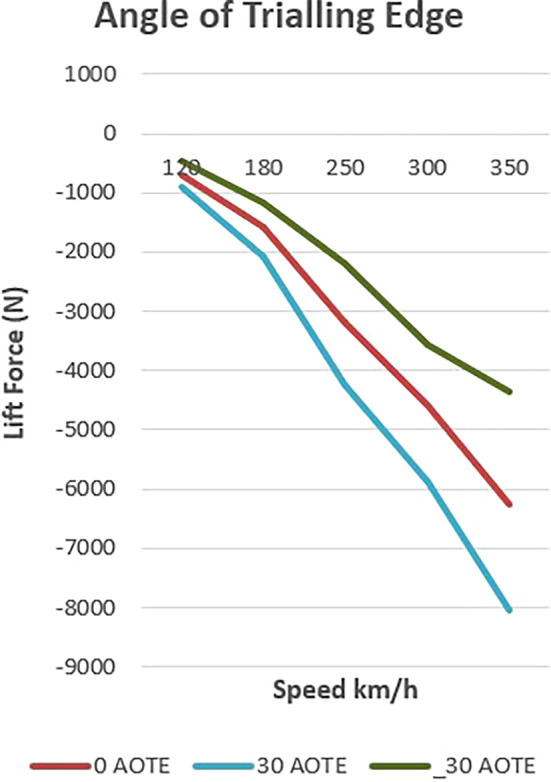 Figure 17
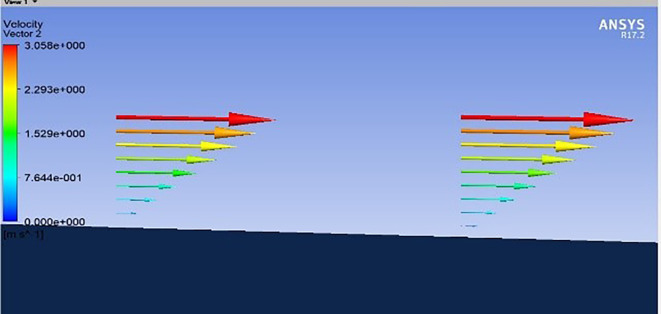 Figure 18
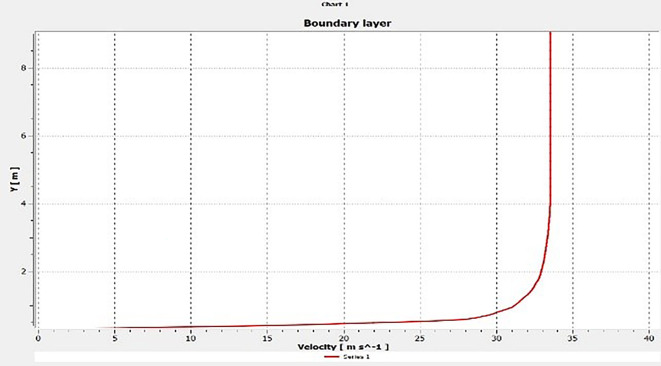 Figure 19
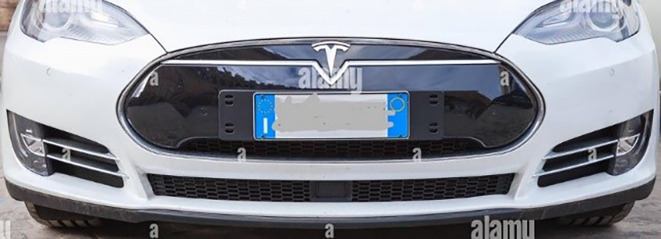 Figure 20
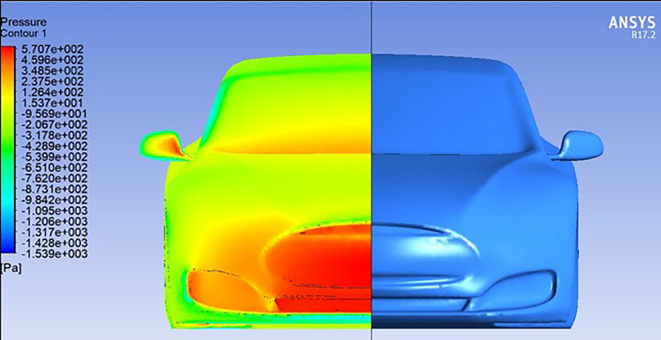 Figure 21
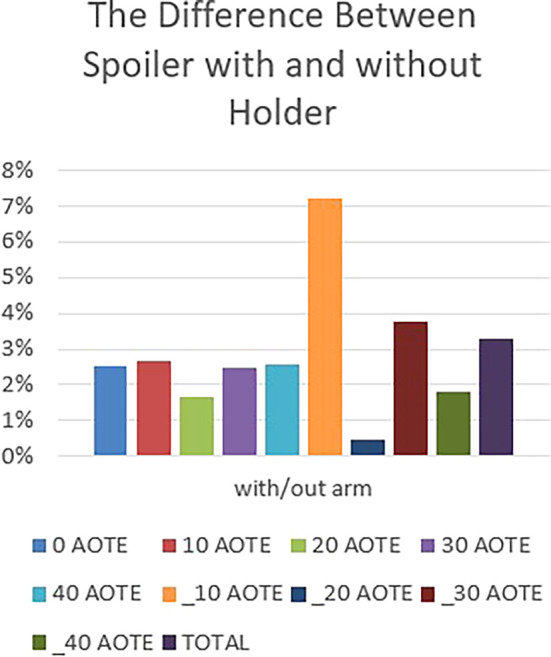 Figure 22
| Group A | |||||
|---|---|---|---|---|---|
|
| |||||
| Name | Thick | Camber | Chord | CD | CL |
|
| 13.5 | 8.3 | 0.3 m | 0.047 | 1.019 |
|
| 14.2 | 9.2 | 0.3 m | 0.052 | 1.135 |
|
| 15.2 | 8 | 0.3 m | 0.057 | 0.985 |
|
| 14.7 | 9.3 | 0.3 m | 0.068 | 1.146 |
| X | Y | Z |
|---|---|---|
| 15 m | 10 m | 10 m |
| -25 m | -0.2 m | -10 m |
| name | Boundary type | Boundary details |
|---|---|---|
| Inlet | Velocity-inlet | Normal speed, fore cases: 120 km/h, 180 km/h, 250 km/h, 300 km/h and 350 km/h. turbulence: medium (intensity = 5%). |
| Outlet | Pressure-outlet | Absolute |
| Wall | Wall | No slip |
| Symmetry | Symmetry | Half of enlister |
| Car | Wall | No slip |
| 120 (KM/H) | 180 (KM/H) | 250 (KM/H) | 300 (KM/H) | 350 (KM/H) | ||
|---|---|---|---|---|---|---|
|
| FL (N) | -573.2 | -1360 | -2886 | -3505 | -5015 |
| CL | -0.368 | -0.388 | -0.427 | -0.36 | -0.379 | |
|
| FL (N) | -701.4 | -1587.1 | -3182 | -4584 | -6264 |
| CL | -0.437 | -0.44 | -0.456 | -0.457 | -0.458 | |
|
| FL (N) | -809.12 | -1932 | -3746 | -5723 | -7793 |
| CL | -0.503 | -0.534 | -0.537 | -0.57 | -0.57 | |
|
| FL (N) | -952 | -2100 | -4060 | -5631 | -8298 |
| CL | -0.58 | -0.575 | -0.578 | -0.5553 | -0.6 | |
|
| FL (N) | -901 | -2086 | -4254 | -5867 | -8043 |
| CL | -0.56 | -0.568 | -0.6 | -0.575 | -0.58 | |
|
| FL (N) | -1016 | -2312 | -4110 | -6609 | -8183 |
| CL | -0.561 | -0.62 | -0.45 | -0.564 | -0.58 | |
|
| FL (N) | -722.22 | -1593 | -3166 | -4449 | -5725 |
| CL | -0.45 | -0.44 | -0.402 | -0.443 | -0.419 | |
|
| FL (N) | -545.5 | -1180 | -2394 | -3840 | -4487 |
| CL | -0.337 | -0.324 | -0.341 | -0.38 | -0.326 | |
|
| FL (N) | -481 | -1178 | -2197 | -3561 | -4369 |
| CL | -0.295 | -0.321 | -0.31 | -0.345 | -0.315 | |
|
| FL (N) | -467 | -1070 | -2219 | -3057 | -4530 |
| CL | -0.294 | -0.3185 | -0.28 | -0.3105 | -0.3 | |
| CD | |
|---|---|
| Tesla car | 0.24 |
| Simulated car | 0.256 |
| Car with spoiler at -30 AOTE | 0.278 |
| Car with spoiler at 0 AOTE | 0.2823 |
| Car with spoiler at 30 AOTE | 0.306 |
Peer Reviews
No public reviews on file for this paper yet. If you reviewed it on a platform where reviews are public (OpenReview, ICLR, NeurIPS, ICML), you can paste yours below so the community can read it here.
Videos
No videos yet. Explain this paper in a talk, walkthrough, or lecture? Add one.
Taxonomy
TopicsAerodynamics and Fluid Dynamics Research · Fluid Dynamics and Turbulent Flows · Vehicle emissions and performance
Introduction
Automotive spoilers, once primarily associated with high-performance sports cars and racing vehicles, have become a common sight on a wide range of automobiles. These devices, typically mounted on the rear of a car, have gained popularity among car enthusiasts for their purported ability to enhance vehicle performance, stability, and fuel efficiency. This study delves into the effect of spoilers on car performance to provide a comprehensive understanding of their impact.
Spoilers, as aerodynamic appendages, are designed to modify the airflow around a vehicle. They can take various forms, including lip spoilers, wing spoilers, and even roof spoilers, each designed with distinct aerodynamic objectives. Some enthusiasts believe that the addition of a spoiler to a car can improve its speed, cornering capabilities, and fuel economy. However, the efficacy of these modifications depends on factors such as the design, size, and installation of the spoiler, as well as the specific characteristics of the vehicle it is attached to.
The primary goal of this study is to systematically investigate the influence of spoilers on various aspects of car performance, shedding light on the practical implications of their use. The investigation covers aerodynamic effects, handling, and stability, with the aim of providing empirical evidence to support or refute the claims associated with spoilers.
As automotive technology continues to advance, and with a growing focus on energy efficiency and environmental impact, understanding the role of spoilers in vehicle performance is crucial. This study contributes to the body of knowledge in the automotive field and helps dispel myths surrounding the effects of spoilers on cars.
In the subsequent sections of this study, delve into the research methodology, data collection, and analysis, with the aim of providing a comprehensive and evidence-based evaluation of the effect of spoilers on vehicle performance. The results of this investigation have the potential to influence future automotive design considerations, consumer choices, and the broader understanding of the role of spoilers in the automotive industry.
This study embarks on a comprehensive exploration of the effects of spoilers on vehicle performance, using a combination of CATIA for design and ANSYS for computational fluid dynamics (CFD) simulations to provide a holistic understanding.
Literature review
Once exclusive to high-performance sports cars, spoilers have become common on various vehicles, sparking curiosity about their impact beyond aesthetics. Researchers have delved into the intricacies that define how spoilers influence modern vehicles.
In aerodynamics, studies by Smith and Johnson ^ 1 ^ carefully examined spoiler designs, decoding their effects on airflow and downforce. This research goes beyond aesthetics, aiming to understand how spoilers enhance a vehicle’s aerodynamic efficiency.
Patel and Garcia ^ 2 ^ further explored this by using Computational Fluid Dynamics (CFD) simulations to scrutinize fluid dynamics and pressure associated with spoilers. Their work provides insights into optimizing spoiler aerodynamics.
Simultaneously, Thompson et al. ^ 3 ^ empirically explored the real-world impact of spoilers on speed and handling. Their studies quantified how different spoiler configurations influence acceleration, braking, and cornering forces, providing tangible data on dynamic behaviour.
Chen et al. ^ 4 ^ investigated vehicle stability and rollover prevention, acknowledging that spoilers contribute to safety. They explored parameters such as steering input, speed, and ground friction to design spoilers that enhance stability and reduce rollover risks.
In tandem, other scholars broadened the scope. Green et al. ^ 5 ^ assessed the ecological footprint of spoiler design, considering energy efficiency and sustainability. Concurrently, studies on driver preferences ^ 6 ^ balanced aesthetics and functional efficacy in spoiler design.
As the automotive industry continues to advance, tools like MATLAB and ANSYS have been employed to unravel the interplay between spoilers and control mechanisms. This integration optimizes not only aerodynamic performance but also overall efficiency and safety.
While existing literature provides valuable insights, this study offers a detailed methodology. By presenting an evidence-based evaluation, researchers aim to contribute to and redefine how spoilers, with evolving designs and technologies, shape the performance landscape of contemporary automobiles.
Airfoil
Airfoil is a shape designed to generate lift when air flows over it. The shape is typically found in cross-sections of wings, blades, and other surfaces that move through air, such as aircraft wings, helicopter rotor blades, propellers, and wind turbines.
Figure 1 presents graphical depictions of key aerodynamic features associated with an airfoil, offering insights into its geometry. The following elements are typically illustrated:
- (1) Camber line:The camber line represents the curve defining the maximum distance between the upper and lower surfaces of the airfoil. It characterizes the camber or curvature of the airfoil. This line is crucial in determining the lift characteristics of the airfoil, as it influences the distribution of pressure around the surface.
- (2) Chord line:The chord line is a straight line connecting the leading edge to the trailing edge of the airfoil. It serves as a fundamental reference for aerodynamic analysis.The angle of attack, a parameter crucial to lift generation, is typically measured with respect to the chord line.
- (3) Thickness:The thickness of the airfoil is the maximum distance between the upper and lower surfaces, perpendicular to the chord line. This dimension contributes to the overall aerodynamic characteristics and structural considerations of the airfoil.
- (4) Trailing edge:The rear edge of an airfoil is where the airflow separated by the Leading Edge regions and where the essential control surfaces are located.
Airfoil geometry.
Airfoil group
Understanding the aerodynamic characteristics of different airfoil shapes is crucial for the design and performance optimization of aircraft wings. Airfoils are the cross-sectional shapes of wings and are designed to produce lift efficiently while minimizing drag. Table 1 presents a comprehensive comparison of various airfoil groups, detailing their geometric and aerodynamic properties.
As shown in Table 1, the NACA0012 airfoil was selected for its symmetrical properties. This design rationale hinges on adopting a spoiler configuration distinguished by symmetrical geometric attributes. Within this framework, the lift force demonstrates asymptotic convergence towards nullity, displaying minimal sensitivity to variations in airspeed. The inherent geometric symmetry of the spoiler facilitates meticulous control over lift force modulation during spoiler articulation, ensuring precision in both lift augmentation and attenuation.
This particular design subtlety assumes significance owing to its contribution to heightened accuracy in lift force management, regardless of the directional adjustments (upward or downward). The deliberately engineered symmetrical spoiler configuration confers stability and predictability to the nuanced control of lift forces, providing a refined and controlled response across diverse aerodynamic conditions. This precision proves integral to optimizing the spoiler’s performance, especially during manoeuvres that demand exacting lift adjustments.
CATIA model
In this section, the shapes provide an illustration of the shape of the spoiler with different angles of trailing edge.
Spoiler model at 0 angle of trailing edge.
Spoiler CATIA model at negative angle of trailing edge.
Spoiler CATIA model at positive angle of trailing edge.
Computational Fluid Dynamics (CFD)
It is a branch of fluid mechanics that uses numerical methods and algorithms to solve and analyse problems involving fluid flow. Fluid flow can occur in various contexts, such as air flow around an aircraft, water flow in rivers, heat transfer in pipes, and many others.
CFD simulations involve dividing the fluid domain into a grid or mesh of small elements and solving mathematical equations that govern fluid flow, heat transfer, and other related phenomena. These equations, which describe the conservation of mass, momentum, and energy, are solved iteratively to obtain a numerical solution that represents the behaviour of the fluid.
In the automotive context, CFD is utilized to simulate and analyse the airflow around a car’s body and various components. Engineers can assess the impact of different design elements, such as spoilers, body shapes, and side mirrors, on aerodynamic performance. By virtually testing these components through CFD simulations, engineers can optimize designs to achieve goals like minimizing drag, maximizing downforce, and enhancing overall aerodynamic efficiency.
In summary, the integration of CFD in the automotive industry, particularly in the context of cars, allows engineers to optimize aerodynamic performance by virtually testing and refining designs. This approach significantly reduces the need for expensive and time-consuming physical experiments, leading to more efficient and effective vehicle designs.
Turbulence model (
SST k- ω Model)
The Shear Stress Transport (SST) k- ω turbulence model, introduced by Menter, ^ 7 ^ is a widely used two-equation eddy-viscosity model known for its versatility in simulating complex flows. This model effectively combines the strengths of the k- ω and k- ε formulations. In the near-wall region, the k- ω formulation is employed, allowing the model to accurately capture boundary layer effects without requiring additional damping functions. In the free-stream region, the model transitions to k- ε behaviour, addressing the sensitivity issues often associated with traditional k- ω models when dealing with free-stream turbulence properties.
One of the key advantages of the SST k-ω model is its robust performance in flows with adverse pressure gradients and separation, making it particularly suitable for simulating the complex airflow patterns around vehicle spoilers. However, the model tends to overpredict turbulence levels in regions with high normal strain, such as stagnation points or areas of strong acceleration. Despite this limitation, the SST k-ω model remains a preferred choice for aerodynamic simulations due to its overall accuracy and reliability. ^ 8 ^
Turbulence model.
Kinematic Eddy Viscosity:
Where:
a 1: Model constant, typically around 0.31.
** S **: Strain rate magnitude.
Turbulence Kinetic Energy:
Specific Dissipation Rate:
Where:
k: Represents the energy contained in turbulent eddies.
P: Production of k, usually due to velocity gradients.
β ^∗^: Model constant, controls the dissipation rate of k to ω.
ω: Specific dissipation rate.
v: Kinematic viscosity.
σ: Model constant, controls the turbulent diffusion of k.
v * t *: Turbulent viscosity.
Closure Coefficients and Auxiliary Relations:
- • Near-Wall Treatment: In the near-wall region, F1≈1 ensures that the k- ω model is used, which is more accurate for capturing the effects close to the wall.
- • Away from the Wall: Further away from the wall, F1 decreases towards 0, blending towards the k- ϵ model, which is better suited for free-stream turbulence.
- • Turbulent Viscosity Adjustment: F2 further refines the turbulent viscosity calculation to ensure smooth and accurate transitions between the near-wall and far-field regions.
Ansys simulation and result analysis
This chapter presents the results of aerodynamic simulations conducted using ANSYS Fluent ^®^ software (ANSYS, Inc., Canonsburg, PA, USA). Two primary configurations were analyzed: a baseline car model without any modifications and a modified car model equipped with a spoiler featuring adjustable trailing edge angles (AOTE). The simulations were performed to evaluate the impact of spoiler adjustments on vehicle aerodynamics and stability.
The car model was designed using CATIA, and the computational domain was created to represent a wind tunnel. The simulations were conducted at various speeds, ranging from 120 km/h to 350 km/h, to assess the aerodynamic forces under different driving conditions. The Shear Stress Transport (SST) k- ω turbulence model was employed to capture the complex airflow patterns around the vehicle and spoiler.
Car model
A simple Tesla model was drawn on CATIA software, which is shown in Figure 6.
Car model.
Car model with spoiler
The design of the spoiler type is NACA0012, 120*45 cm with different AOTE.
Car model with spoiler.
Process procedure
The ANSYS simulation process involves several sequential steps to ensure accurate and reliable results. These steps include pre-processing, meshing, setting up boundary conditions, and selecting the appropriate turbulence model. Each stage is critical for achieving a realistic representation of the aerodynamic behaviour of the vehicle. The sequence of processes in the ANSYS Workbench is illustrated in Figure 8.
Sequence of processes in ANSYS.
**Pre-processing **:
The first step in the simulation process is pre-processing, where the car model is prepared for analysis. The 3D model of the car, designed in CATIA, is imported into ANSYS Geometry. A computational domain, or enclosure, is then created around the car to simulate a wind tunnel environment. The dimensions of the enclosure are provided in Table 2, and the enclosure is visualized in Figure 9.
Enclosure.
Meshing:
The next step is meshing, where the computational domain is divided into a grid of small elements. Proper meshing is essential for accurate results, as an improperly meshed model can lead to incorrect solutions. Special attention is given to refining the mesh around the car and spoiler, where the interaction between air molecules and the vehicle is most significant. The meshed model is shown in Figure 10.
Car model after meshing process.
Boundary conditions:
After meshing, the boundary conditions are defined to simulate real-world airflow conditions. The inlet is set as a velocity inlet with speeds ranging from 120 km/h to 350 km/h, while the outlet is defined as a pressure outlet. No-slip boundary conditions are applied to the car and spoiler surfaces, and symmetry conditions are used to reduce computational cost. The details of the boundary conditions are provided in Table 3.
Turbulence model:
The final step in the setup process is selecting the turbulence model. The Shear Stress Transport (SST) k- ω model is chosen for its ability to accurately capture the complex airflow patterns around the vehicle, particularly in regions with adverse pressure gradients and flow separation.
Result analysis and discussion
After finishing the fourth pre-process step, the model was ready to do the final step, which is the solution to get the results.
Streamline and pressure contour for car model and spoiler with difference AOTE:
The following figure illustrates the airflow streamlines and pressure contour around a car model equipped with a spoiler at various angles of trailing edge (AOTE). As the AOTE changes, the behaviour of the airflow around the car and spoiler also changes, influencing the aerodynamic forces such as lift, drag, and downforce. These streamlines help visualize how different AOTE settings impact the car’s performance and stability.
The illustrations provide a captivating exploration of the aerodynamic complexities surrounding a car’s wings. Initially, in the absence of a moving wing Figure 11, the car experiences a distribution of air pressure, mainly concentrated on the front bumper with slight effects on the windshield near the wipers. With the introduction of a rear wing with a trailing edge equal to zero degrees, as shown in Figure 12, we notice that a clear concentration of pressure appears in the front part of the spoiler, which affects the increase in downforce. This unexpected observation challenges the traditional assumptions of this type of airfoil, where no lift or pressure force is generated when the angle is zero. Figure 13 reveals the reason for this, as it reveals that the dynamic air flow interacts with the front part of the spoiler at an angle instead of colliding with the spoiler horizontally, which leads to an increase in downforce.
Pressure contour for car model.
Pressure contour for car model and spoiler at 0 AOTE.
Streamline for car model and spoiler at 0 AOTE.
And in Figure 15, a higher trailing edge angle results in a noticeable concentration of pressure on the trailing edge of the wing, resulting in a significant increase in downforce and a consequent enhancement of the vehicle’s aerodynamic stability. Figure 14. Here, the downward motion of the trailing edge angle redirects airflow down the trailing edge of the wing, generating lift forces. This aerodynamic phenomenon introduces a counterforce that reduces the overall downforce.
Pressure contour for car model and spoiler at negative AOTE.
Pressure contour for car model and spoiler at positive AOTE.
In summary, the figures underscore the essential function of spoilers in aerodynamic control. Through visual examination, it becomes evident how alterations in spoiler angles can profoundly influence airflow patterns, leading to enhanced performance and manoeuvrability. This emphasizes the significance of carefully adjusting spoiler configurations to optimize vehicle dynamics and efficiency.
Lift force chart and table
The relationship between speed, angle of trailing edge (AOTE), and the resulting lift force is illustrated in Figure 16 and Table 4. The data points represent measurements taken at specific speeds with corresponding AOTE values, demonstrating how these factors influence the lift force generated. The results highlight the significant impact of AOTE adjustments on vehicle aerodynamics, particularly at higher speeds.
Down force with different AOTE.
The presented Figure 17 delineates the influence of controlled downforce manipulation on vehicle dynamics, specifically focusing on lift and downforce. In the baseline scenario, the vehicle exhibits a progressive increase in downforce with rising velocity, reflecting its inherent design characteristics.
Down force at (-30, 0, 30) AOTE.
Upon the introduction of a spoiler mechanism and subsequent adjustments to its configuration, a discernible alteration in lift and downforce profiles is observed. This controlled manipulation of aerodynamic forces enables a targeted optimization strategy aimed at augmenting both stability and efficiency metrics.
Lowering the spoiler configuration results in a reduction of downforce, thereby mitigating lift and enhancing overall aerodynamic efficiency. This reduction translates into diminished aerodynamic drag, consequently improving the vehicle’s efficiency profile. Conversely, elevating the spoiler configuration yields an amplification of downforce, concurrently bolstering vehicle stability, particularly during high-speed manoeuvres where lateral stability is critical.
Notably, the depiction of lift and downforce values as negative underscores their respective orientations. This negative representation signifies their downward and upward forces, respectively. Thus, even amid downforce reduction, stability remains preserved, mitigating potential risks associated with compromised stability, such as lateral instability or loss of traction.
In summary, the chart elucidates the efficacy of controlled downforce manipulation in optimizing vehicle dynamics. Through strategic adjustments to spoiler configuration, this study presents a scientifically grounded approach to concurrently enhancing stability and efficiency without compromising safety or performance criteria in vehicular engineering.
Boundary layer.
Boundary layer.
Drag Force
The simulation results yielded a drag force coefficient of 0.256 for the car, which represents a 6% deviation from Tesla’s officially reported coefficient of 0.24. ^ 9 ^ This discrepancy can be attributed to two primary factors:
Mesh Refinement: The computational mesh used in the simulation, while adequate for initial analysis, could be further refined to enhance accuracy. A higher-resolution mesh would likely produce aerodynamic data more closely aligned with real-world measurements.
- 2. Front Bumper Design: The actual Tesla Model S incorporates perforations in the front bumper, as depicted in Figure 20, Figure 21 which are designed to reduce drag. These features were not replicated in the simulation, resulting in a higher simulated drag coefficient.
Tesla S model 2015 front bumper design.
Pressure contour.
To address this discrepancy, future simulations should focus on improving mesh resolution and incorporating detailed design elements, such as the front bumper perforations. These adjustments would enable the simulation results to more accurately reflect the aerodynamic performance reported by Tesla. The drag coefficients for various spoiler configurations are presented in Table 5.
The simulations were conducted in compliance with Tesla’s testing guidelines, which specify a test speed of 70 mph for determiningaerodynamic coefficients. This ensures that the simulation conditions are consistent with real-world testing protocols, providing a reliable basis for comparison.
Spoiler with and without holder effect
The placement of a rear spoiler on a vehicle, whether with or without stands (feet), ^ 10, 11 ^ can affect its aerodynamic performance. This study investigates this phenomenon by analysing lift force data obtained from spoilers with and without stands. Comparing the results highlights notable differences in aerodynamic behaviour based on stand placement. This underscores the importance of stand configuration in rear spoiler design and its implications for optimizing vehicle aerodynamics.
The graph in Figure 22 indicates a clear difference between the results obtained for the spoiler with or without a holder (stand, feet, etc.). This variance underscores the significant influence of the holder’s design, shape, and positioning on aerodynamics. It emphasizes the importance of carefully considering these factors in holder design to optimize aerodynamic performance and ensure effective integration with the vehicle’s overall aerodynamic profile.
The difference between spoiler with and without holder.
Conclusion
The project focused on enhancing vehicle performance through the application of airfoils as spoilers with a movable trailing edge has provided valuable insights into automotive dynamics. The key findings are as follows:
- (1) Dynamic downforce control: The use of airfoils with a movable trailing edge in spoiler design allows for real-time adjustment of downforce. This enables precise tuning of aerodynamic properties, enhancing vehicle stability and handling in various driving conditions.
- (2) Enhanced stability and handling: By dynamically increasing or decreasing downforce, the vehicle maintains optimal grip and balance, especially during high-speed driving and cornering. This results in improved safety, better handling, and increased driver confidence, reducing the risk of skidding and loss of control.
- (3) Improved acceleration: The ability to reduce downforce when it is not needed, such as during straight-line acceleration, minimizes the negative impact of excessive downforce on speed. This leads to improved acceleration performance, allowing the vehicle to achieve faster and more efficient speed increases without compromising stability.
- (4) Feasibility of integration: The project has demonstrated that integrating this advanced aerodynamic feature into existing vehicle systems is feasible without extensive modifications. This practical aspect facilitates easier adoption and implementation within the automotive industry.
- (5) Future research and development: Further research is recommended to optimize the control algorithms and fully explore the benefits of this technology under a wider range of conditions. Continued development will focus on maximizing performance gains, ensuring reliability, and assessing long-term durability.
In conclusion, the application of airfoils as spoilers with movable trailing edges represents a significant advancement in vehicle performance enhancement. This innovative approach allows for precise control of downforce, leading to improved stability, handling, and acceleration. The findings provide a solid foundation for future developments, highlighting the potential for widespread application of this technology to enhance vehicle performance, efficiency, and safety.
Note
Some of the simulated data has been attached to a public database that you can view. ^ 12 ^
Ethics and consent
Ethical approval and consent were not required for this study, as it did not involve human participants, animal subjects, or sensitive data. The research focused solely on computational simulations and analysis of aerodynamic performance using publicly available data and software tools.
The reference list from the paper itself. Each links out to its DOI / PubMed record.
- 1Smith A Johnson B : Aerodynamic design of automotive spoilers. Journal of Vehicle Engineering. 2018;25(3):123–140.
- 2Patel S Garcia M : Optimizing automotive spoiler design for improved aerodynamic performance. International Journal of Vehicle Design. 2021;35(2):145–162.
- 3Thompson C : Effects of spoiler configurations on speed and handling. International Journal of Automotive Performance. 2019;12(2):78–92.
- 4Chen X : Stability enhancement and rollover prevention with automotive spoilers. Journal of Vehicle Safety. 2017;22(4):321–340.
- 5Green R : Environmental considerations in automotive spoiler design. Journal of Sustainable Transportation. 2022;40(1):56–75.
- 6Lee H Kim J : Design integration of spoilers in vehicles for improved efficiency. International Journal of Automotive Engineering. 2019;29(4):321–336.
- 7Menter FR : Zonal two equation k-ω turbulence models for aerodynamic flows. AIAA Paper. 1993;93–2906.
- 8Menter FR : Two-equation eddy-viscosity turbulence models for engineering applications. AIAA J. 1994;32(8):1598–1605.