Staging of oral cavity cancer in the 8th edition of the TNM classification: The role of computed tomography in the assessment of depth of invasion and extranodal extension
Leticia de Franceschi, João Manoel Miranda Magalhães Santo, Anniely Mourão de Abreu, Marco Aurélio Vamondes Kulcsar, Claudio Roberto Cernea, Marcio Ricardo Taveira Garcia, Rogerio Aparecido Dedivitis, Leandro Luongo Matos

TL;DR
This study shows that computed tomography can accurately assess tumor depth and staging in oral cavity cancer, aligning with pathological findings.
Contribution
The study validates pre-surgical CT evaluation criteria for oral cavity cancer based on pathological depth of invasion standards.
Findings
CT with venous contrast correlates strongly with tumor thickness and depth of invasion at pathology.
Tomographic evaluation upstaged most lesions under both TNM-7 and TNM-8 criteria.
Moderate correlation was found between tomographic and pathological T classifications for tumor thickness and DOI.
Abstract
•Strong positive correlation between tumor thickness and tomographic depth of invasion.•Positive correlation between tomographic tumor thickness and pathological tumor thickness.•Positive correlation between tomographic depth of invasion and pathological depth of invasion.•Tomographic evaluation of deep of invasion upstaged most of lesions. Strong positive correlation between tumor thickness and tomographic depth of invasion. Positive correlation between tomographic tumor thickness and pathological tumor thickness. Positive correlation between tomographic depth of invasion and pathological depth of invasion. Tomographic evaluation of deep of invasion upstaged most of lesions. Suggest and validate pre-surgical tomographic evaluation criteria for OCC based on the pathological DOI criteria. A retrospective cohort study was conducted with 80 patients with tongue and floor of mouth…
Genes, proteins, chemicals, diseases, species, mutations and cell lines named across the full text — each resolved to its canonical identifier and authoritative record.
Click any figure to enlarge with its caption.
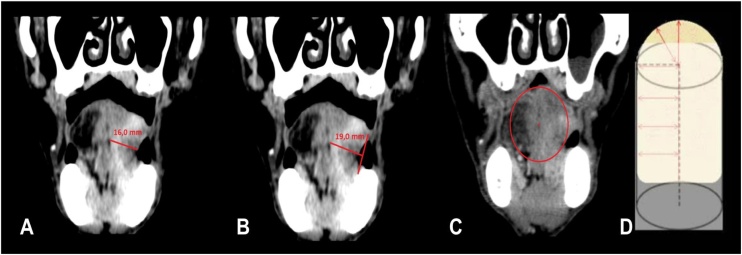 Figure 1
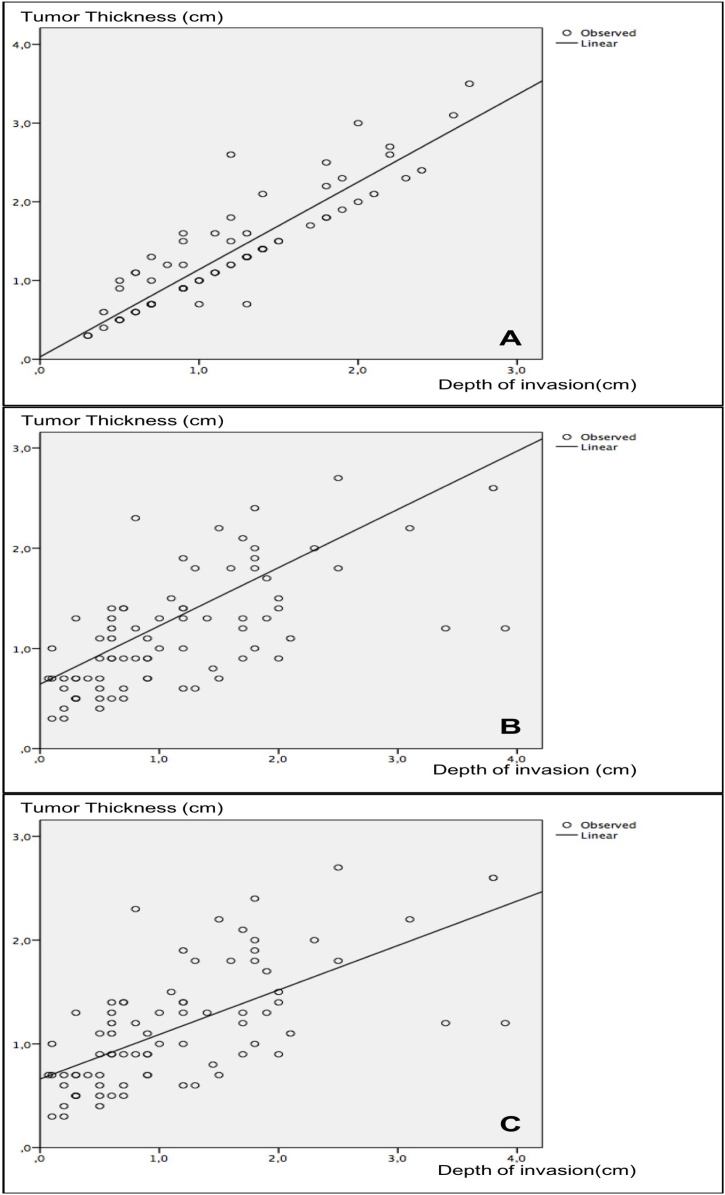 Figure 2
Peer Reviews
No public reviews on file for this paper yet. If you reviewed it on a platform where reviews are public (OpenReview, ICLR, NeurIPS, ICML), you can paste yours below so the community can read it here.
Videos
No videos yet. Explain this paper in a talk, walkthrough, or lecture? Add one.
Taxonomy
TopicsHead and Neck Cancer Studies · Oral Health Pathology and Treatment · Oral and Maxillofacial Pathology
Introduction
In 2016, the American Joint Committee on Cancer (AJCC) published a review of the Tumor, Nodule and Metastasis cancer staging system (TNM-8).1, 2
Depth of Invasion (DOI) is already assessed in the AJCC Cancer Staging System for other types of cancer, such as melanoma and cutaneous and uterine cervix Squamous Cell Carcinoma (SCC). Recently, this factor was identified as an independent predictor of recurrence and survival in oral SCC,3 and was incorporated into this edition.
Oral Cavity Cancer (OCC) staging includes the evaluation of the tumor DOI in both clinical assessment and postoperative pathological outcome, but the clinical evaluation of DOI is not well defined, as well as the determination of this measure by imaging examinations such as Computed Tomography (CT). Presence of Extranodal Extension (ENE) has also been included in this edition of the TNM cancer staging system, and should be assessed clinically, through imaging examinations, and in anatomopathological study. This factor is considered one of the most important prognostic predictors in Head and Neck (HN) cancer.4
The objective of the present study was to suggest pre-surgical tomographic evaluation criteria from the new pathological criteria of the TNM-8, based on comparative assessment between the pathological and radiological stages.
Methods
This is a retrospective, cohort study approved by the Research Ethics Committee (protocol nº 228/14) of the aforementioned Institution conducted with 80 consecutive patients with Squamous Cell Carcinoma (SCC) of the tongue or floor of mouth, T1 or T2, submitted to surgical treatment with curative intent from August 2009 to December 2015. Exclusion criteria comprised patients who had undergone rescue surgeries and who did not have CT after contrast injection.
Clinical and demographic data were obtained by reviewing the patients’ electronic medical records. The following data were collected: gender, age, smoking/alcoholism, subsite and characteristics of the primary lesion, lymph node status, presence of distant metastasis, and pathological data, resection margins, degree of differentiation, presence of perineural or angiolymphatic invasion, tumor dimensions, tumor thickness, depth of invasion, lymph node metastases, and extracapsular spread.
Pathological parameters were analyzed by a single pathologist. Depth of Invasion (DOI) was measured from the epithelial basement membrane to the deepest point of tumor invasion in all cases, and stratified as 5 and 10 mm for analysis, as established in other studies with the same cohort5, 6 and according to the AJCC cancer staging manual recommendation for Oral Cavity Carcinoma (OCC). Extranodal Extension (ENE) was considered in a metastatic lymph node when extent of the metastatic carcinoma was observed through the capsule into the surrounding connective tissue.4
Tumors were also staged radiologically (T and N radiologic staging) from a pioneering extrapolation of the pathological criteria of ENE and DOI, using a CT study with intravenous contrast (Fig. 1).Fig. 1. Demonstration of the method used to measure tumor thickness and depth of invasion by computed tomography (coronal images) proposed by the AJCC Cancer Staging System. (A) Demonstration of the method used to measure tumor thickness: measurement used in the old version of TNM classification for oral cavity cancers (7th edition); (B) Demonstration of the method used to measure the depth of invasion (extrapolation of the standardized method in anatomopathological samples by AJCC described at the new TNM ‒ 8th edition). The measurement is based on the conic format of the tongue; (C) An imaginary line is drawn between the two edges of the intact mucosa; (D) Another line is drawn from the point of greatest invasion to the first line, taking as reference the central point of the tongue, the latter, then, will be the measure of depth of invasion).Fig. 1
For the T-stage, the lesion is initially identified, which usually presents greater enhancement than normal peripheral tissue, and then its depth is dimensioned. Measurement is based on the conic format of the tongue, and depth is measured from an imaginary line drawn at the level of the nearest intact squamous mucosa to the point of greatest invasion, a line guided by the cone radius.
Classification of the T-image was analyzed with extrapolation of the pathological DOI model (measured from the outer-line level of the nearest adjacent normal mucosa), using contrast-enhanced CT.
For the N stage, characteristics of extracapsular spread, such as infiltration of adjacent fatty and muscular planes and irregularity of the capsular contour are considered.
Statistical analysis
Values obtained through the study of each quantitative variable were organized and described as mean, standard deviation, and minimum and maximum. Absolute and relative frequencies were used for analysis of the qualitative variables. Frequency comparisons were performed using the Chi-Squared or Fisher’s Exact tests. Variables were classified as parametric by the Kolmogorov-Smirnov test and correlations between the independent quantitative variables were determined by the Pearson’s correlation test. The SPSS 17.0 (SPSS Inc; Ilinois, USA) software was used to process the data. A significance level of 5% (p ≤ 0.05) was adopted for all statistical analyses.
Results
The sample was composed of 80 patients with Squamous Cell Carcinoma (SCC) of the tongue and floor of mouth at stages such as T1 or T2 according to the AJCC Cancer Staging System manual ‒ 7^th^ edition.7 The sample preferably included male individuals, smokers and alcoholics, aged approximately 60–80 years (Table 1).Table 1. Descriptive data of the study sample.Table 1. VariablesResultsDemographic dataMale gender62 (77.5%)Age (in years)60.0 ± 10.3 (34–87)Subsite of primary lesionOral tongue45 (56.2%)Floor of mouth35 (43.8%)Smoking70 (87.5%)Alcohol abuse56 (70.0%)Anatomopathological dataFree resection margins78 (97.5%)Degree of differentiationWell differentiated28 (35.0%)Moderately differentiated49 (61.3%)Poor differentiated3 (3.8%)Perineural invasion31 (38.8%)Angiolymphatic invasion13 (16.3%)Tumor sizea23.2 ± 12.3 (1–67) mmTumor thicknessa11.4 ± 8.5 (1–39) mmDepth of invasiona11.3 ± 8.4 (1–39) mmLymph node metastases33 (41.3%)Extracapsular spread (n = 25)12 (48.0%)aMean ± Standard deviation (minimum–maximum).
Staging of all patients was reviewed according to the guidelines of the AJCC Cancer Staging System ‒ 8th edition.1 Tumor thickness and Depth of Invasion (DOI) were tomographically measured and histologically revised. Results were as follows: mean tomographic tumor thickness of 13.1 ± 7.0 (minimum of 3 and maximum of 35 mm) and DOI of 11.5 ± 5.7 (minimum of 3 and maximum of 27 mm). Strong positive correlation was found between tumor thickness and tomographic DOI (r = 0.905; p < 0.001 ‒ Pearson’s correlation test) and between tumor thickness and pathological DOI (r = 0.998; p < 0.001 ‒ Pearson’s correlation test). Moderate positive correlation was also observed between tomographic tumor thickness and pathological tumor thickness (r = 0.703; p < 0.001 ‒ Pearson’s correlation test) and between tomographic DOI and pathological DOI (r = 0.693; p < 0.001 ‒ Pearson’s correlation test). Fig. 2 shows the scatter plots between the referred correlations. It is worth mentioning that, if pathological tumor thickness were used as a parameter for the new staging instead of DOI, as suggested in the new AJCC manual, only four (5.0%) patients would have been incorrectly classified, which is justified by the high correlation between the two measures (Fig. 2B); however, this rate would have been 15% (12 cases) if both measurements were performed through CT.Fig. 2. Scatter plots for correlation: (A) Strong positive correlation between tumor thickness and tomographic depth of invasion (r = 0.905; p < 0.001 ‒ Pearson’s correlation test); (B) Positive correlation between tomographic tumor thickness and pathological tumor thickness (r = 0.703; p < 0.001 ‒ Pearson’s correlation test); (C) positive correlation between tomographic depth of invasion and pathological depth of invasion (r = 0.693; p < 0.001 ‒ Pearson’s correlation test).Fig. 2
T-clinical stages were then compared between the two editions of the AJCC Cancer Staging System manual (Table 2). Fifty-two patients (65.0%) received upstaging when tomographic DOI was added to the T-classification.Table 2. Comparison between the T-clinical stages.Table 2T Classification (AJCC Cancer Staging System ‒ 8th edition)TotalT1T2T3T4aT classification (AJCC 8th edition)T15 (23.8%)11 (52.4%)5 (23.8%)0 (0.0%)21 (26.3%)T21 (1.7%)23 (39.0%)35 (59.3%)0 (0.0%)59 (73.8%)Total4 (5.0%)34 (42.5%)42 (52.5%)0 (0.0%)80 (100.0%)Note: The main groups that received upstaging are shown in bold; p = 0.023 (Chi-Squared test).
Coincidence between the new clinical classification and the pathological stage was 52.5%, or 42 cases (Table 3), especially in T3 cases.Table 3. Comparison between the T-clinical and pathological stages.Table 3pT Classification (AJCC Cancer Staging System ‒ 8th edition)TotalpT1pT2pT3pT4aT classification (AJCC 8th edition)T14 (66.7%)2 (33.3%)0 (0.0%)0 (0.0%)6 (7.5%)T213 (38.2%)12 (35.3%)9 (26.5%)0 (0.0%)34 (42.5%)T31 (2.5%)11 (27.5%)**28 (70.0%)**0 (0.0%)40 (50.0%)Total18 (22.5%)25 (31.3%)37 (46.3%)0 (0.0%)80 (100.0%)Note: The main group of coincidence between the two classifications is shown in bold; p = 0.001 (Chi-Squared test).
N-clinical stages were also compared between the two editions of the AJCC Cancer Staging System manual (Table 4). Eleven (13.8%) patients received upstaging when signs of extracapsular spread were evidenced by CT. Coincidence between the new clinical classification and the pathological stage was 55.5%, or 44 cases (Table 5), especially in N0 and N3b cases. Nevertheless, no statistically significant difference was found between the tomographic evidence of extracapsular spread to CT and the definitive anatomopathological examination (28.6% of extracapsular spread in patients without this characteristic to CT vs. 58.3% for those with signs of extracapsular spread to image examination; p = 0.142 ‒ Fisher’s exact test).Table 4. Comparison between the N-clinical stages.Table 4N Classification (AJCC Cancer Staging System ‒ 8th edition)TotalN0N1N2aN2bN2cN3aN3bN Classification (AJCC 7th edition)N046 (100.0%)0 (0.0%)0 (0.0%)0 (0.0%)0 (0.0%)0 (0.0%)0 (0.0%)46 (57.5%)N10 (0.0%)15 (88.2%)**2 (11.8%)**0 (0.0%)0 (0.0%)0 (0.0%)0 (0.0%)17 (21.3%)N2a0 (0.0%)0 (0.0%)1 (100.0%)0 (0.0%)0 (0.0%)0 (0.0%)0 (0.0%)1 (1.3%)N2b0 (0.0%)0 (0.0%)0 (0.0%)4 (40.0%)0 (0.0%)0 (0.0%)**6 (60.0%)**10 (12.5%)N2c0 (0.0%)0 (0.0%)0 (0.0%)0 (0.0%)3 (50.0%)0 (0.0%)**3 (50.0%)6 (7.5%)Total46 (57.5%)15 (18.8%)3 (3.8%)4 (5.0%)3 (3.8%)0 (0.0%)9 (11.3%)80 (100.0%)Note: The main groups that received upstaging are shown in bold; p < 0.001 (Chi-Squared test).Table 5. Comparison between the N-clinical and pathological stages.Table 5N Classification (AJCC Cancer Staging System ‒ 8^th^ edition)TotalN0N1N2aN2bN2cN3aN3bN Classification (AJCC 7th edition)N037 (80.4%)**2 (4.3%)1 (2.2%)4 (8.7%)1 (2.2%)0 (0.0%)1 (2.2%)46 (57.5%)N18 (53.3%)2 (13.3%)2 (13.3%)1 (6.7%)1 (6.7%)0 (0.0%)1 (6.7%)15 (18.8%)N2a0 (0.0%)1 (33.3%)0 (0.0%)0 (0.0%)0 (0.0%)0 (0.0%)2 (66.7%)3 (3.8%)N2b1 (25.0%)0 (0.0%)0 (0.0%)1 (25.0%)0 (0.0%)0 (0.0%)2 (50.0%)4 (5.0%)N2c1 (33.3%)0 (0.0%)0 (0.0%)1 (33.3%)1 (33.3%)0 (0.0%)0 (0.0%)3 (3.8%)N3a0 (0.0%)0 (0.0%)0 (0.0%)0 (0.0%)0 (0.0%)0 (0.0%)0 (0.0%)0 (0.0%)N3b0 (0.0%)0 (0.0%)1 (11.1%)2 (22.2%)2 (22.2%)0 (0.0%)**4 (44.4%)**9 (11.3%)Total47 (58.8%)5 (6.3%)4 (5.0%)9 (11.3%)5 (6.3%)0 (0.0%)10 (12.5%)80 (100.0%)Note: The main group of coincidence between the two classifications is shown in bold; p < 0.001 (Chi-Squared test).
Discussion
Since its first publication in 1977, the Tumor, Nodule, and Metastasis (TNM) staging of Squamous Cell Carcinoma (SCC) of the oral cavity, through the AJCC Cancer Staging System manuals, has remained essentially the same.8
Given the simplicity of the existing AJCC manuals, this system has offered clinical accessibility for estimating patient survival. However, several studies have demonstrated that only TNM staging is insufficient to determine disease prognosis in many cases. Thus, other clinical, anatomopathological and molecular characteristics have shown association with prognosis in several studies. Consequently, new factors have been added to this classification aiming at greater prediction of outcomes.
Depth of invasion is a well-established parameter in the AJCC Cancer Staging System for other types of malignant neoplasms, such as melanoma, cutaneous squamous cell carcinoma, and mucosal malignancies of the cervix, esophagus, stomach and colon. Several research groups have suggested including DOI in oral cavity cancer classification, which was implemented at the end of 2016 with the publication of the 8th edition of the AJCC Cancer Staging System manual. In addition, DOI is a well-established parameter of recurrence and survival for this type of cancer.6, 9, 10
It is also known that Computed Tomography (CT) and Magnetic Resonance Imaging (MRI) are the most significant imaging methods in preoperative staging of head and neck tumors because they provide information on lesion extension, infiltration of large vessels, and lymph node metastasis, thus facilitating the planning and prognosis of treatment.11, 12, 13
The present study evaluated and compared staging of SCC of the oral cavity using the T and N classifications of the 7th and 8th editions of the AJCC Cancer Staging System manual through CT (T and N), and then compared the results with those of the new pathological stages (pT and pN) of these same editions ‒ a pioneering study in this field.
Strong positive correlation was found between tumor thickness and DOI in both tomography and pathology, justified by the overlapping of thickness and depth measurements (identical in most cases).
Considerable upstaging was observed in the sample of patients investigated, which can be justified by the greater sensitivity of the values adopted in the new T-staging, whose cut-off point between a T1 tumor and a T2 tumor was 2.0 cm (regarding thickness) and 0.5 cm (with respect to depth). Of the 21 patients classified as T1 at the TNM-7, 16 (76.2%) received upstaging at the TNM-8, representing the group with the highest divergence between the editions.
In the comparison between tomographic and pathological T-staging, moderate correlation was observed in both tumor thickness and depth.
Upstaging in the study sample was more evident in the clinical assessment compared with that in the pathological analysis, raising a question about the difficulty in measuring the tomographic examination and the reduction of thickness and DOI during histological processing.
The difficulties encountered in the evaluation of tomographic T-stage were associated with very early lesions ‒ often dependent on previous clinical evaluation to guide the identification in the images; with densification of the adipose/locoregional inflammatory reaction, that overestimated the measurements; and with occurrence of beam-hardening artifacts. The latter are generated close to high density bodies (such as dental metal implants, intraradicular nuclei, and crowns), which are quite prevalent in the general population, as well as in the sample investigated.14
Conclusion
Regardless of the new evaluation criteria, Computed Tomography (CT) with venous contrast can be used to guide initial staging and treatment in oral cavity cancers. However, further studies are necessary to determine the values of tomographic depth of invasion equivalent to the pathological sections already studied and now incorporated into the AJCC Cancer Staging System ‒ 8th edition.
Financial support
None.
Declaration of competing interest
The authors declare no conflicts of interest.
The reference list from the paper itself. Each links out to its DOI / PubMed record.
- 1Amin M.B.Edge S.Greene F.Byrd D.R.Brookland R.K.Washington M.K.AJCC cancer staging manual 8th ed.2017 Springer Chicago 10.1007/978-3-319-40618-3 · doi ↗
- 2Lydiatt W.M.Patel S.G.O’Sullivan B.Head and neck cancers-major changes in the American Joint Committee on cancer eighth edition cancer staging manual CA Cancer J Clin 6720171221372812884810.3322/caac.21389 · doi ↗ · pubmed ↗
- 3Ebrahimi A.Gil Z.Amit M.Primary tumor staging for oral cancer and a proposed modification incorporating depth of invasion JAMA Otolaryngol Head Neck Surg 1402014113811482507571210.1001/jamaoto.2014.1548 · doi ↗ · pubmed ↗
- 4Mermod M.Tolstonog G.Simon C.Monnier Y.Extracapsular spread in head and neck squamous cell carcinoma: a systematic review and meta-analysis Oral Oncol 62201660712786537310.1016/j.oraloncology.2016.10.003 · doi ↗ · pubmed ↗
- 5Matos L.L.Manfro G.Santos R.V.Tumor thickness as a predictive factor of lymph node metastasis and disease recurrence in T 1N 0 and T 2N 0 squamous cell carcinoma of the oral tongue Oral Surg Oral Med Oral Pathol Oral Radiol 11820142092172490694610.1016/j.oooo.2014.03.023 · doi ↗ · pubmed ↗
- 6Pinto F.R.de Matos L.L.Palermo F.C.Tumor thickness as an independent risk factor of early recurrence in oral cavity squamous cell carcinoma Eur Arch Otorhinolaryngol 2712014174717542407185810.1007/s 00405-013-2704-9 · doi ↗ · pubmed ↗
- 7Edge S.B.Byrd D.R.Compton C.C.Fritz A.Greene F.L.Trotti A.AJCC cancer staging manual 7th ed.2010 Springer Verlag New York
- 8American Joint Committee on Cancer Manual for staging of cancer 1977 American Joint Committee Chicago