Occupational differences in COVID-19 hospital admission and mortality risks between women and men in Scotland: a population-based study using linked administrative data
Serena Pattaro, Nick Bailey, Chris Dibben

TL;DR
This study shows that men and women in different jobs in Scotland had varying risks of hospitalization and death from COVID-19, highlighting the need for sex-specific interventions.
Contribution
The study reveals sex-specific occupational differences in COVID-19 risks using linked administrative data in Scotland.
Findings
Women had lower age-standardised hospital admission and mortality rates than men.
Men in large vehicle and taxi driving roles had higher adjusted admission and death risks.
Women in customer service and process roles had elevated admission risks.
Abstract
Occupations vary with respect to workplace factors that influence exposure to COVID-19, such as ventilation, social contacts and protective equipment. Variations between women and men may arise because they have different occupational roles or behavioural responses. We estimated occupational differences in COVID-19 hospital admission and mortality risks by sex. We combined (1) individual-level data from 2011 Census with (2) health records and (3) household-level information from residential identifiers, using a Scottish cohort of 1.7 million adults aged 40–64 years between 1 March 2020 and 31 January 2021. We estimated age-standardised COVID-19 hospital admission and mortality rates, stratified by sex and occupation. Cox proportional hazards models were adjusted for pre-pandemic health and occupational exposure factors, including interaction effects between occupation and sex. Women…
Genes, proteins, chemicals, diseases, species, mutations and cell lines named across the full text — each resolved to its canonical identifier and authoritative record.
Click any figure to enlarge with its caption.
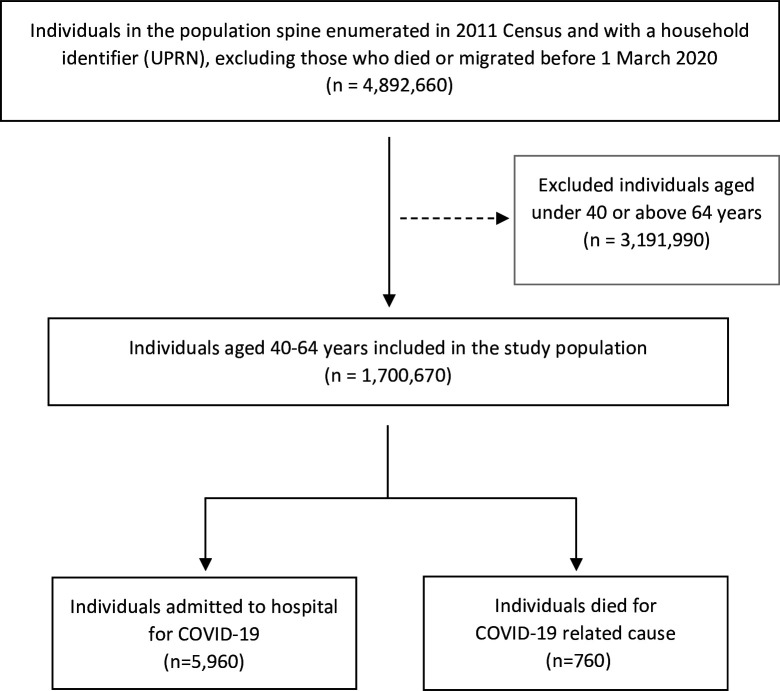 Figure 1
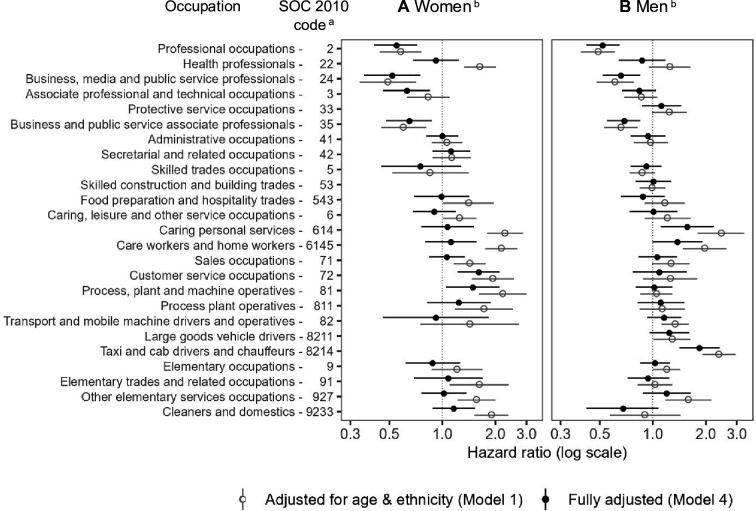 Figure 2
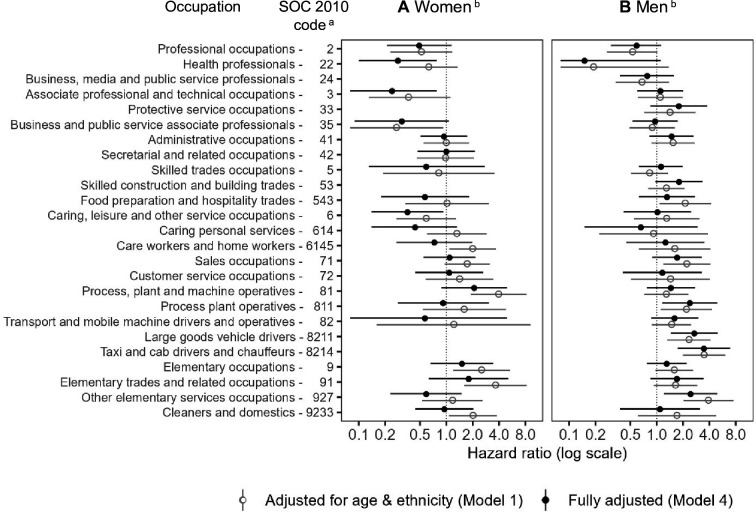 Figure 3
| Characteristics | Population | COVID-19 hospital admissions | COVID-19 deaths | |||
|---|---|---|---|---|---|---|
| N | % | n | % | n | % | |
| Sex | ||||||
| Women | 859 800 | 50.56 | 2820 | 47.32 | 300 | 39.47 |
| Men | 840 870 | 49.44 | 3140 | 52.68 | 460 | 60.53 |
| Age (years) | 52.40 | 7.00 | 54.70 | 6.40 | 57.20 | 5.80 |
| Ethnicity | ||||||
| Non-white | 195 810 | 11.51 | 770 | 12.92 | 90 | 11.84 |
| White | 1 504 860 | 88.49 | 5190 | 87.08 | 670 | 88.16 |
| Occupation (SOC 2010 codes) | ||||||
| 1 - Managers, directors and senior officials | 136 730 | 8.04 | 460 | 7.72 | 50 | 6.58 |
| 2 - Professional occupations | 118 250 | 6.95 | 190 | 3.19 | 20 | 2.63 |
| 22 - Health professionals | 74 150 | 4.36 | 310 | 5.20 | 10 | 1.32 |
| 24 - Business, media and public service professionals | 65 340 | 3.84 | 120 | 2.01 | 10 | 1.32 |
| 3 - Associate professional and technical occupations | 76 370 | 4.49 | 190 | 3.19 | 20 | 2.63 |
| 33 - Protective service occupations | 26 910 | 1.58 | 100 | 1.68 | 10 | 1.32 |
| 35 - Business and public service associate professionals | 88 630 | 5.21 | 170 | 2.85 | 20 | 2.63 |
| 41 - Administrative occupations | 138 500 | 8.14 | 390 | 6.54 | 50 | 6.58 |
| 42 - Secretarial and related occupations | 40 180 | 2.36 | 120 | 2.01 | 10 | 1.32 |
| 5 - Skilled trades occupations | 90 400 | 5.32 | 290 | 4.87 | 30 | 3.95 |
| 53 - Skilled construction and building trades | 60 580 | 3.56 | 220 | 3.69 | 30 | 3.95 |
| 543 - Food preparation and hospitality trades | 29 060 | 1.71 | 110 | 1.85 | 20 | 2.63 |
| 6 - Caring, leisure and other service occupations | 70 140 | 4.12 | 230 | 3.86 | 20 | 2.63 |
| 614 - Caring personal services | 28 470 | 1.67 | 180 | 3.02 | 10 | 1.32 |
| 6145 - Care workers and home workers | 52 310 | 3.08 | 300 | 5.03 | 30 | 3.95 |
| 71 - Sales occupations | 87 000 | 5.12 | 320 | 5.37 | 50 | 6.58 |
| 72 - Customer service occupations | 26 820 | 1.58 | 120 | 2.01 | 10 | 1.32 |
| 81 - Process, plant and machine operatives | 41 230 | 2.42 | 180 | 3.02 | 30 | 3.95 |
| 811 - Process plant operatives | 19 940 | 1.17 | 90 | 1.51 | 20 | 2.63 |
| 82 - Transport and mobile machine drivers and operatives | 40 830 | 2.40 | 210 | 3.52 | 30 | 3.95 |
| 8211 - Large goods vehicle drivers | 17 040 | 1.00 | 90 | 1.51 | 20 | 2.63 |
| 8214 - Taxi and cab drivers and chauffeurs | 12 170 | 0.72 | 110 | 1.85 | 20 | 2.63 |
| 9 - Elementary occupations | 59 540 | 3.50 | 240 | 4.03 | 40 | 5.26 |
| 91 - Elementary trades and related occupations | 34 600 | 2.03 | 130 | 2.18 | 30 | 3.95 |
| 927 - Other elementary service occupations | 38 440 | 2.26 | 160 | 2.68 | 20 | 2.63 |
| 9233 - Cleaners and domestics | 41 680 | 2.45 | 200 | 3.36 | 30 | 3.95 |
| No code required | 185 360 | 10.90 | 730 | 12.25 | 120 | 15.79 |
| Housing tenure | ||||||
| Owned outright | 226 160 | 13.30 | 600 | 10.07 | 80 | 10.53 |
| Owned with mortgage | 897 530 | 52.78 | 2960 | 49.66 | 300 | 39.47 |
| Social rented | 282 060 | 16.59 | 1520 | 25.50 | 260 | 34.21 |
| Private rented | 138 700 | 8.16 | 380 | 6.38 | 50 | 6.58 |
| Owned/not known | 156 220 | 9.19 | 500 | 8.39 | 70 | 9.21 |
| Household size | ||||||
| 1–2 people | 779 040 | 45.81 | 2860 | 47.99 | 420 | 55.26 |
| 3–4 people | 720 230 | 42.35 | 2310 | 38.76 | 220 | 28.95 |
| 5–6 people | 160 170 | 9.42 | 540 | 9.06 | 40 | 5.26 |
| 7+people | 41 230 | 2.42 | 250 | 4.19 | 80 | 10.53 |
| Household with children | ||||||
| No children | 1 300 090 | 76.45 | 4920 | 82.55 | 690 | 90.79 |
| At least one child 0–11 years | 187 120 | 11.00 | 440 | 7.38 | 30 | 3.95 |
| At least one child 12–17 years | 213 460 | 12.55 | 600 | 10.07 | 40 | 5.26 |
| Whether multigenerational household | ||||||
| Yes | 141 970 | 8.35 | 530 | 8.89 | 640 | 84.21 |
| No | 1 558 700 | 91.65 | 5430 | 91.11 | 120 | 15.79 |
| Occupational exposure measures | ||||||
| Exposure to disease | 0.30 | 0.30 | 0.30 | 0.30 | 0.30 | 0.30 |
| Proximity to others | 0.60 | 0.20 | 0.60 | 0.30 | 0.50 | 0.30 |
| Environmentally controlled indoor conditions | 0.70 | 0.30 | 0.60 | 0.30 | 0.60 | 0.30 |
| Learning disability or difficulty | ||||||
| Yes | 31 770 | 1.87 | 210 | 3.52 | 50 | 6.58 |
| No | 1 518 930 | 89.31 | 5310 | 89.09 | 660 | 86.84 |
| Not known | 149 970 | 8.82 | 440 | 7.38 | 50 | 6.58 |
| Whether shielding | ||||||
| Yes | 39 100 | 2.30 | 630 | 10.57 | 150 | 19.74 |
| No | 1 661 570 | 97.70 | 5330 | 89.43 | 610 | 80.26 |
| Pre-pandemic health conditions | ||||||
| Cancer and immunosuppression | ||||||
| Yes | 23 960 | 1.41 | 190 | 3.19 | 30 | 3.95 |
| No | 1 676 710 | 98.59 | 5770 | 96.81 | 730 | 96.05 |
| Cardiovascular conditions | ||||||
| Yes | 118 880 | 6.99 | 960 | 16.11 | 190 | 25.00 |
| No | 1 581 790 | 93.01 | 5000 | 83.89 | 570 | 75.00 |
| Diabetes | ||||||
| Yes | 104 150 | 6.12 | 1130 | 18.96 | 200 | 26.32 |
| No | 1 596 520 | 93.88 | 4830 | 81.04 | 560 | 73.68 |
| Hypertension | ||||||
| Yes | 241 210 | 14.18 | 1590 | 26.68 | 230 | 30.26 |
| No | 1 459 460 | 85.82 | 4370 | 73.32 | 530 | 69.74 |
| Respiratory conditions | ||||||
| Yes | 246 490 | 14.49 | 1420 | 23.83 | 210 | 27.63 |
| No | 1 454 180 | 85.51 | 4540 | 76.17 | 550 | 72.37 |
| Other conditions | ||||||
| Yes | 308 710 | 18.15 | 1650 | 27.68 | 270 | 35.53 |
| No | 1 391 960 | 81.85 | 4310 | 72.32 | 490 | 64.47 |
| SOC2010 | Occupation | COVID-19 hospital admissions | COVID-19 deaths | ||
|---|---|---|---|---|---|
| Women (n=2820) | Men (n=3140) | Women (n=300) | Men (n=460) | ||
| Code | ASR (95% CI) | ASR (95% CI) | ASR (95% CI) | ASR (95% CI) | |
| 1 | Managers, directors and senior officials | 255.6 (214.2 to 302.6) | 382.6 (340.5 to 428.3) | 29.4 (16.8 to 47.9) | 40.8 (28.2 to 57.1) |
| 2 | Professional occupations | 150.9 (120.4 to 186.8) | 190.4 (155.7 to 230.6) | 15.4 (7.0 to 29.3) | 21.1 (10.9 to 36.8) |
| 22 | Health professionals | 433.9 (380.8 to 492.2) | 511.6 (392.8 to 654.7) | 19.5 (9.7 to 34.9) | 8.8 (0.2 to 48.8) |
| 24 | Business, media and public service professionals | 130.8 (91.0 to 182.2) | 238.0 (188.6 to 296.2) | – | 28.4 (13.6 to 52.4) |
| 3 | Associate professional and technical occupations | 218.6 (172.6 to 272.9) | 325.0 (268.7 to 389.5) | 10.5 (2.9 to 26.9) | 43.7 (25.0 to 71.0) |
| 33 | Protective service occupations | – | 457.6 (368.3 to 561.8) | – | 51.6 (25.4 to 92.9) |
| 35 | Business and public service associate professionals | 161.9 (123.9 to 207.9) | 252.2 (206.9 to 304.4) | 7.9 (1.6 to 23.1) | 35.9 (20.5 to 58.4) |
| 41 | Administrative occupations | 277.8 (246.5 to 311.9) | 371.4 (302.4 to 451.4) | 30.2 (20.7 to 42.5) | 62.6 (37.0 to 99.1) |
| 42 | Secretarial and related occupations | 303.0 (247.8 to 366.4) | – | 29.5 (14.7 to 52.4) | – |
| 5 | Skilled trades occupations | 226.1 (127.2 to 368.6) | 327.1 (288.7 to 369.2) | 34.8 (1.8 to 132.8) | 33.0 (22.1 to 47.4) |
| 53 | Skilled construction and building trades | – | 369.8 (322.0 to 422.6) | – | 52.4 (35.7 to 74.1) |
| 543 | Food preparation and hospitality trades | 346.2 (251.9 to 463.7) | 451.7 (349.8 to 573.9) | 28.0 (7.6 to 71.7) | 76.4 (38.0 to 137.0) |
| 6 | Caring, leisure and other service occupations | 327.7 (281.8 to 378.9) | 472.9 (345.9 to 630.5) | 18.8 (8.9 to 34.7) | 64.5 (22.7 to 142.4) |
| 614 | Caring personal services | 599.7 (499.0 to 714.1) | 916.2 (663.0 to 1231.7) | 42.4 (19.1 to 79.9) | 45.1 (3.9 to 167.6) |
| 6145 | Care workers and home workers | 566.4 (494.9 to 645.0) | 736.1 (553.3 to 959.2) | 60.5 (39.6 to 88.3) | 59.9 (19.5 to 139.8) |
| 71 | Sales occupations | 365.3 (320.3 to 414.8) | 477.6 (378.9 to 593.9) | 50.9 (35.4 to 70.8) | 84.8 (46.2 to 142.4) |
| 72 | Customer service occupations | 499.9 (398.6 to 619.0) | 457.8 (315.9 to 641.1) | 41.3 (16.6 to 85.2) | 54.3 (14.7 to 139.4) |
| 81 | Process, plant and machine operatives | 576.8 (426.9 to 759.7) | 392.2 (324.7 to 469.4) | 108.6 (57.6 to 186.2) | 54.4 (31.4 to 87.6) |
| 811 | Process plant operatives | 440.3 (299.2 to 622.6) | 411.6 (305.6 to 542.3) | 40.9 (11.1 to 104.9) | 84.4 (42.1 to 151.2) |
| 82 | Transport and mobile machine drivers and operatives | 336.3 (159.5 to 621.4) | 498.4 (428.8 to 575.9) | 31.3 (0.8 to 174.2) | 60.8 (38.8 to 90.5) |
| 8211 | Large goods vehicle drivers | – | 501.2 (392.5 to 628.9) | – | 95.7 (56.2 to 151.9) |
| 8214 | Taxi and cab drivers and chauffeurs | – | 949.8 (763.8 to 1164.6) | – | 132.9 (79.4 to 208.5) |
| 9 | Elementary occupations | 310.7 (225.4 to 416.7) | 441.5 (381.1 to 508.6) | 77.0 (39.3 to 135.3) | 64.2 (42.9 to 92.3) |
| 91 | Elementary trades and related occupations | 418.8 (282.1 to 596.9) | 377.2 (306.4 to 459.3) | 127.6 (55.6 to 246.7) | 67.2 (39.7 to 106.3) |
| 927 | Other elementary service occupations | 403.3 (331.9 to 485.5) | 605.7 (447.6 to 801.4) | 33.5 (16.1 to 61.7) | 149.0 (76.8 to 260.4) |
| 9233 | Cleaners and domestics | 452.4 (385.8 to 526.9) | 342.9 (205.2 to 537.2) | 56.9 (36.3 to 85.0) | 74.1 (19.7 to 190.9) |
- —http://dx.doi.org/10.13039/501100000269Economic and Social Research Council
- —http://dx.doi.org/10.13039/501100000265Medical Research Council
Peer Reviews
No public reviews on file for this paper yet. If you reviewed it on a platform where reviews are public (OpenReview, ICLR, NeurIPS, ICML), you can paste yours below so the community can read it here.
Videos
No videos yet. Explain this paper in a talk, walkthrough, or lecture? Add one.
Taxonomy
TopicsCOVID-19 and healthcare impacts · Employment and Welfare Studies · Climate Change and Health Impacts
Introduction
The COVID-19 pandemic had unequal effects on working-age women and men, with higher rates of severe COVID-19 outcomes, including hospitalisation and mortality, among men.1 While infection rates were elevated among working-age women compared with those younger or retired,2 3 women, in contrast to men, appeared relatively protected from adverse health consequences, potentially due to differing biological responses.4 5
Aside from biological factors, socioeconomic and behavioural characteristics probably contributed to the unequal distribution of severe COVID-19 outcomes between women and men, with occupation and workplace settings playing crucial roles in exposure and transmission.6 Key occupational factors influencing exposure include contact frequency, physical proximity, work environment and access to protective equipment.7 Women often occupy contact-intensive roles, notably in the service sector, such as healthcare, food preparation and education,8 where essential and/or frontline occupations are overrepresented.9 Men are more prevalent in less contact-intensive roles in the construction and manufacturing sectors.8 Workplace contacts were linked to increased COVID-19 infection risks in healthcare and trade, process and plant professions, often operating in poorly ventilated workplaces, emphasising the occupational influence on viral exposure.10
Certain occupational groups faced not only higher exposure risks but also increased adverse outcomes. Studies in the UK found elevated COVID-19 mortality risks among male taxi drivers and female healthcare professionals,11 12 although risks in the latter group attenuated after the first pandemic wave.13 Similar results were reported for Scotland alone, indicating higher risks of hospitalisation and severe COVID-19 among healthcare workers and their households.14
Behavioural factors also contribute to occupational and sex/gender disparities in COVID-19 outcomes, with women displaying greater compliance with preventing measures, including hygiene practices, mask wearing and social distancing.15 Conversely, men tend to engage in high-risk and health-damaging behaviours in general,16 along with lower healthcare-seeking behaviours, both of which potentially result in worse outcomes in relation to COVID-19.17
Moreover, household circumstances and pre-existing health conditions intersect with occupational disparities, with low-paid, low-skilled workers facing higher exposure risks due to overcrowded accommodation, higher propensity to coreside with younger adults or children and higher levels of comorbidities.17 Conditions like cardiovascular disease, diabetes and respiratory problems heighten COVID-19 mortality risks,18 particularly among older adults from ethnic minority groups in multigenerational households.19
In this study, we leveraged a large Scottish data collection covering the period between 1 March 2020 and 31 January 2021. Using Cox proportional hazards models, we addressed the following research questions: (1) Does the association between occupation and COVID-19 hospital admission and mortality risks differ by sex? (2) Is this association explained by pre-pandemic health and occupational exposure factors?
Methods
Data and study population
We used a large data collection covering the Scottish population, combining the following:
Socioeconomic information from 2011 Census.Residential address identifiers from Ordnance Survey.Occupational exposure measures from the Occupational Information Network (O*NET) survey.Electronic health information on mortality, hospitalisation, laboratory testing and primary care records from Public Health Scotland’s (PHS) COVID-19 Research Database.20
The data collection is part of a wider project investigating social risk factors for COVID-19 in Scotland,21 originally established within the Scottish Data and Intelligence Network22 to inform the government’s response to the pandemic and now focused on long-term lessons.
The Scottish population spine encompasses all individuals registered with a GP practice, who received a unique Community Health Index (CHI) number. Our study focused on individuals present in the Scottish 2011 Census with records linkable to the population spine. The Census provided occupation information, which we used as a measure of likely occupation in 2020/2021. We excluded those who died or relocated from Scotland before 1 March 2020 (the date of the first COVID-19 case in Scotland). The population spine provided the latest address recorded by the General Practice. Address information was used to attach a household identifier, derived from Ordnance Survey’s Unique Property Reference Numbers (UPRNs), through an innovative residential linkage tool.23 Following subsequent linkage to electronic health records, data were available for 4.9 million people, representing approximately 90% of the Scottish population.24 The study population comprised individuals aged 40–64 years on 1 March 2020, resulting in a cohort of approximately 1.7 million individuals after exclusions (figure 1).
Flowchart representing the selection process for the study population. Reported figures are rounded to the nearest 10; UPRN, Unique Property Reference Number.
Outcomes
The outcomes of interest were time to first COVID-19 hospital admission and death. Hospital admission was identified using International Classification of Diseases 10th edition (ICD-10) codes for confirmed (U07.1) or suspected COVID-19 (U07.2) as primary or secondary causes, or admissions occurring within 14 days of a laboratory-confirmed COVID-19 infection. Death from COVID-19 was defined using ICD-10 codes for confirmed or suspected COVID-19 (primary or secondary cause) reported on death certificates and identified within 28 days of a laboratory-confirmed COVID-19 infection. These definitions align with those used in Scottish official statistics.25
Exposure
We constructed an occupational measure using the UK Standard Occupational Classification (SOC) 2010 reported in the 2011 Census,26 acknowledging that SOC classifications have changed over time. Based on SOC 2010, we identified 26 occupational groups ranging from major groups (1-digit codes) to more detailed unit groups (4-digit codes) (online supplemental table S1). This combination of occupational groups was selected to identify high-risk occupations related to COVID-19 that were of particular policy relevance. Where sufficient sample sizes were available, we identified groups such as taxi drivers and health professionals, as these were of particular interest based on prior studies,1114 with which we aimed to maintain comparability. Occupational groups with smaller sample sizes or lower policy relevance were aggregated to SOC codes of three digits or fewer. Groups were always exclusive. For example, professional occupations (SOC code: 2) included all lower level subgroups except for health professionals (SOC code: 22) and business, media and public service professionals (SOC code: 24) as these were included separately.
Some discrepancies may arise between the occupation reported in the 2011 Census and actual occupation in March 2020. Since both add noise to our measure, estimates of the relationships between occupation and COVID-19 risks should be regarded as lower limits. Note that individuals may have experienced job displacement during the COVID-19 pandemic; previous research indicated women experienced greater job losses than men.8 Using UK Household Longitudinal Study (UKHLS) data,27 we computed the proportion of women and men aged 40–64 years who retained the same occupation between 2011 and 2020 using major group occupations. For women, proportions varied between 40.8% among managers, directors and senior officials and 74.1% among workers in caring, leisure and other service occupations. For men, proportions varied between 38.8% among those in sales and customer service occupations and 72% among process, plant and machine operatives (online supplemental table S2). Despite limited disaggregation, these results suggest that occupational information in 2011 Census was relatively stable over time.
Covariates
Covariates encompassed factors potentially associated with both occupation and COVID-19 hospital admission and mortality risks (online supplemental table S3). Sociodemographic factors included age, sex (from CHI register) and ethnicity (2011 Census). Household-level factors included housing tenure (2011 Census), household size, presence of children and multigenerational household based on people’s age cohort (from UPRN-based household identifiers). Health-related factors included learning disability or learning difficulty (2011 Census) and shielding status due to underlying vulnerable conditions (PHS shielding patient list dataset) (online supplemental table S4). Shielding status was measured based on receipt of a National Health Service (NHS) letter asking individuals to shield, reflecting NHS selection criteria rather than individual behaviour. Pre-pandemic health conditions were derived from cluster variables based on Read codes recorded in primary care data (PHS COVID-19 Research Database). Cancer and immunosuppression, cardiovascular conditions, diabetes, hypertension, respiratory conditions and other conditions were considered factors likely to heighten severe COVID-19 risks18 28 (online supplemental table S5). Occupational exposure measures (frequency of exposure to disease/infection, physical proximity to others and frequency of working in environmentally-controlled indoor settings) were sourced from US survey data from O*NET29 and mapped onto UK SOC 2010 codes, via ISCO-08 codes, and standardised using Office for National Statistics procedures.30
Statistical analysis
We summarised the individual-level and household-level characteristics for the total population and for those who were first admitted to hospital and died of COVID-19. We reported baseline characteristics for covariates of interest using counts and percentages. Age-standardised COVID-19 hospital admission and mortality rates per 100 000 persons were calculated for each occupational group and annualised. Rates were estimated separately for women and men, using a direct method and the 2013 European Standard Population.31 CIs were calculated using Dobson et al’s method32 accounting for small number of events. Estimates were produced using the ‘distrate’ command33 34 in Stata/MP V.16 (StataCorp LP, College Station, Texas).
We modelled the time to COVID-19 hospital admission and death using Cox proportional hazards models. Analyses were conducted both through separate models for women and men, and through a combined model including an interaction between occupation and sex. While the interaction model helps determine whether interaction parameters are statistically significant, we relied on the separate models to estimate the magnitude of the association between occupation and COVID-19 outcomes within each sex group. We estimated a series of models, sequentially adjusting for potential confounders and mediators. Models 1–4 are estimated for each sex separately. Model 5 is estimated for both sexes together. Model 1 adjusted for sociodemographic factors, such as age and ethnicity, with occupation as the main exposure. A restricted cubic spline was used to model the non-linear association between age and COVID-19 outcomes. Model 2 additionally adjusted for household-level factors, including housing tenure, household size and composition, and whether the household was multigenerational. Model 3 additionally accounted for health-related factors, including learning disability/difficulty, shielding status and pre-pandemic health conditions. Model 4 added adjustments for occupational exposure measures, including exposure to disease, proximity to others and environmentally-controlled indoor conditions. This is referred to as the ‘fully adjusted model’. Model 5 has all the adjustments of Model 4 but uses data for both sexes and includes an interaction term between occupation and sex. The hypothesised relationships between the variables included in the models are illustrated in a causal diagram (online supplemental figure S1). We acknowledge that it is unclear from the available data whether some of the factors may act as confounders or mediators. Model fit was assessed using Akaike Information Criterion (AIC) and Bayesian Information Criterion (BIC) statistics and Likelihood Ratio (LR) tests. Analyses were conducted in the Scottish National Safe Haven using Stata/MP V.16 and R (V.3.6.1).
Results
The study encompassed 1 700 670 Scottish adults aged 40–64 years, observed between 1 March 2020 and 31 January 2021. The mean age at baseline was 52.4 years (SD 7.0), with 50.6% being women. Individuals were followed for 1 514 189 person-years until first COVID-19 hospital admission, 1 561 010 person-years until COVID-19 death or until the end of the follow-up period on 31 January 2021. Among 5960 COVID-19 admissions, the median follow-up was 232 days (95% CI 228 to 233), with admission events more likely to occur among men (52.7%) and older individuals (mean age 54.7 years (SD 6.4)). Among the 760 COVID-19 deaths, the median follow-up was 248 days (95% CI 237 to 253), with 460 deaths (60.5%) occurring among men and a mean age of 57.2 years (SD 5.8). Additional baseline characteristics are detailed in table 1.
Table 2 shows annualised age-standardised COVID-19 hospital admission and death rates for women and men aged 40–64 years. In general, women had lower age-standardised rates (ASRs) than men across both outcomes. For women, the highest ASRs for COVID-19 admissions were among those in caring personal services, including nursing assistants and ambulance staff (excluding paramedics), with 599.7 admissions (95% CI 499.0 to 714.1) per 100 000 persons, and process, plant and machine operatives (assemblers and sorters in the food and tobacco industry), with 576.8 admissions (95% CI 426.9 to 645.0). Men exhibited the highest ASRs for COVID-19 admissions among taxi and cab drivers (949.8 admissions per 100 000 persons, 95% CI 763.8 to 1164.6), workers in caring personal services (916.2 admissions per 100 000 persons, 95% CI 663.0 to 1231.7) and care workers and home workers (736.1 admissions per 100 000 persons, 95% CI 553.3 to 959.2). Professionals in science, research, engineering and technology as well as teaching and education reported the lowest (or second-lowest) rates for both women (150.9 admissions, 95% CI 120.4 to 186.8) and men (190.4 admissions, 95% CI 155.7 to 230.6).
COVID-19 mortality ASRs displayed a steeper occupational gradient compared with hospital admission ASRs. Among women, the highest ASR was among those in elementary trades and related occupations, such as packers and canners (127.6 COVID-19 deaths per 100 000 persons, 95% CI 55.6 to 246.7), while business and public service associate professionals, including those in the transport and legal administration sectors, had the lowest ASR (7.9 deaths per 100 000 persons, 95% CI 1.6 to 23.1). For men, the highest ASR was among those in other elementary service occupations, like kitchen assistants and waiters (149 deaths per 100 000 persons, 95% CI 76.8 to 260.4), while professionals had one of the lowest ASRs (21.1 deaths per 100 000 persons, 95% CI 10.9 to 36.8).
The relative difference in COVID-19 hospital admission risks between the occupational groups and managers, directors and senior officials (reference category) decreased after adjusting for confounding factors (figure 2; online supplemental tables S6 and S8 for full-model and interaction model details, respectively). However, for some occupational groups, risks remained significantly higher relative to the reference category. For example, in the fully-adjusted model, women in customer service occupations had a HR of 1.61 (95%CI 1.22 to 2.11) compared with 1.93 (95%CI 1.47 to 2.54) in the baseline model adjusting for age and ethnicity. An elevated risk also remained for process, plant and machine operatives (assemblers and sorters) (HR 1.49, 95% CI 1.05 to 2.11). Among men, elevated risks persisted for taxi and cab drivers (HR 1.84, 95% CI 1.42 to 2.40), those working in caring personal services (ambulance staff) (HR 1.57, 95% CI 1.11 to 2.22) and care and home workers (HR 1.38, 95% CI 1.00 to 1.91).
Hazard ratios for COVID-19 hospital admission for (A) women and (B) men aged 40–64 years in Scotland. aThe Standard Occupational Classification 2010 (SOC2010) is a nested classification. Where a higher-level code is indicated, this includes all lower-level subgroups except for the specific subgroups that are separately identified (eg, professional occupations (SOC code: 2) includes all lower-level subgroups except for health professionals (SOC code: 22) and business, media and public service professionals (SOC code: 24). bHazard ratios and 95% CIs are displayed on a logarithmic scale; Reference category: SOC code 1: managers, directors and senior officials; fully-adjusted model (Model 4) is coloured in black (solid circle) and appears above Model 1 (grey hollow circle) for each group; fully-adjusted model (Model 4, online supplemental table S6) additionally controls for: household-level factors (housing tenure, household size, household with children, whether multigenerational household), health-related factors (learning disability or difficulty, whether shielding and pre-pandemic health conditions), and occupational exposure measures (exposure to disease, proximity to others, environmentally-controlled indoor conditions); hospital admissions occurring between 1 March 2020 and 31 January 2021; data are not reported if there were less than 10 hospital admission events.
Lower COVID-19 admission risks were observed among less disadvantaged occupational groups after adjusting for household characteristics and pre-pandemic health conditions, for both women and men. For instance, professionals had an HR of 0.55 (95% CI 0.41 to 0.72) for women and 0.52 (95% CI 0.42 to 0.65) for men, compared with 0.58 (95% CI 0.44 to 0.76) and 0.49 (95% CI 0.39 to 0.61), respectively, in the baseline model. Similarly, professionals in business, media and public service had HRs of 0.52 (95% CI 0.36 to 0.75) for women and 0.66 (95% CI 0.52 to 0.85) for men, compared with 0.65 (95% CI 0.48 to 0.87) and 0.69 (95% CI 0.55 to 0.85), respectively.
Differences between women and men emerged regarding the risk of COVID-19 death by occupation (figure 3; online supplemental tables S7 and S8 for full model and interaction model details, respectively). Female health professionals (medical practitioners, nurses and pharmacists) had a lower death risk relative to the reference group (HR 0.28, 95% CI 0.10 to 0.78), as did women in associate professional and technical occupations (HR 0.24, 95% CI 0.07 to 0.78), for whom a significant difference relative to men was also observed in the interaction model (HR 0.23, 95% CI 0.08 to 0.70). Lower death risks relative to the reference group were observed for women among health and social care workers (HR 0.24, 95% CI 0.07 to 0.78), and in caring, leisure and other service occupations (childminders and nursery assistants) (HR 0.36, 95% CI 0.14 to 0.92). Conversely, men working as taxi and cab drivers (HR of 3.46, 95% CI 1.74 to 6.86) and large goods vehicle drivers (HR 2.69, 95% CI 1.45 to 4.99) exhibited increased COVID-19 death after adjusting for socioeconomic and health factors. Elevated risks were also shown for those in other elementary service occupations, including kitchen assistants and waiters (HR 2.44, 95% CI 1.21 to 4.91) and process plant operatives (HR 2.39, 95% CI 1.16 to 4.91).
Hazard ratios for COVID-19 death for (A) women and (B) men aged 40–64 years in Scotland. aThe Standard Occupational Classification 2010 (SOC2010) is a nested classification. Where a higher-level code is indicated, this includes all lower-level subgroups except for the specific subgroups that are separately identified (eg, professional occupations (SOC code: 2) includes all lower-level subgroups except for health professionals (SOC code: 22) and business, media and public service professionals (SOC code: 24). bHazard ratios and 95% CIs are displayed on a logarithmic scale; reference category: SOC code 1: managers, directors and senior officials; fully-adjusted model (Model 4) is coloured in black (solid circle) and appears above Model 1 (grey hollow circle) for each group; fully-adjusted model (Model 4, online supplemental table S7) additionally controls for: household-level factors (housing tenure, household size, household with children, whether multigenerational household), health-related factors (learning disability or difficulty, whether shielding and pre-pandemic health conditions) and occupational exposure measures (exposure to disease, proximity to others, environmentally-controlled indoor conditions); deaths occurring between 1 March 2020 and 31 January 2021; data are not reported if there were less than 10 deaths.
Discussion
Main results
Drawing on a large data collection, using Census, electronic health and residential data, we estimated COVID-19 hospital admission and mortality risks for different occupational groups in Scotland, focussing on women and men aged 40–64 years during the period between March 2020 and January 2021, predating the vaccination programme. Overall, women exhibited lower age-standardised COVID-19 admission and mortality rates. For both women and men, rates were largely consistent with an occupational gradient, with higher rates among more disadvantaged occupational groups, related to both COVID-19 admission and death risks. Notably, women in process, plant and machine operative roles (assemblers and sorters), along with elementary trades and related occupations (packers and canners) had the highest age-standardised mortality rates. Similarly, women in caring personal services (nursing assistants and ambulance staff) had elevated admission rates. Conversely, men in elementary services (kitchen assistants and waiters) and transportation roles, notably taxi and cab drivers, had the highest age-standardised mortality rates, with the latter group also having high admission rates. Similar trends were observed in previous studies, where higher mortality rates were found among women in process, plant and machine operative roles, while taxi and cab drivers were among the categories with the highest mortality rates among men.11 35
Adjusting for socioeconomic, pre-pandemic health and occupational exposure factors reduced the association between COVID-19 hospital admission and death risks for most occupational groups, compared with the baseline model adjusting for basic demographic factors. After adjustment, we generally observed a similar occupational gradient for COVID-19 admission risks for women and men. For COVID-19 mortality risks, an occupational gradient also persisted after adjustment showing lower risks among women in less disadvantaged occupational groups (health professionals, associate professional and technical occupations, including paramedics and medical technicians, with the latter supported by the interaction model results) and higher risks among men in more disadvantaged occupational groups (taxi and large vehicle drivers, other elementary service occupations, including kitchen assistants and waiters, and process plant operatives in the food, drink and tobacco industry). Although these results generally align with previous studies, our study contrasts with one from England, which observed elevated mortality risks among men in health professional occupations but not among women.11 In population-based studies that did not differentiate between women and men, healthcare professionals and associates showed higher proportionate mortality odds only during the first wave of the pandemic, but not in subsequent waves in England and Wales.13 Additionally, increased severe COVID-19 risks were reported among healthcare workers, relative to non-essential workers, in the general UK population.12 These discrepancies may reflect differences in access to protective equipment or adherence to preventive measures.
While household characteristics and pre-pandemic health and occupational exposure factors were important in our study in explaining the association between COVID-19 admission and death risks for women employed in the service and industrial sectors (care worker and home workers, and process, plant and machine operatives), they did not explain the elevated risks for men in more disadvantaged occupations. An alternative explanation could include a combination of behavioural factors (eg, compliance with guidance) and workplace-related factors (eg, contact density, ventilation, remote working and financial strain).
Strengths
To our knowledge, this is the first Scottish study to estimate COVID-19 hospital admission and mortality risks across occupational groups among women and men, adjusting for a range of confounders. First, covering a population of 1.7 million, our data collection was well-powered to assess the outcome of interest across occupational groups by sex. Our results are likely to be relevant for other parts of the UK and other countries. Previous studies examined these associations in national or subpopulations,12 14 35 while others reported only COVID-19 mortality risks.11 36 Second, leveraging Unique Property Reference Numbers (UPRNs), we derived a set of household-level covariates, improving on 2011 Census-based measures used in prior studies.11 19 Third, in our analysis, we adjusted for both pre-pandemic health measures—derived by combining Census and primary care records—and occupational exposure measures, including exposure to disease, proximity to other and environmentally-controlled indoor conditions. Adjusting for pre-pandemic health and occupational exposure factors was overlooked in previous research.12 13 35 37 38
Limitations
A limitation of this study lies in potential discrepancies from using 2011 Census occupational information, as people may not be employed in the same occupation in March 2020 and there may be subsequent changes during the pandemic. While this adds noise to our measure, so that estimates of the relationships between occupation and COVID-19 risks should be considered as lower bounds, we believe the bias is likely to be toward the null. As a mitigation, we focused on a less occupationally mobile age group, that is, those aged 40–64 years11. Corroborating this, we used UKHLS data showing relatively high proportions of men and women retaining the same occupation between 2011 and 2020, suggesting that the Census occupation information was sufficiently stable over time. Our study estimates are largely consistent with both official and other estimates from population-based studies using linked administrative data.1113 3537 The occupational classification approach used in our study differs from previous investigations using broader essential work clusters,13 37 as we think that women and men may differ in the position and roles within the same occupational cluster.
Another limitation is the potential bias in the way outcomes were ascertained. During the pandemic, certain occupations (eg, patient-facing or public-facing roles) were tested more frequently or had a higher likelihood of being tested due to the nature of their work. This may have influenced the outcomes related to hospital admissions within 14 days of a COVID-19 infection and suspected COVID-19 cases as well as subjective judgements regarding the cause of death reported on death certificates.
An additional limitation concerns the data linkage design. Our initial study population covers approximately 90% of the Scottish population. The data linkage relies on a population spine covering people who interacted with the health services, receiving a CHI number. The population spine may not cover some vulnerable groups (eg, refugees and migrants) that may be at increased risks of severe COVID-19. Potential bias may arise from the linkage being conditional on having a valid 2011 Census record or a matched key for a UPRN residential identifier.23 Misclassification may also arise due to errors in linked data and the data linkage process.39 We acknowledge these sources of bias, although their impact on estimates remains uncertain. Additionally, the relationship between occupation and COVID-19 outcomes has changed over the course of the pandemic.13 40 However, rare outcomes have limited the exploration of time-dependent differences as well as the evaluation of changing restriction policies across pandemic waves. Moreover, limitations in statistical power and precision may have affected the confidence intervals of the parameter estimates. In addition, some of our variables could theoretically act as either confounding or mediating factors. However, because they are only measured at a single point in time, it is not possible to determine their causal direction. As a result, caution is needed when interpreting the regression estimates. Future research should include additional background and workplace factors measured at multiple time points to support a formal mediation analysis and better assess the impact of occupation on COVID-19 outcomes attributable to pre-pandemic health and occupational exposure factors.
Policy implications
Occupational differences in COVID-19 hospital admission and mortality risks between women and men may be explained by social, workplace and behavioural factors. These need to be considered when developing tailored interventions to reduce sex/gender discrepancies in any future emerging respiratory epidemics. Addressing gaps in protective equipment and training provision between health professionals and care and home workers is vital if we want to address inequalities arising from pandemic policy responses. Coordinated interventions targeting high-risk occupational groups, working in transportation and service sectors are imperative to mitigate transmission risks effectively.
Supplementary material
10.1136/oemed-2024-109562online supplemental file 1
The reference list from the paper itself. Each links out to its DOI / PubMed record.
- 1Peckham H de Gruijter NM Raine C et al Male sex identified by global COVID-19 meta-analysis as a risk factor for death and ITU admission Nat Commun 202011631710.1038/s 41467-020-19741-633298944 PMC 7726563 · doi ↗ · pubmed ↗
- 2Doerre A Doblhammer G The influence of gender on COVID-19 infections and mortality in Germany: Insights from age- and gender-specific modeling of contact rates, infections, and deaths in the early phase of the pandemic P Lo S One 202217 e 026811910.1371/journal.pone.026811935522614 PMC 9075634 · doi ↗ · pubmed ↗
- 3Sobotka T Brzozowska Z Muttarak R et al Age, gender and covid-19 infections Public and Global Health Preprint 10.1101/2020.05.24.20111765 · doi ↗
- 4Scully EP Schumock G Fu M et al Sex and Gender Differences in Testing, Hospital Admission, Clinical Presentation, and Drivers of Severe Outcomes From COVID-19Open Forum Infect Dis 20218 ofab 44810.1093/ofid/ofab 44834584899 PMC 8465334 · doi ↗ · pubmed ↗
- 5Stalter RM Atluri V Xia F et al Elucidating Pathways Mediating the Relationship Between Male Sex and COVID-19 Severity Clin Epidemiol 2022141152510.2147/CLEP.S 33549435115840 PMC 8800564 · doi ↗ · pubmed ↗
- 6Hâncean M-G Lerner J Perc M et al Occupations and their impact on the spreading of COVID-19 in urban communities Sci Rep 2022121411510.1038/s 41598-022-18392-535982107 PMC 9387884 · doi ↗ · pubmed ↗
- 7Oude Hengel KM Burdorf A Pronk A et al Exposure to a SARS-Co V-2 infection at work: development of an international job exposure matrix (COVID-19-JEM) Scand J Work Environ Health 202248617010.5271/sjweh.399834788471 PMC 8729167 · doi ↗ · pubmed ↗
- 8Albanesi S Kim J Effects of the COVID-19 Recession on the US Labor Market: Occupation, Family, and Gender Journal of Economic Perspectives 20213532410.1257/jep.35.3.3 · doi ↗