Eco-physiological response of Phaeocystis antarctica and Fragilariopsis sp. to increases in irradiance and temperature
Antonia Cristi, Stacy Deppeler, Alexia Saint-Macary, Andrew Marriner, Mikel Latasa, Cliff S Law, Andrés Gutiérrez-Rodríguez

TL;DR
This study compares how two Southern Ocean phytoplankton species respond to increased light and temperature, finding that Phaeocystis antarctica may be more resilient to warming and high light conditions than previously thought.
Contribution
The study reveals new insights into the physiological responses of Phaeocystis antarctica and Fragilariopsis sp. to climate change conditions.
Findings
Phaeocystis antarctica showed increased colony to single-cell ratio under high light/high temperature conditions.
Fragilariopsis sp. cell size decreased under high light/high temperature but silica content remained unchanged.
Both species showed increased DMSPt:C and DMS:C ratios under high light/high temperature conditions.
Abstract
Phaeocystis antarctica and Fragilariopsis are key phytoplankton taxa in the Southern Ocean that have different bloom magnitude and phenology, reflecting their differing physiological traits. Here, we investigate the physiological response of Fragilariopsis sp. and colony-forming P. antarctica to warmer and high irradiance conditions using chemostat experiments under low light/low temperature (LL/LT) and high light/high temperature (HL/HT). C:N and C:Chla ratios increased under HL/HT in both species, whereas the Fragilariopsis sp. Si:C ratio showed no significant variation between treatments despite Si:N being 1.4-fold higher under HL/HT. The P. antarctica colony to a single-cell ratio exhibited a 2.3-fold increase under HL/HT but with no change in the size of individual cells. On the contrary, Fragilariopsis sp. cell size decreased 1.3-fold without affecting cellular silica content.…
Genes, proteins, chemicals, diseases, species, mutations and cell lines named across the full text — each resolved to its canonical identifier and authoritative record.
Click any figure to enlarge with its caption.
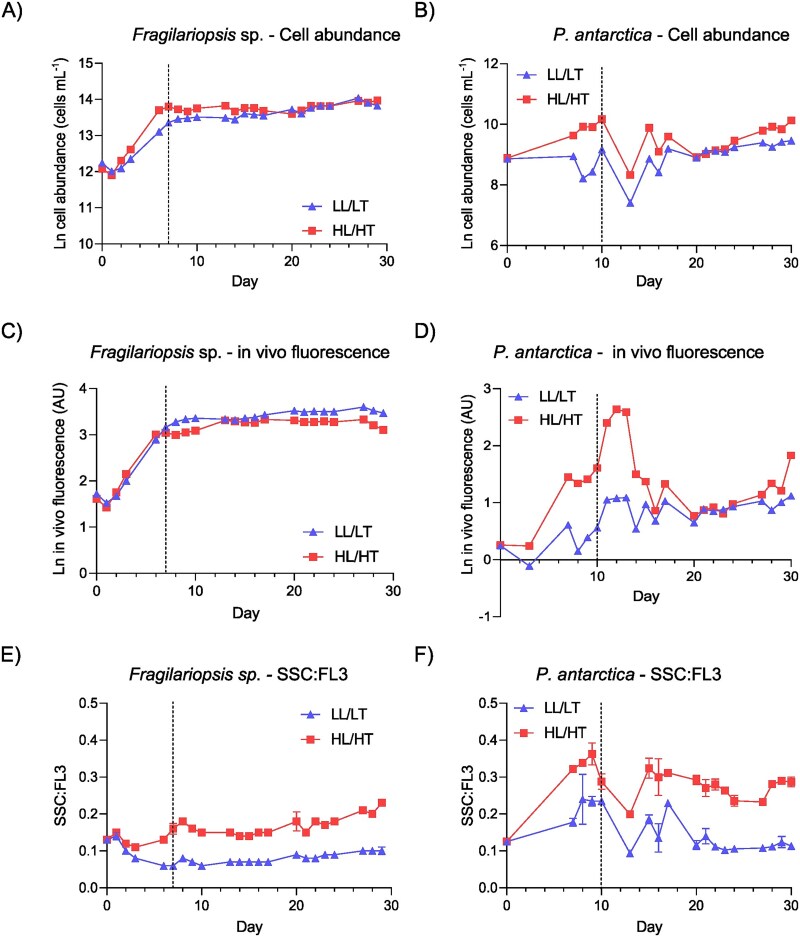 Fig. 1
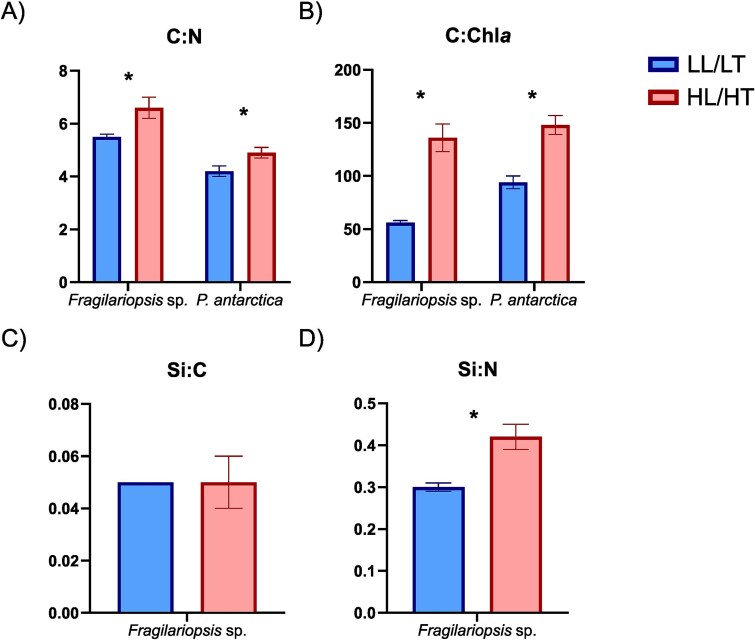 Fig. 2
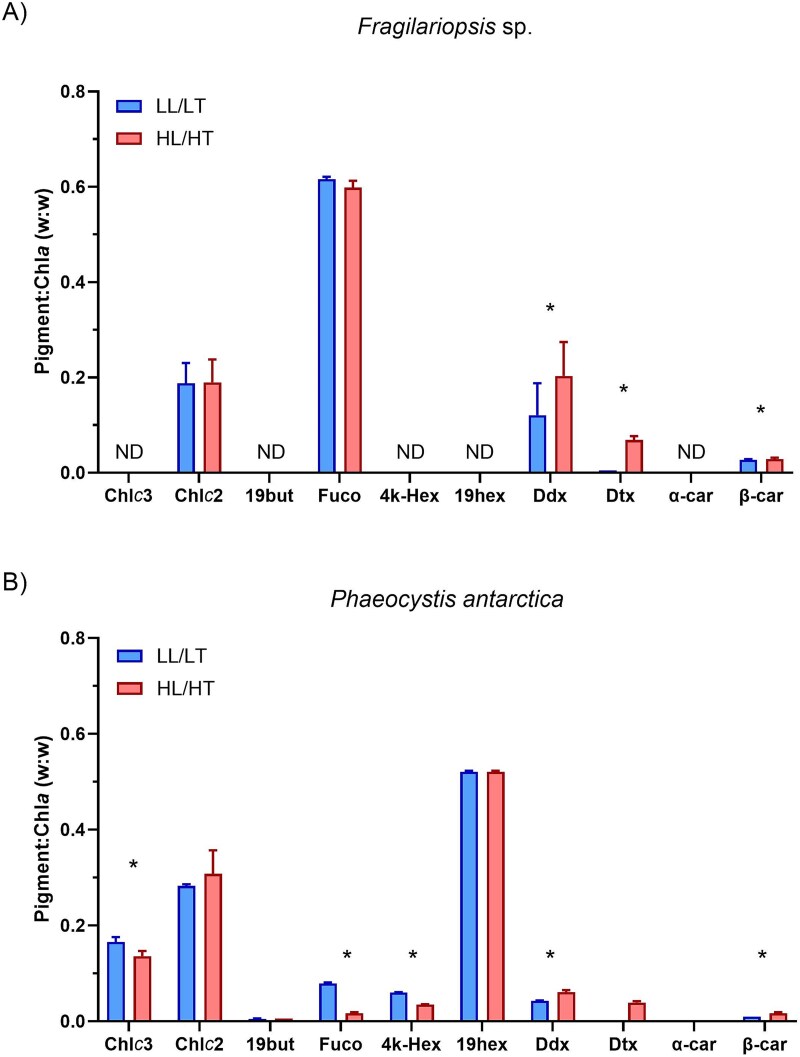 Fig. 3
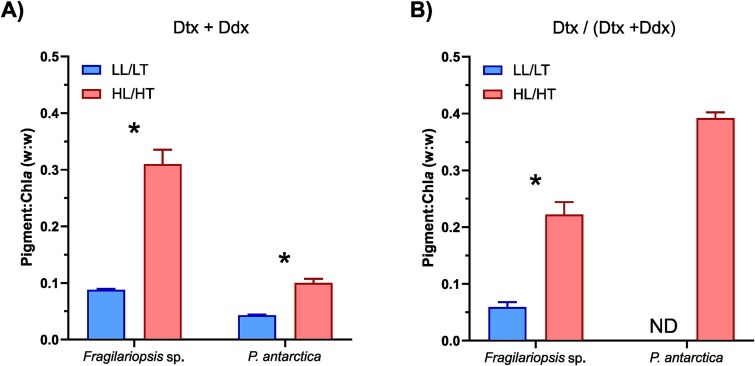 Fig. 4
| Treatment | POC | PON | TChl | bSi |
|---|---|---|---|---|
| (μg L−1) | (μg L−1) | (μg L−1) | (μg L−1) | |
|
| ||||
| LL/LT | 4 187 ± 86 | 766 ± 8 | 80.5 ± 12. 7 | 9.96E-4 ± 4.0E-5 |
| HL/HT | 4 103 ± 166 | 623 ± 30 | 34.2 ± 8.4 | 1.11E-3 ± 4.1E-5 |
|
| 0.466 | <0.001* | <0.001* | 0.004* |
|
| −0.80 | −9.32 | −6.10 | 4.55 |
| df | 4.50 | 3.43 | 5.20 | 5.99 |
|
| ||||
| LL/LT | 1 211 ± 34 | 290 ± 13 | 12.9 ± 0.8 | NA |
| HL/HT | 1 532 ± 68 | 315 ± 7 | 10.4 ± 0.4 | NA |
|
| 0.006* | 0.057 | 0.015* | NA |
|
| 7.32 | 3.02 | −4.98 | |
| df | 2.94 | 2.99 | 3.1 |
| Treatment | Cell size | C content | N content | Si content | Chl | FL3:SSC |
|---|---|---|---|---|---|---|
| (μm) | (Pg cell−1) | (Pg cell−1) | (Pg cell−1) | (Pg cell−1) | (AU:AU) | |
|
| ||||||
| LL/LT | NA | 4.1 ± 0.1 | 0.76 ± 0.01 | 0.001 ± 0.000 | 0.07 ± 0.00 | 9.59 ± 0.96 |
| HL/HT | NA | 3.5 ± 0.14 | 0.53 ± 0.02 | 0.001 ± 0.000 | 0.02 ± 0.01 | 4.31 ± 0.04 |
|
| <0.001* | <0.001* | 0.476 | <0.001* | <0.005* | |
|
| −9.83 | −21.70 | −0.761 | −16.22 | −11.00 | |
| df | 24.50 | 24.50 | 5.93 | 13.67 | ||
|
| ||||||
| LL/LT | 5.7 ± 0.2 | 16.1 ± 1.5 | NA | NA | NA | 6.98 ± 0.57 |
| HL/HT | 6.0 ± 0.2 | 18.0 ± 1.3 | NA | NA | NA | 2.72 ± 0.24 |
|
| 0.268 | 0.172 | <0.005* | |||
|
| 1.320 | 1.673 | −11.93 | |||
| df | 3.43 | 3.89 | ||||
|
| ||||||
| LL/LT | 5.6 ± 0.5 | 15.8 ± 2.0 | NA | NA | NA | NA |
| HL/HT | 5.9 ± 0.4 | 17.1 ± 0.6 | NA | NA | NA | NA |
|
| 0.511 | 0.385 | ||||
|
| 0.724 | 1.06 | ||||
| df | 3.80 | 2.35 |
| Total colony abundance (colonies mL−1) | Abundance of colonies > 20-μm (colonies mL−1) | Ratio 20/02 | Diameter (μm) | Min diameter (μm) | Max diameter (μm) | |
|---|---|---|---|---|---|---|
| LL/LT | 11.3 ± 3.7 | 2.2 ± 1.0 | 0.39 ± 0.03 | 20.8 ± 5.9 | 8.7 | 132.9 |
| HL/HT | 17.2 ± 6.6 | 12.9 ± 3.2 | 0.77 ± 0.04 | 73.2 ± 21.4 | 12.1 | 299.1 |
|
| 0.260 | 0.021* | <0.001* | 0.042* | ||
|
| 1.37 | 5.55 | 14.37 | 4.06 | ||
| df | 3.13 | 2.38 | 5.74 | 2.35 |
| Treatment | DMSPt:C | DMS:C | DMSPt:Chl | DMS:Chl | DMSPt:DMS | DMSPt content |
|---|---|---|---|---|---|---|
| (mol:mol) | (mol:mol) | (mol:mol) | (mol:mol) | (mol:mol) | (pmol cell−1) | |
|
| ||||||
| LL/LT | 0.003 ± 0.0003 | 1.53E-05 ± 3.80E-7 | 0.014 ± 0.001 | 0.003 ± 0.000 | 223 ± 19 | 0.0012 ± 0.0001 |
| HL/HT | 0.004 ± 0.0006 | 1.92E-05 ± 3.16E-6 | 0.047 ± 0.008 | 0.015 ± 0.003 | 216 ± 9 | 0.0014 ± 0.0000 |
|
| 0.015* | <0.001* | <0.001* | <0.001* | 0.457 | 0.004* |
|
| 2.95 | 4.45 | 9.95 | 10.04 | −0.79 | 4.15 |
| df | 9.67 | 11.34 | 5.27 | 5.13 | 7.15 | 7.21 |
|
| ||||||
| LL/LT | 0.006 ± 0.001 | 0.002 ± 0.000 | 0.042 ± 0.010 | 0.016 ± 0.003 | 2.6 ± 0.7 | NA |
| HL/HT | 0.009 ± 0.001 | 0.004 ± 0.000 | 0.096 ± 0.009 | 0.044 ± 0.005 | 2.2 ± 0.3 | NA |
|
| <0.001* | <0.001* | <0.001* | <0.001* | 0.166 | |
|
| 5.43 | 8.11 | 12.39 | 13.08 | −1.48 | |
| df | 12.72 | 8.76 | 15.60 | 6.88 | 11.33 |
- —Antarctic Science Platform, Project 3
- —University of Otago Doctoral Scholarship and the National Institute of Water and Atmospheric Research Strategic Science Investment Funds
Peer Reviews
No public reviews on file for this paper yet. If you reviewed it on a platform where reviews are public (OpenReview, ICLR, NeurIPS, ICML), you can paste yours below so the community can read it here.
Videos
No videos yet. Explain this paper in a talk, walkthrough, or lecture? Add one.
Taxonomy
TopicsMarine and coastal ecosystems · Microbial Community Ecology and Physiology · Marine Biology and Ecology Research
INTRODUCTION
Bacillariophyta (diatoms) and Prymnesiophyceae (P. antarctica) are some of the main bloom-forming taxa in the Southern Ocean, with differing eco-physiological characteristics that determine the timing of their proliferation. The accumulation of the colonial form of P. antarctica has been previously attributed to tolerance of low and variable irradiance associated with deeper surface mixed layers (Arrigo et al., 1998). Diatoms subsequently bloom under more stratified conditions (Arrigo et al., 1999), reflecting their greater tolerance at higher irradiance (Arrigo et al., 2010). However, bloom dynamics in the Southern Ocean are changing in magnitude, seasonality and phenology in response to climate change (Thomalla et al., 2023). Future warmer conditions projected for the end of the century may result in increases in stratification and shallower mixed layer depth (Rickard and Behrens, 2016; Xue et al., 2024), affecting photosynthetic efficiency via increased exposure to higher light levels (Bopp et al., 2001; Boyd et al., 2008) and reduced inputs of iron from subsurface waters (Smith et al., 2012). Based on previous experiments (Xu et al., 2014; Zhu et al., 2017), it is anticipated that these climate change–driven alterations may benefit diatoms relative to P. antarctica. Conversely, field observations have reported a low correlation between mixed layer depth and the abundance of both diatoms and P. antarctica (Cristi et al., 2024) and also P. antarctica dominance in shallower mixed layers (Mangoni et al., 2019), suggesting that P. antarctica may be more competitive than previously reported.
Warmer temperatures are expected to affect phytoplankton physiology differently depending on the thermal tolerance of each species (Bishop et al., 2022) and ultimately determine species biogeography and phenology of blooms (Thomas et al., 2012). Temperature also influences tolerance to light by affecting light-harvesting pigment cell concentrations (Finkel et al., 2010) and also iron metabolism with higher temperatures decreasing tolerance of iron limitation (Sunda and Huntsman, 2011). Ultimately, this may have implications for Phaeocystis colony formation (Wang et al., 2010), Fragilariopsis sp. silica cell concentration (Xu et al., 2014) and more generally for cell size (Atkinson et al., 2003).
The effect of increasing irradiance due to shallower mixed layers on bloom dynamics will depend on species-specific mechanisms for optimizing physiological performance under prevailing light regimes. One of the main mechanisms underpinning photoacclimation is the xanthophyll cycle (Goss and Jakob, 2010), which is carried out by the pigments diadinoxanthin (Ddx) and diatoxanthin (Dtx) in both diatoms and Prymnesiophyceae (Strain et al., 1944). During the xanthophyll cycle, Ddx is transformed into Dtx by a de-epoxidation process activated by light (Goss and Jakob, 2010). Culture experiments conducted with single-cell P. antarctica have shown that this species can only sustain the xanthophyll cycle for short periods and instead relies more on photo-repair mechanisms (Kropuenske et al., 2009). This makes P. antarctica more susceptible to photoinhibition than Fragilariopsis sp., which can sustain the activation of the xanthophyll cycle at high irradiance for long periods, hence reducing photodamage associated with high light exposure (Kropuenske et al., 2010).
Any alteration in bloom dynamics between diatoms and P. antarctica in response to climate change may have implications for food webs and carbon fluxes. Zooplankton graze more effectively on diatoms than P. antarctica colonies, which supports a more efficient transfer of carbon to higher trophic levels (Schnack-Schiel and Isla, 2005). Diatoms are also considered a high-export group (Smetacek, 1999), although their contribution differs amongst species depending on cell size and density, with larger and denser cells sinking faster (Raven and Waite, 2004; Finkel and Kotrc, 2010). In the case of P. antarctica, early studies attributed a high export potential through sinking associated with low remineralization in the upper water column (DiTullio et al., 2000) but recent studies have pointed towards deep mixing rather than sinking as the reason for observed export events involving P. antarctica (Jones and Smith, 2017). Phaeocystis antarctica also plays a significant role in sulphur cycling due to its high intracellular dimethylsulfoniopropionate (DMSP) content, which may subsequently influence aerosol and cloud formation via the production and emission of dimethylsulfide (DMS) (Liss et al., 1994). At a cellular level, DMSP may act as an antioxidant (Sunda et al., 2002), osmoprotectant (Lyon et al., 2016) and a cryoprotectant (Nishiguchi and Somero, 1992) and also has a potential role as an info-chemical (Seymour et al., 2010), as a grazing attractant (Shemi et al., 2021) or a deterrent (Fredrickson and Strom, 2009).
To date, most experimental studies investigating the influence of environmental drivers on the relative dominance of these phytoplankton groups have compared the response of diatoms and single-celled P. antarctica (Zhu et al., 2016; Trimborn et al., 2017, 2019; Beszteri et al., 2018), or not specified morphotype (Kropuenske et al., 2009; Arrigo et al., 2010), with only two studies examining colony-forming strains (Xu et al., 2014; Zhu et al., 2017). Experiments using natural communities have also explored the response of these two groups to various physicochemical factors (Feng et al., 2010). Here, we conducted two chemostat experiments using monospecific cultures of Fragilariopsis sp. and colony-forming P. antarctica, under two combinations of irradiance and temperature to test the physiological and ecological effects of projected future warming (+2°C) and increased light on each species. Specifically, this study focuses on the acclimatory response of (i) cell biomass and elemental composition, (ii) photophysiology and (iii) DMSP and DMS production.
MATERIALS AND METHODS
Experimental framework
Two independent chemostat experiments were conducted under controlled light, macronutrient and temperature conditions using a Biostat® B benchtop bioreactor with twin double wall Univessel® Glass 2 L culture vessels (Sartorius stedim biotech, Göttingen, Germany), hereafter referred to as the chemostat (Supplementary Fig. 1). A detailed explanation of the setup is provided in the supplementary material (S1.1). Chemostat systems allow the maintenance of a stable physiology by balancing cell growth with a constant rate of nutrient supply (Ziv et al., 2013). This is achieved by establishing a constant inflow of fresh media balanced by an outflow that dilutes the culture at a constant rate (i.e. dilution rate). After several generations, cells attain balanced growth—in relation to an acclimated nutrient limitation (in this case, nitrogen), indicating that cell metabolic demands are met and reflected by maintaining a stable biomass (Parkhill et al., 2001)—which can be maintained for long periods. Under these steady-state conditions, the cell growth is acclimated to nutrient availability and the cell’s physiology responds exclusively to the treatment (Sciandra et al., 1997), reducing the uncertainties associated with changing biomass and growth conditions inherent to batch cultures (Gresham and Dunham, 2014).
Here, each experiment was performed independently using two phytoplankton strains isolated from Antarctica; the diatom Fragilariopsis sp. (single-celled only, RCC6062, isolated from the Ross Sea), and the Prymnesiophyceae P. antarctica (colonies and single cells, RCC4024, isolated from West Antarctic Peninsula), supplied by the Roscoff Culture Collection (RCC, Roscoff, France). In the case of Fragilariopsis sp., Blastn analysis indicates that the best match is Fragilariopsis cylindrus (Supplementary Table I), but we refer to this as Fragilariopsis sp. throughout the text for consistency with the RCC database.
Cultures were grown using nitrogen-limited K + Si media for Fragilariopsis sp. (20-fold lower concentration relative to Roscoff recommended media strength: 44 μM of NO_3_ and 2.5 μM of NH_4_) and nitrogen-limited K/2ET for P. antarctica (8-fold lower nitrogen concentration: 35 μM NO_3_ and 0.5 μM NH_4_) (https://roscoff-culture-collection.org/culture-media). The differences in nitrogen limitation between experiments were determined by the tolerance to nitrogen deficit of each species, with P. antarctica unable to grow at 20-fold nitrogen limitation. Although iron is the main limiting nutrient in the Southern Ocean (Martin et al., 1990), the chemostat does not allow for an iron-clean experiment. Therefore, iron was not limited and, in both cases, was supplied at the concentration specified in the media. Phosphorus concentration remained at the concentration suggested by RCC (10 μM for Fragilariopsis sp. and 18 μM for P. antarctica).
The experiment aimed to test the physiological response to increases of +2°C and light in response to a shallower surface mixed layer within each species. The temperature in Southern Ocean surface waters ranges between −2°C and 10°C, depending on the region (Auger et al., 2021). As the strains used in the experiments were long-term acclimated to 4°C, we used this as the control temperature, as with previous experiments on Southern Ocean phytoplankton (Stefels and Van Leeuwe, 1998; Van Leeuwe et al., 2014), acknowledging that this is higher than surface water temperatures in more southerly waters around Antarctica. Consequently, the low-light and low-temperature conditions (LL/LT) were set at 4°C and 25-μmol m^−2^ s^−1^ of photosynthetic photon flux density (PPFD). The “treatment” representing a future scenario of increased temperature and light was then set at +2°C higher (+6°C) and 125-μmol m^−2^ s^−1^ PPFD to simulate high light and high temperature (HL/HT). Light levels were chosen based on low and high irradiance levels used in previous experiments (Arrigo et al., 2010; Xu et al., 2014). In both cases, a constant irradiance was used to simulate Antarctic summer daylight conditions.
The initial inoculum was prepared in triplicate batch cultures and grown for 25 days in the same nutrient-limited media as prepared for each chemostat experiment at LL/LT conditions. Batch cultures were then pooled together in a single sterile bottle and gently mixed before ~150 mL was inoculated into each chemostat chamber, previously filled with 1.5 L of sterile media. Chambers were then topped up to 2 L with fresh media and left overnight without stirring. For the Fragilariopsis sp. experiment, the cultures were stirred at 20 rpm for the remainder of the experiment. There was no stirring in the P. antarctica experiment, except for the 2 hours prior to daily sampling, to minimize potential damage to colonies. Cultures were grown in the chemostat chambers under the specified conditions for 7 days in the case of Fragilariopsis sp. and 10 days for P. antarctica, before connecting to a continuous exchange of culture and media using two independent peristaltic pumps that controlled the inflow and outflow rates. In chemostat systems, the growth rate is set by the dilution rate (Laws et al., 1995), which were 0.15 and 0.10 L day^−1^ for Fragilariopsis sp. and P. antarctica, respectively, and were less than the maximum growth rates under nitrogen-limited media determined previously at LL/LT conditions (μmax Fragilariopsis sp*.*: 0.2 L day^−1^; μmax P. antarctica: 0.12 L day^−1^). Experiments were maintained at constant temperature, irradiance and dilution rate conditions for 3 weeks before the final sampling. For each experiment, both chambers were harvested in the same 24-hour period: Day 29 for Fragilariopsis sp. and Day 30 for P. antarctica (Fig. 1).
Experiment progression of growth and fluorescence in Fragilariopsis sp. (left) and P. antarctica (right). Plots (A) and (B) are cell abundance measured by flow cytometry; (C) and (D) in vivo fluorescence expressed in arbitrary units (AUs); and (E) and (F) SSC:FL3 ratio as a measure of fluorescence per cell (single cells only). Dashed lines indicate the day each chamber was connected to the continuous exchange of culture and media. Note that the y-axis scale differs with the parameter. LL/LT = low light/low temperature. HL/HT = high light/high temperature.
In vivo fluorescence and flow cytometry measurements
In vivo fluorescence and flow cytometry (FCM) cell counts were used to assess population biomass dynamics throughout the experiment (Fig. 1). For in vivo fluorescence, 4 mL from each culture chamber were collected in borosilicate glass tubes, gently mixed in the dark and immediately read three times using a 10 AU Field fluorometer (Turner designs, CA, USA). FCM samples were collected following Marie et al. (2014) with 1.5 mL of culture preserved with 15 μL of a mixture of glutaraldehyde (25%, Sigma-Aldrich, Missouri, US) and pluronic acid (Poloxamer 188 solution 10%, Merck, New Jersey, US) and incubated in the dark for 15 minutes at room temperature. Samples were then flash-frozen in liquid nitrogen, stored at −80°C and subsequently analysed using a BD Accuri C6 Plus (BD Biosciences) flow cytometer following standard procedures (Tarran and Bruun, 2015). The ratio between chlorophyll-a (Chla) fluorescence (FL3) and side scatter (SSC) (FL3:SSC) was used as a proxy of cell pigment content for characterizing photoacclimation on single cells for both species (Gutiérrez-Rodríguez et al., 2011). Bacterial cell counts were determined using SYBR Green II [10.000X concentrate in Dimethyl sulfoxide (DMSO), ThermoFisher Scientific, MA, USA]. Samples were incubated in the dark for 15 minutes before analysis using the same flow cytometry specified above, using the SSC and FL1 plot.
Particulate organic matter, total Chla and biogenic silica
Particulate organic carbon (POC) and nitrogen (PON) were collected by filtering 50 mL of culture on a pre-combusted 25 mm 0.7 μm pore size glass fibre filter (Whatman GF/F). Blanks were collected by placing pre-combusted Whatman GF/F filters on the same filtration rack without filtering water. Filters were acidified by fumigation over concentrated hydrochloric acid in a glass desiccator with Teflon-lined shelf, followed by air-drying in a fume hood for 2 hours. Analysis was conducted using a DELTA V Plus continuous flow isotope ratio mass spectrometer linked to a Flash 2000 elemental analyser using a MAS 200 R autosampler (Thermo-Fisher Scientific, Bremen, Germany). POC and PON from blanks were subtracted in culture samples. Samples for total Chla (TChla) were collected by filtering 50 mL of culture through Whatman GF/F filters, dry-blotted, folded, wrapped in aluminium foil and stored at −80°C. Analysis was conducted using a Turner Designs 10 AU field fluorometer following 90% acetone extraction and standard fluorometric technique after Strickland and Parsons (1972). Chla cell content is only available for Fragilariopsis sp. due to its single-celled form and was determined by dividing the Chla concentration by the number of cells estimated by FCM. An additional 20 mL of culture was sampled for the determination of biogenic silica (bSi) in the Fragilariopsis sp. experiment. Samples were filtered through 0.6 μm pore size polycarbonate filters (Merck Millipore, MA, US) and stored at room temperature until analysis, following procedures described in Ragueneau and Tréguer (1994).
Carbon biomass and cell size for Fragilariopsis sp.
POC concentration was used to estimate cell carbon content. To determine if it was appropriate to use POC as a proxy for carbon for this species, bacteria cell counts were transformed into carbon and nitrogen using the cell carbon content of “Oceanic, Southern (65°S)” from Fukuda et al. (1998), which determined a low contribution of bacteria to the POC (1.2% for HL/HT and 0.6% for LL/LT) and PON (0.2% for HL/HT and 0.5% for LL/LT) pools. Since the correlation between POC and bacteria cell counts was not significant (linear regression, F = 1 457, P-value = 0.2506) (Supplementary Fig. 2), we use POC and PON as a proxy for carbon (C) and nitrogen (N) for this study. In both parameters, the concentration of C and N was divided by phytoplankton cell abundance to estimate C and N cell content. FSC measurements provide an estimate of cell size in arbitrary units (Rieseberg et al., 2001); therefore, relative alterations in size were determined by looking into variations in forward scatter (FSC) and SSC from flow cytometry between treatments (Supplementary Table II) since specific cell size measurements are not available.
Carbon biomass, cell and colonial size for P. antarctica
A combination of size-fractionated Chla (SFChla) that separated >20 μm and <20 μm fractions and light microscopy was used to quantify colonial biomass, size and abundance relative to single cells. For SFChla, 20 mL of sample was filtered under low vacuum through a 20 μm pore size polycarbonate filter to retain large colonies, followed by 0.2 μm filtration to retain the single cells and small colonies passing through the 20 μm filter (Tang et al., 2008). Analysis of SFChla filters was conducted using 90% acetone extraction followed by spectrofluorometer on a Varian Cary Eclipse fluorometer following method APHA 10200 H (American Public Health Association, 2005). For light microscopy, 3 mL of culture from each chamber was collected and preserved with acidic Lugol’s iodine solution (1% final concentration) and stored in the dark at 4°C. Analysis was conducted by settling 1 mL of preserved sample in a Utermöhl sedimentation chamber for 1 hour. All colonies found in the chamber were counted, and their length was measured for size determination using an Olympus IX73 inverted microscope and CellSense software. The length of single cells and those forming colonies (40–50 in each case) were measured to estimate cell carbon content, assuming a spherical shape, as described in Mathot et al. (2000), and using the following equation from Eppley et al. (1970):
\documentclass[12pt]{minimal} \usepackage{amsmath} \usepackage{wasysym} \usepackage{amsfonts} \usepackage{amssymb} \usepackage{amsbsy} \usepackage{upgreek} \usepackage{mathrsfs} \setlength{\oddsidemargin}{-69pt} \begin{document} $$ \mathrm{Log}\ {\mathrm{C}}_{\mathrm{cell}}=0.94\ \left(\log{\mathrm{Vol}}_{\mathrm{cell}}\right)-0.6 $$\end{document}High-performance liquid chromatography analysis
High-performance liquid chromatography (HPLC) pigment analysis was conducted by low-vacuum filtration of a 50 mL sample from each chamber through GF/F filters. Pigment extraction was conducted by sonicating the filter in 2.5 mL of 90% acetone and storage at −20°C overnight, with the extract filtered through GF/F. Analysis was carried out using an Agilent HPLC 1200 system equipped with a G1311A quaternary pump, a G2258A autosampler, a G1316B column thermostat and a G1315C diode array detector following Latasa et al. (2022). The de-epoxidated state of the xanthophyll cycle (DES)—an estimate of the conversion of Ddx to Dtx—was calculated by dividing the concentration of Dtx by the total xanthophyll pigments (Ddx + Dtx) according to Kropuenske et al. (2010).
Dimethylsulfide and total dimethylsulfoniopropionate
Samples for dimethylsulfide (DMS) were collected by transferring 1 mL of culture from each chamber to a 10 mL syringe previously filled with ultrapure MilliQ water and subsequently injected onto a GF/F filter in a sparging unit. Samples for total dimethylsulfoniopropionate (DMSPt)—which includes particulate and dissolved DMSP plus DMS—were collected in duplicate by pipetting 1 mL of sample into 5 mL glass vials containing 4 mL of MilliQ water and adding two pellets of NaOH. Vials were gas-tight-sealed and stored in the dark at room temperature. Analysis was conducted using a purge and trap preconcentrator followed by separation using an Agilent 6 850 gas chromatograph with detection by an Agilent 355 sulphur chemiluminescence detector (Saint-Macary et al., 2021). DMS(P) is used in the text when generally referring to both DMSPt and DMS. We did not quantify DMS losses to the headspace, but since there was no aeration in the chemostat chambers, this loss is expected to be low.
Statistical analysis
The chemostat experimental set-up provided two unreplicated treatments, and so subsamples were collected for each parameter as pseudoreplicates to provide an estimate of variability within sampling and analysis. As in similar experiments where replicated treatments were not possible (Deppeler et al., 2018), pseudoreplicates were treated as true replicates to provide an assessment of differences between treatments. This approach was also supported by the chemostat approach in maintaining stable physiological conditions for long periods (Kolber et al., 1988; Laws et al., 1995; Gutiérrez-Rodríguez et al., 2014), thus ensuring that the observed responses were due to treatment and not from growth stages or shock responses (see Experimental framework section).
The treatment effect within each experiment was evaluated using Student’s t-test. Differences between different morphotypes (single-celled and colonial) in the P. antarctica experiment were determined using a two-way analysis of variance (ANOVA) followed by Tukey’s honest significant difference (HSD) (R package “Stats” version 3.6.2). Two-way ANOVA was also used to compare the response between species on pigment concentration and elemental composition. Results from two-way ANOVA and Tukey’s HSD test can be found in Supplementary Tables III and IV.
RESULTS
Elemental composition
Bulk C:N and C:Chla ratios were higher under HL/HT for both species (Fig. 2). The C:Chla ratio exhibited a greater increase in Fragilariopsis sp*.* under HL/HT (2.4-fold; t-test, t = 12.33, df = 11.203, P < 0.001) than P. antarctica (1.6-fold; t-test, t = 16.95, df = 14.511, P < 0.001). In the case of C:N, both species had a similar increase under HL/HT (1.2-fold), which maintained the higher C:N ratio observed in Fragilariopsis sp. under LL/LT (1.3-fold higher than P. antarctica). The Fragilariopsis sp. Si:C ratio showed no significant variation between treatments (t-test, t = 0.862, df = 17.27, P = 0.401), although Si:N was 1.4-fold higher under HL/HT (t-test, t = 18.88, df = 21.45, P < 0.001) (Supplementary Table V). As POC was unaffected by treatment, the stoichiometric changes observed in Fragilariopsis sp. were due to variations in PON, TChla and Si, whereas P. antarctica had significant variations in POC and TChla but not in PON concentration (Table I).
Stoichiometry ratios for each species and treatment. (A) C:N, (B) C:Chla, (C) Si:C and (D) Si:N. The colour blue indicates low light/low temperature (LL/LT) and red high light/high temperature (HL/HT). t-test was used for statistical analysis of differences between treatments, P < 0.05 are indicated with an asterisk (). Silica ratios are only available for Fragilariopsis sp.*
Cell size and cellular content
Chla cell content and FL3:SSC were lower under HL/HT in Fragilariopsis sp. (Table II). Variations in FSC values between treatments in Fragilariopsis sp. indicated that cells were 1.4-fold smaller under HL/HT (t-test, t = −4.57, df = 3.002, P < 0.05) despite no differences based on SSC (t-test, t = −0.0.244 df = 3.01, P = 0.8228). Accordingly, C and N cell contents were 1.2-fold and 1.4-fold lower under HL/HT, respectively (C cell content: t-test, t = −9.83, df = 24.50, P < 0.001. N cell content: t-test, t = −21.7, df = 24.50, P < 0.001). In addition, the Si cell content was unaffected by treatment (t-test, t = −0.761, df = 5.93, P = 0.476).
In the case of P. antarctica, FL3:SSC for the single-cell fraction was 2.6-fold lower under HL/HT (t-test, t = −11.93, df = 2.70, P < 0.005). Phaeocystis antarctica did not show significant variation in cell size or C content on either of the morphotypes between treatments (Table II).
Colony formation
The abundance of P. antarctica large colonies (≥20 μm) increased 6-fold under HL/HT (Table III). Similarly, the average diameter of colonies increased 4-fold under HL/HT (t-test, t = 4.06, df = 2.35, P < 0.05). Nevertheless, there were no significant differences in the total colony abundance per millilitre regardless of their size (t-test, t = 1.37, df = 3.13, P = 0.260). Results based on SFChla revealed a 2-fold increase in the colony to single-celled biomass ratio (Ratio 20/02) at HL/HT (t-test, t = 14.37, df = 5.74, P < 0.001).
DMS and DMSPt concentrations
DMS and DMSPt concentrations increased under HL/HT for both species (Table IV). DMSPt:C and DMS:C increases of 1.5- and 1.7-fold occurred under HL/HT in P. antarctica, respectively, whereas Fragilariopsis sp. showed a fold increase of 1.3 on both parameters. DMSPt:Chla and DMS:Chla significantly increased 2.3- and 2.7-fold under HL/HT in P. antarctica, respectively, (DMSPt:Chla; t-test, t = 12.39, df = 15.60, P < 0.001. DMS:Chla; t-test, t = 13.08, df = 6.88, P < 0.001), while both variables showed a significant increase of 3.4-fold under HL/HT in Fragilariopsis sp. (DMSPt:Chla; t-test t = 9.95, df = 5.27, P < 0.001. DMS:Chla; t = 10.04, df = 5.13, P < 0.001). The DMSPt cell content in Fragilariopsis sp. was higher under HL/HT (t-test, t = 4.15, df = 7.21, P < 0.005), although the concentration was extremely low. There was no effect of treatment on DMSPt:DMS for either species (Table IV).
Pigments, photoprotection and photoacclimation
Xanthophyll cycle pigments increased under HL/HT for both species. Dtx in Fragilariopsis sp. was detectable in both treatments but only under HL/HT for P. antarctica, whereas Ddx was observed in both treatments for both species (Fig. 3). Dtx and Ddx increased 2.9-fold and 13.8-fold under HL/HT, respectively, in Fragilariopsis sp. In P. antarctica, Ddx increased 1.4-fold under HL/HT (Supplementary Table VI).
Pigment composition for each species and treatment. Mean (±SD) pigment to Chla ratios (w:w) obtained from three replicated samples are shown. t-test was used for statistical analysis of differences between treatments; P < 0.05 are indicated with an asterisk (). Values denoted as ND indicate that the pigment was not detected. Key: Chlorophyll c3 (Chlc3), Chlorophyll c2 (Chlc2), 19′butanoyloxyfucoxanthin (19but), Fucoxanthin (Fuco), 4keto-19′hexanoyloxyfucoxanthin (4 k-Hex), 19′hexanoyloxyfucoxanthin (19hex), Diadinoxanthin (Ddx), Diatoxanthin (Dtx), alpha-carotene (α-car) and beta-carotene (β-car). LL/LT = low light/low temperature. HL/HT = high light/high temperature. Values are available in Supplementary Table VI.*
Total xanthophyll pigments (Dtx + Ddx) were 3.1-fold higher in Fragilariopsis sp. than P. antarctica under HL/HT (two-way ANOVA_,_ F = 115.6, P < 0.001, Fig. 4). However, the de-epoxidated state of the xanthophyll cycle (DES) was higher under HL/HT in P. antarctica (two-way ANOVA_,_ F = 265.1, P < 0.001). Other photoprotective pigments such as β-carotene (β-car) increased under HL/HT and had a higher concentration relative to TChla in Fragilariopsis sp. (two-way ANOVA, F = 2.40, P < 0.001). In the case of primary pigment markers, fucoxanthin (Fuco) was at a higher concentration in Fragilariopsis sp. relative to P. antarctica (two-way ANOVA, F = 24.45, P < 0.001). Fuco was 4-fold lower under HL/HT in P. antarctica (t-test, t = −36.49, df = 3.4, P < 0.001) but did not show any difference between treatments in Fragilariopsis sp. (t-test, t = 0.26, df = 5.9, P = 0.806). 19′-hexanoyloxyfucoxanthin (19hex), 19′butanoyloxyfucoxanthin (19but) and 4keto-19′hexanoyloxyfucoxanthin (4 k-hex) were only detected in P. antarctica and were unaffected by treatment, except for a 1.7-fold decrease in 4 k-hex:Chla under HL/HT (t-test, t = −30.88, df = 3.44, P < 0.0001). Chlorophyll-c3 (Chlc3) was only detected in P. antarctica at a lower concentration under HL/HT (t-test, t = −3.44, df = 3.97, P < 0.05). Chlorophyll-c2 (Chlc2) was identified in both species but with no significant treatment effect in either.
Pigments of the xanthophyll cycle. (A) For total xanthophyll pigments (Dtx + Ddx) relative to Chla. (B) Ratio of de-epoxidation state (DES). The colour blue indicates low light/low temperature (LL/LT) and red high light/high temperature (HL/HT). t-test was used for statistical analysis of differences between treatments; P < 0.05 are indicated with an asterisk ().*
DISCUSSION
This work measured acclimation responses for the colony-forming P. antarctica and Fragilariopsis sp. to a projected future scenario. The long exposure facilitated by the chemostat system ensured that the responses of both species were the result of acclimation instead of short-term adjustments (Ziv et al., 2013). By using ecologically significant species and morphotypes (Smith et al., 2003; Saggiomo et al., 2021), the results provide ecologically relevant measurements relative to experiments using the single-celled morphotype of P. antarctica (Smith and Trimborn, 2024).
Results indicate that +2°C warming and increased light availability will result in physiological adjustment by both species with alterations in elemental composition, cell and colonial size as well as pigments. Elemental composition adjusted to high irradiance as expected (Geider, 1987), with a decrease in C:Chla and FL3:SSC in both species. Although Fragilariopsis sp. had an expected photoacclimation response driven by a larger increase in C:Chla and xanthophyll pigments, P. antarctica showed stronger activation of the xanthophyll cycle (1.6-fold higher), with a higher ratio of de-epoxidation state (DES) under HL/HT, than Fragilariopsis sp. (Fig. 4). A higher DES ratio in response to increasing in irradiance was anticipated for both species (Kropuenske et al., 2009; Arrigo et al., 2010), but the higher ratio in P. antarctica was surprising as this has not been described before. A prolonged DES in Fragilariopsis sp. is considered an additional photoprotective strategy for preventing damage in the event of re-exposure to high light after a drop in irradiance (Kropuenske et al., 2009). In contrast, DES in P. antarctica has been proposed as a short-term photoprotective strategy to high light (Kropuenske et al., 2009), which may reflect the different mixed layer depth preferences previously identified in these two species (Arrigo et al., 1998). The long exposure to treatment in this experiment supports that this response is likely a long-term acclimation strategy in both species. This indicates that colony-forming P. antarctica can sustain the xanthophyll cycle for long periods and also potentially has greater reliance on the xanthophyll cycle than previously considered (Kropuenske et al., 2009; Arrigo et al., 2010).
In addition to pigments from the xanthophyll cycle, P. antarctica altered its pigment composition to a greater extent than Fragilariopsis sp. under HL/HT, with significant decreases in Chlorophyll-c3, Fucoxanthin and 4keto-19′hexanoyloxyfucoxanthin (Fig. 3). The decrease of these pigments under HL/HT is consistent with their role as light-harvesting pigments (Van Leeuwe et al., 2014) and shows a wider pigment-driven acclamatory response for P. antarctica relative to Fragilariopsis sp*.,* whose main alterations were in C:Chla and total xanthophyll pigments. The lack of treatment effect on the two main taxonomic pigment markers—fucoxanthin in Fragilariopsis sp*.* and 19′-hexanoyloxyfucoxanthin in P. antarctica—shows a tight balance of these pigments with Chla concentration, a response that has been previously described for P. antarctica (Van Leeuwe et al., 2014), supporting the use of these pigments for taxonomic identification.
Acclimatory responses to warming and elevated light also included a reduction in the cell size in Fragilariopsis sp. (1.3-fold smaller) and an increase in the colonial size and abundance in P. antarctica (4-fold increase). The observed alterations in cell size and photophysiology in response to future projections could alter the carbon export and transfer to higher trophic levels. Initial assessment of carbon export by P. antarctica suggested a high export potential through sinking for this species (DiTullio et al., 2000), favoured to some extent by the lower grazing susceptibility of larger colonies (Tang, 2003). Phaeocystis antarctica colony size increased under HL/HT, in agreement with previous work evaluating the effect of irradiance in colony formation (Peperzak, 1993) and also experiments using natural communities (Feng et al., 2010), which suggests increased protection from grazing (Tang, 2003). However, this size increase will not necessarily enhance carbon export, as a significant proportion of P. antarctica carbon is remineralized in surface layers by bacterial activity (Thingstad and Billen, 1994) including colonies that sink quickly (Asper and Smith, 2019). Furthermore, bacterial remineralization may be further enhanced under higher temperatures (Segschneider and Bendtsen, 2013). Overall, this suggests a low carbon export efficiency by P. antarctica (Meyer et al., 2022). Conversely, the smaller but denser silica frustules in Fragilariopsis sp. under the HL/HT treatment could enhance diatom-driven carbon export in future warmer conditions by increasing their specific sinking rates (Lürling, 2021; Raven and Waite, 2004; Brzezinski et al., 2015). Denser cells would also provide an ecological advantage by greater protection against viral infection (Kranzler et al., 2019) and grazing (Pančić et al., 2019). Enhanced sinking rates and a reduction in cell loss to viral lysis and grazing could lead to more efficient export of both carbon and silica. Remineralization rates differ, with silica being slower than carbon (Nelson et al., 1996) and strongly dependent on temperature (Lawson et al., 1978,), and so evaluating the combined effect of higher temperatures and light is needed to estimate the future contribution to silica fluxes.
Sulphur cycling as indicated by DMS and DMSPt was promoted by increasing temperature and light. Although the Southern Ocean is projected to decrease the DMS ocean surface concentration (Kloster et al., 2007), the trend for regions where these two species dominate, like the Ross Sea, is to increase in response to retreating sea ice, enhancing light availability and increasing primary productivity (Kloster et al., 2007), in agreement with the scenario tested in this work. Previous studies suggest that higher irradiance may promote DMS and DMSP concentrations by increasing biomass and also by enhancing cellular release of these compounds (Archer et al., 2010). Here, the lack of treatment effect on DMSPt:DMS ratios suggests that pathways involved in the cleavage of DMSP to DMS were unaffected, reflecting a balance between the metabolism of DMSP and the DMSP lyase activity. Higher DMSP in response to HL/HT supports its role as an antioxidant (Sunda et al., 2002) and suggests an important physiological role in photoprotection on both species. On the other hand, an increase in DMS could further impact grazing dynamics due to its role as an info-chemical with an important ecological influence (Garcés et al., 2013). Description of this compound as a grazing attractor (Shemi et al., 2021) suggests that the protection conceived by increases in colony size (P. antarctica) may be offset, especially in future shallower surface mixed layers where the predator–prey encounter rate is expected to be higher (Behrenfeld, 2010).
Competition between Fragilariopsis sp. and P. antarctica will influence the regional relative fate of carbon between export and the food web. Previous experiments have determined that Fragilariopsis sp*.* shows a greater capacity to thrive under stratified conditions (Xu et al., 2014), while others have reported an increase in the colonial and relative abundance of P. antarctica relative to diatoms under an HL scenario (Feng et al., 2010). However, the combination of high DES observed here in P. antarctica with the reported repair mechanism in response to high irradiance (Kropuenske et al., 2009) may support adaptation to elevated irradiance, consistent with the observed dominance of this species under stratified conditions (Mangoni et al., 2019; Cristi et al., 2024). This unexpectedly physiological capability of P. antarctica reinforces the high genetic plasticity of P. antarctica, with blooms presenting clones that respond differently to the environment (Luxem et al., 2017) and indicates that P. antarctica can be a better competitor in a future scenario than anticipated. This high genotypic diversity emphasises the value of experiments to expand the understanding of traits for key species under different environmental conditions.
CONCLUSIONS
Differential changes in Fragilariopsis sp. and P. antarctica elemental and cellular stoichiometry were observed in response to higher irradiance and temperature. The stronger DES observed in P. antarctica indicates that the colony-forming strain possesses mechanisms for tolerance to the higher irradiance experienced in a shallow mixed layer depth, contrary to previous observations. This pigment response was coupled with an increase in colony size and elevated DMS(P):C, which may have ecological implications related to grazing and potentially vertical export under future conditions. These results provide valuable insights for trophic and biogeochemical models aiming to predict changes in the spatial and temporal distribution of phytoplankton community composition in the Southern Ocean, including the Ross Sea, where these two species tend to dominate. Overall, the results indicate that P. antarctica has the potential to compete with diatoms under warmer high irradiance conditions in Southern ocean surface waters. Further multifactorial experiments, including the combination of HL/LT and LL/HT with iron control of growth rates should be conducted to further understand the effect of these climate-sensitive variables on the physiology of both taxa. Including the effect of changing environmental conditions on associated bacteria as well as in grazing behaviour would be necessary to determine the impacts of changing bloom dynamics in carbon flows.
Supplementary Material
Supplementary_material_fbaf023
The reference list from the paper itself. Each links out to its DOI / PubMed record.
- 1American Public Health Association (2005) Standard Methods for the Examination of Water and Wastewater. In: Andrew. D. and Franson, M. A. H. (eds.), 21st ed. Eaton. American Public Health Association.
- 2Archer, S. D., Ragni, M., Webster, R., Airs, R. L. and Geider, R. J. (2010) Dimethyl sulfoniopropionate and dimethyl sulfide production in response to photoinhibition in Emiliania huxleyi. Limnol. Oceanogr., 55, 1579–1589. 10.4319/lo.2010.55.4.1579. · doi ↗
- 3Arrigo, K. R., Mills, M. M., Kropuenske, L. R., van Dijken, G. L., Alderkamp, A-C and Robinson, D. H. (2010) Photophysiology in two major Southern Ocean phytoplankton taxa: photosynthesis and growth of Phaeocystis antarctica and Fragilariopsis cylindrus under different irradiance levels. Integr. Comp. Biol., 50, 950–966. 10.1093/icb/icq 021.21558252 · doi ↗ · pubmed ↗
- 4Arrigo, K. R., Robinson, D. H., Worthen, D. L., Dunbar, R. B., Di Tullio, G. R., Van Woert, M. and Lizotte, M. P. (1999) Phytoplankton community structure and the drawdown of nutrients and CO 2 in the Southern Ocean. Science, 283, 365–367.9888847 10.1126/science.283.5400.365 · doi ↗ · pubmed ↗
- 5Arrigo, K. R., Weiss, A. M. and Smith, W. O. (1998) Physical forcing of phytoplankton dynamics in the southwestern Ross Sea. J Geophys Res Oceans, 103, 1007–1021. 10.1029/97JC 02326. · doi ↗
- 6Asper, V. L. and Smith, W. O. (2019) Variations in the abundance and distribution of aggregates in the Ross Sea, Antarctica. Elementa, 7, 1–15. 10.1525/elementa.355. · doi ↗
- 7Atkinson, D., Ciotti, B. J. and Montagnes, D J S (2003) Protists decrease in size linearly with temperature: ca. 2.5%°C -1. Proc. R. Soc. B Biol. Sci., 270, 2605–2611. 10.1098/rspb.2003.2538.PMC 169154314728784 · doi ↗ · pubmed ↗
- 8Auger, M., Morrow, R., Kestenare, E., Sallée, J. B. and Cowley, R. (2021) Southern Ocean in-situ temperature trends over 25 years emerge from interannual variability. Nat. Commun., 12, 1–9. 10.1038/s 41467-020-20781-1.PMC 781999133479205 · doi ↗ · pubmed ↗