Mendelian randomization study of micronutrients and development of CKD in a Korean population
Juyeon Lee, Sangjun Lee, Kook-Hwan Oh, Sue K. Park

TL;DR
This study uses genetic data to explore how micronutrient intake affects the risk of developing chronic kidney disease in a Korean population.
Contribution
The study applies Mendelian randomization to investigate causal links between micronutrient levels and CKD development.
Findings
Higher vitamin B6 intake was associated with a reduced risk of CKD.
Higher vitamin C intake was linked to an increased risk of CKD.
Phosphorus and vitamin B2 showed no significant associations with CKD.
Abstract
Although dietary intake is a key modifiable risk factor in the development of chronic kidney disease (CKD), the optimal consumption levels to prevent CKD and the intake levels that pose the least risk remain unclear. Building on the findings from our previous cohort study, this research aims to use genetic variants as instrumental variables to clarify the complex relationship between micronutrient status and the pathogenesis of CKD. Of 5,078 participants with a baseline estimate glomerular filtration rate (eGFR) ≥ 60 mL/min/1.73 m2 and who were not diagnosed with CKD, we ascertained 708 new CKD cases over 12 year follow-up periods. Mendelian randomization analyses were conducted using genetic instrumental variables to examine the causal relationships between dietary micronutrients (Phosphorus, Vitamin B2, B6 and C) levels and the development of CKD. In Mendelian randomization study,…
Genes, proteins, chemicals, diseases, species, mutations and cell lines named across the full text — each resolved to its canonical identifier and authoritative record.
Click any figure to enlarge with its caption.
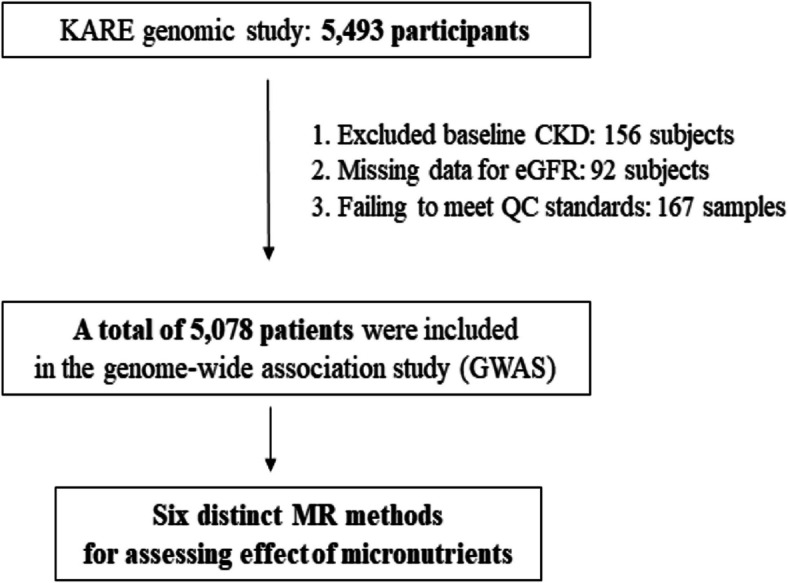 Figure 1
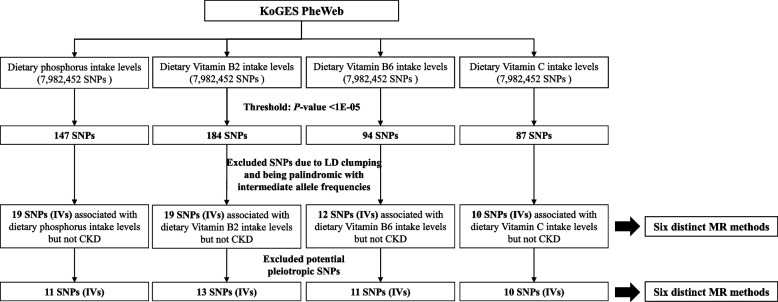 Figure 2
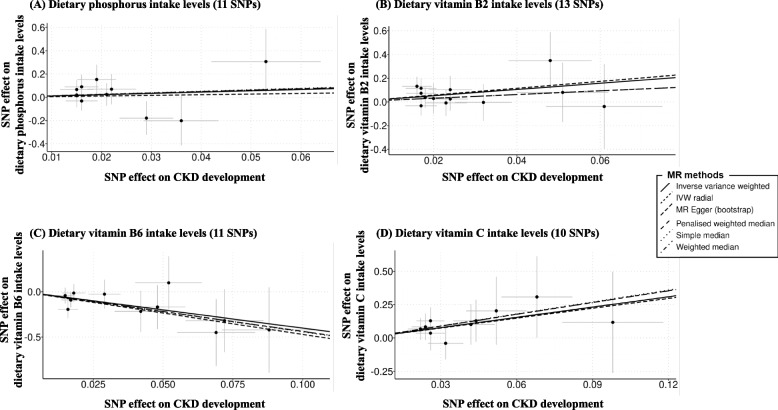 Figure 3
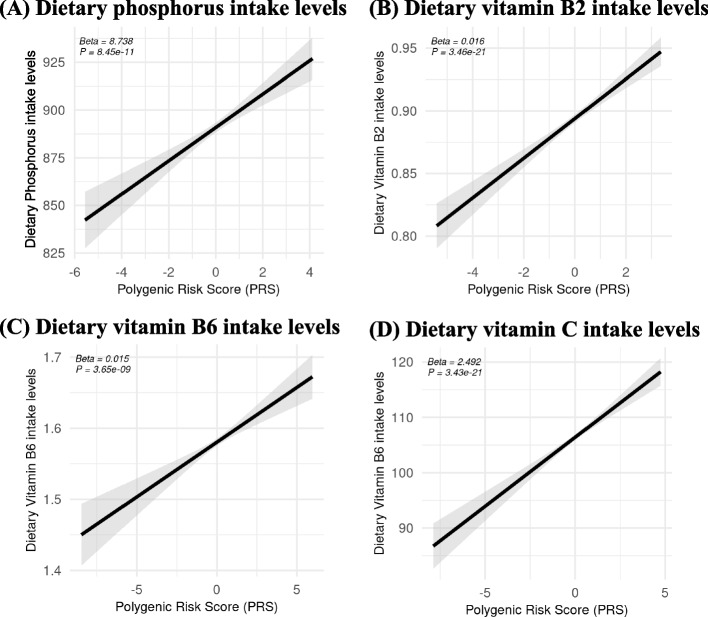 Figure 4
- —the National Research Foundation (NRF)
- —the Korean government (MSIT)
Peer Reviews
No public reviews on file for this paper yet. If you reviewed it on a platform where reviews are public (OpenReview, ICLR, NeurIPS, ICML), you can paste yours below so the community can read it here.
Videos
No videos yet. Explain this paper in a talk, walkthrough, or lecture? Add one.
Taxonomy
TopicsFolate and B Vitamins Research · Iron Metabolism and Disorders · Nutrition and Health in Aging
Background
Chronic Kidney Disease (CKD) represents a significant global health challenge, with its increasing prevalence and associated adverse outcomes, including elevated morbidity and mortality rates [1, 2]. The complexity of CKD pathogenesis involves a myriad of factors, among which micronutrients have received substantial attention. Micronutrients, such as vitamins and minerals, play crucial roles in various physiological processes, including immune function, oxidative stress modulation, and metabolic regulation, which are vital for maintaining overall health and potentially influencing CKD development and management [3, 4].
Phosphorus is essential for bone health and cellular function, yet its excess has been implicated in CKD development. By examining genetic proxies for phosphorus intake, we aim to clarify its role in CKD development [5]. Riboflavin (vitamin B2) is crucial for energy production and cellular function, and investigating its causal relationship with CKD could provide insights into metabolic factors contributing to kidney health [6]. Vitamin B6 is involved in protein metabolism and immune function, and understanding its causal link with CKD may reveal important aspects of nutrient metabolism affecting kidney disease [7]. Vitamin C, a potent antioxidant, plays a role in reducing oxidative stress and inflammation, and exploring its causal effect on CKD could highlight its potential as a preventive or therapeutic agent [8].
Observational studies have suggested potential links between micronutrient levels and CKD outcomes [9, 10]. However, these studies often encounter difficulties in establishing causal relationships due to the presence of confounding variables and the inherent issue of reverse causation. Confounding factors, such as dietary habits, lifestyle choices, and pre-existing health conditions, can influence both micronutrient levels and CKD risk, making it challenging to discern the true nature of these associations. To address these limitations, Mendelian randomization (MR) analysis has emerged as a robust methodological approach [11]. MR uses genetic variants as instrumental variables to determine causal relationships between exposures (e.g., micronutrient levels) and outcomes (e.g., CKD risk). As genetic variants are randomly assigned at conception and are not influenced by confounding factors, MR offers a more reliable method for exploring causality compared to traditional observational studies [12]. The selection of phosphorus, vitamin B2, vitamin B6, and vitamin C as exposures in this study was guided by evidence from our previous prospective cohort study, which reported significant associations between dietary intake of these micronutrients and the risk of developing CKD [9]. These findings provided the rationale for including these four micronutrients in the present Mendelian randomization analysis to explore their potential causal roles in CKD pathogenesis.
This study aims to utilize MR analysis to investigate the potential causal effects of several key micronutrients—phosphorus, vitamin B2, vitamin B6, and vitamin C— on the risk of developing CKD. By employing genetic variants associated with these micronutrients as instrumental variables, we seek to disentangle the complex interactions between micronutrient status and CKD development.
Methods
Data source and study population
Information regarding KoGES can be found in the previous cohort profile article published by the KCDC (Korea Centers for Disease Control and Prevention) [13]. After obtaining ethical clearance, we acquired survey data and genomic information from the KCDC for our analysis. For our analysis, we utilized cohort data from the KARE project. The KARE project, which began in 2007, is a substantial cohort study that recruited two population samples from the rural Anseong and urban Ansan cohorts [14]. Among the 5,493 participants in the KARE cohort study, 415 subjects were excluded due to missing data on exposure variables (genotyping, nutritional data) and failure to meet quality control standards. The final analysis included 5,078 subjects (Fig. 1). To investigate the association between dietary micronutrient intake levels and the development of CKD in a Korean population, we selected GWAS summary statistics for dietary micronutrient intake levels through a meta-analysis from the Korean Biobank Array (KoGES PheWeb, available at https://koges.leelabsg.org/, assessed January 5, 2024). This analysis included 584,061 SNPs from 708 new CKD cases and 4,370 controls. The K-CHIP consortium, a project initiated by the Center for Genome Science at the National Institute of Health in Korea, includes a specially curated panel of around 830,000 SNPs tailored for the Korean population (4845–301, 3000–3031) [15]. This custom SNP array was developed to enhance genetic research and its relevance to the Korean demographic. Comprehensive procedures for quality control and the methodologies for imputation within the K-CHIP consortium have been thoroughly documented in previous studies [16].Fig. 1. Flow chart of the study population selection from the KARE GWAS and MR study. KARE, Korean Association Resource; GWAS, genome-wide association study; MR, Mendelian randomization
All procedures performed in studies involving human participants were in accordance with the ethical standards of the institutional and/or national research committee and with the 1964 Helsinki declaration and its later amendments or comparable ethical standards. The National Institute of Health, Korea (IRB number 4845–301, 3000–3031) and the Institutional Review Boards of Seoul National University Hospital (C-1704–025–842 and 2101–087–1188) approved this study.
Outcome variables
CKD was defined as having an estimated glomerular filtration rate (eGFR) below 60 mL/min/1.73 m^2^, aligning with the clinical practice guideline of the National Kidney Foundation Kidney Disease Outcomes Quality Initiative (NKF KDOQI) [17]. A new case of CKD was identified as an eGFR decline to less than 60 mL/min/1.73 m^2^ during a follow-up period spanning from 2 to up to 12 years among cohort members initially presenting with an eGFR exceeding 60 mL/min/1.73 m^2^ at baseline. The eGFR was computed using the CKD-EPI equation, represented as Equation [18].
\documentclass[12pt]{minimal} \usepackage{amsmath} \usepackage{wasysym} \usepackage{amsfonts} \usepackage{amssymb} \usepackage{amsbsy} \usepackage{mathrsfs} \usepackage{upgreek} \setlength{\oddsidemargin}{-69pt} \begin{document}$$\text{eGFR}=141\times \text{min}{(\frac{Scr}{k})}^{\alpha }\times \text{max}{(\frac{Scr}{k})}^{-1.209}\times {0.993}^{Age}\times 1.018\left[if female\right]$$\end{document}Scr = serum creatinine (mg/dL);
k = 0.7 if female; 0.9 if male;
α = − 0.329 if female; − 0.411 if male;
min = the minimum of Scr/k or 1;
max = the maximum of Scr/k or 1.
Exposure variables
Measurements
Daily nutrient intakes were evaluated utilizing a validated, semi-quantitative Food Frequency Questionnaire (FFQ) specifically designed for the KoGES [19]. Participants were requested to estimate both the average serving size of 106 food items and their consumption frequency. Dietary intakes per day were determined by amalgamating the frequency of servings and portion sizes for each food item with the mean amount per serving. A previous study evaluated the validity and reliability of the FFQ used in the KoGES dataset employed in this research [19]. To assess the reproducibility and validity of the FFQ, it was administered twice at a one-year interval, and three-day dietary records (DR) were collected at each time point for comparison. The analysis revealed correlation coefficients ranging from 0.38 to 0.64 for major nutrient intakes, suggesting that the FFQ is a reliable tool for assessing dietary intake among Korean adults.
All specimens collected were promptly transferred to the Korean National Biobank, ensuring the previously documented reliability of biomarker analyses [16]. Blood and urine samples were acquired using a serum separator tube (SST) and a two-ethylene diamine tetra acetic acid (EDTA) tube, along with a 10 mL midstream urine sample. Post-collection, both serum and plasma underwent meticulous preparation and aliquoting. Blood DNA extraction yielded amounts ranging from 100 to 800 µg, with 6–10 vials (300–500 µL per vial) carefully prepared. Each tube was tagged with a two-dimensional barcode for precise identification. Serum creatinine levels were assessed using the Jaffe method, employing a HITACHI Automatic Analyzer 7600 (Hitachi, Tokyo, Japan), and an ADVIA 1650 Auto Analyzer (Siemens, Washington, DC, USA). The methodologies utilized in sample processing and analysis to established standards, ensuring the robustness and accuracy of the collected data in accordance with rigorous medical research practices.
Genotyping and quality control
Genomic DNA was isolated from venous blood samples and genotyped using the Affymetrix Axiom™ KORV1.0–96 Array (Affymetrix, Santa Clara, CA, USA), with 200 ng of genomic DNA utilized for the process. Quality control was conducted using the PLINK program (version 1.9; Free Software Foundation Inc., Boston, MA, USA), leading to the exclusion of samples exhibiting sex inconsistencies or having a call rate below 97%. SNPs were filtered based on criteria such as a call rate below 95%, a minor allele frequency lower than 1%, and significant deviation from the Hardy–Weinberg equilibrium permutation test (P < 5 × 10^−5^).
Assumption of one sample mendelian randomization
One-sample MR analyses were performed to investigate the existence of a causal relationship between micronutrients (dietary phosphorus, vitamin B2, B6 and C) and development of CKD. MR necessitates that genetic instruments are associated with a modifiable exposure of interest (assumption 1), and any relationship between the instruments and outcome is mediated through the exposure (assumption 2). The instrumental variable must affect the outcome only via its effect on the exposure (assumption 3).
The MR results were obtained using six methods: Inverse Variance Weighted (IVW), MR-Egger, Weighted Median, Penalized Weighted Median, Simple Median, and Radial IVW.
- IVW: The IVW method combines effect estimates from genetic instruments by assigning weights proportional to the inverse of their variances. This approach is highly efficient and statistically robust when horizontal pleiotropy is absent. However, it assumes no intercept in the model, which may limit its reliability if pleiotropic effects are present.
- MR-Egger: The MR-Egger method incorporates an intercept term into the model to address potential directional pleiotropy, allowing for variations in pleiotropic effects across genetic instruments. While this method is particularly effective in managing heterogeneity, it tends to have lower statistical power compared to the IVW method.
- Weighted Median: The Weighted Median method generates consistent causal effect estimates, even when up to 50% of the genetic instruments are invalid, provided the instrument strength independent of direct effects (InSIDE) assumption is met.
- Penalized Weighted Median: This technique extends the Weighted Median approach by introducing penalties for outlier SNPs with significant deviations. By minimizing the impact of such outliers, it enhances the robustness of causal effect estimates and ensures greater reliability.
- Simple Median: The Simple Median method calculates the causal effect based on the median value of individual SNP effect estimates. Although it is less precise than the Weighted Median or Penalized Weighted Median, it provides a viable option when the number of valid instruments is small.
- Radial IVW: Radial IVW modifies the standard IVW approach by using a radial regression framework to identify and adjust for outlier SNPs that contribute disproportionately to heterogeneity. This method is particularly useful for addressing complex pleiotropic effects, resulting in more refined and reliable effect estimates [20].
Statistical analysis
From the GWAS summary statistics encompassing 7,982,452 SNPs related to dietary micronutrient levels from the KoGES PheWeb, SNPs meeting a suggestive significance threshold of p < 1 × 10⁻^5^ were identified as statistically significant (Fig. 2). Given that GWAS-summary statistics were analyzed independently for each dietary micronutrient (phosphorus, vitamin B2, vitamin B6, and vitamin C), multiple testing correction across these micronutrients was not applied. Each nutrient was considered as an independent exposure, thus mitigating the risk associated with multiple comparisons across different exposures. Specifically, 147 SNPs for phosphorus, 184 SNPs for vitamin B2, 94 SNPs for vitamin B6, and 87 SNPs for vitamin C were selected based on statistical significance. SNPs were subsequently filtered through LD clumping and exclusion of palindromic SNPs with intermediate allele frequencies (Fig. 2). SNPs unrelated to CKD were further selected as instrumental variables (IVs) for each dietary micronutrient, resulting in 19 IVs for phosphorus, 19 for vitamin B2, 12 for vitamin B6, and 10 for vitamin C (Fig. 2). For additional sensitivity analysis, previously reported mapped phenotypes for each SNP were examined through the GWAS Catalog (https://www.ebi.ac.uk/gwas/), aiming to identify potential pleiotropic SNPs. After this process, final IV selections included 11 SNPs for phosphorus, 13 for vitamin B2, 11 for vitamin B6, and 10 for vitamin C (Fig. 2).Fig. 2. Overview of the selection IVs associated with dietary micronutrient levels but not CKD for MR analysis. KoGES, the Korean genome and epidemiology study; SNPs, single nucleotide polymorphism; LD, linkage disequilibrium; CKD, chronic kidney disease; IV, instrumental variable; MR, Mendelian randomization
MR analysis was performed using genetic instrumental variables to evaluate the causal relationship between dietary micronutrient levels and the development of CKD. To ensure a robust assessment of the association between dietary micronutrients and CKD risk, we employed six distinct methods (MR Egger regression, Inverse Variance Weighted, Simple median, Weighted Median, Penalized Weighted Median, and Inverse Variance Weighted Radial method) during the MR analysis [20].
To validate the associations between the selected IVs and each dietary micronutrient level, polygenic risk scores (PRS) were constructed based on the selected IVs and their corresponding effect sizes. Linear regression models were performed to evaluate associations between the PRS and actual dietary micronutrient intake levels. The PRS was estimated using the following formula [21]:
\documentclass[12pt]{minimal} \usepackage{amsmath} \usepackage{wasysym} \usepackage{amsfonts} \usepackage{amssymb} \usepackage{amsbsy} \usepackage{mathrsfs} \usepackage{upgreek} \setlength{\oddsidemargin}{-69pt} \begin{document}$$PRS= {\sum }_{i=1}^{n}{\beta }_{i}\times {SNP}_{i} ({SNP}_{i} consided as {IV}_{i})$$\end{document}where \documentclass[12pt]{minimal} \usepackage{amsmath} \usepackage{wasysym} \usepackage{amsfonts} \usepackage{amssymb} \usepackage{amsbsy} \usepackage{mathrsfs} \usepackage{upgreek} \setlength{\oddsidemargin}{-69pt} \begin{document}$${\beta }_{i}$$\end{document} is the effect size for the \documentclass[12pt]{minimal} \usepackage{amsmath} \usepackage{wasysym} \usepackage{amsfonts} \usepackage{amssymb} \usepackage{amsbsy} \usepackage{mathrsfs} \usepackage{upgreek} \setlength{\oddsidemargin}{-69pt} \begin{document}$${i}^{th}$$\end{document} SNP obtained from GWAS and \documentclass[12pt]{minimal} \usepackage{amsmath} \usepackage{wasysym} \usepackage{amsfonts} \usepackage{amssymb} \usepackage{amsbsy} \usepackage{mathrsfs} \usepackage{upgreek} \setlength{\oddsidemargin}{-69pt} \begin{document}$${SNP}_{i}$$\end{document} is the genotype dosage of the \documentclass[12pt]{minimal} \usepackage{amsmath} \usepackage{wasysym} \usepackage{amsfonts} \usepackage{amssymb} \usepackage{amsbsy} \usepackage{mathrsfs} \usepackage{upgreek} \setlength{\oddsidemargin}{-69pt} \begin{document}$${i}^{th}$$\end{document} SNP.
Additionally, in our study, we employed the Mendelian Randomization Pleiotropy RESidual Sum and Outlier (MR-PRESSO) method as part of the Mendelian Randomization analysis to assess the causal relationships between micronutrient levels and CKD development [22]. MR-PRESSO is a robust statistical approach designed to detect and correct for horizontal pleiotropy, which occurs when genetic variants used as instrumental variables affect the outcome through pathways other than the exposure of interest. This method enhances the reliability of causal inferences by addressing potential biases introduced by pleiotropic effects.
Results
General characteristics
The CKD development group exhibited characteristics such as older age, a higher proportion of females, and increased prevalence of diabetes and hypertension. Non-smokers were more common in the non-CKD group, with no significant difference in physical activity levels observed between the groups. Anthropometrically, individuals with CKD development had a higher mean BMI, elevated blood pressure readings, and elevated serum creatinine levels. Additionally, HDL cholesterol levels were lower in the CKD development group. In terms of dietary habits, the CKD development group generally demonstrated lower intake of minerals and vitamins, with the exception of vitamin C, where intake was higher in the CKD development group Table 1.Table 1. General characteristics of the study subjectsNew CKD cases at follow-up from 2 to 12 yearsP**-value**^b^CKD development^a^Non-CKD^a^N = 708N = 4,370Mean (SD)Mean (SD)Dietary micronutrients levels Dietary minerals Calcium intake (mg/day)459.7 (267.4)485.5 (270.1)0.02 Phosphorus intake (mg/day)998.0 (410.4)1039.3 (419.3)0.01 Sodium intake (mg/day)3232.1 (1688.8)3210.5 (1637.8)0.75 Potassium intake (mg/day)2528.9 (1219.2)2566.0 (1198.6)0.44 Iron intake (mg/day)10.7 (5.0)11.1 (5.4)0.04 Zinc intake (mg/day)8.6 (5.4)9.0 (4.5)0.08Dietary vitamins Vitamin A intake (μg/day)505.2 (345.8)546.5 (411.9)0.01 Retinol intake (μg/day)60.4 (69.4)70.0 (61.3) < 0.01 Carotene intake (μg/day)2606.7 (1964.5)2796.9 (2403.0)0.04 Vitamin B1 intake (mg/day)1.2 (0.5)1.3 (0.6)0.01 Vitamin B2 intake (mg/day)0.9 (0.5)1.0 (0.5) < 0.01 Niacin intake (mg/day)14.8 (6.3)16.0 (7.0) < 0.01 Vitamin B6 intake (mg/day)1.8 (0.8)1.8 (0.8)0.04 Folate intake (μg/day)246.1 (129.1)249.9 (132.4)0.47 Vitamin C intake (mg/day)133.1 (97.9)129.2 (97.8)0.32Age (years)59.3 (7.7)50.6 (8.3) < 0.01Body mass index (kg/mg^2^)25.1 (3.4)24.5 (3.1) < 0.01Systolic blood pressure (mmHg)128.6 (20.6)119.0 (18.1) < 0.01Diastolic blood pressure (mmHg)82.8 (11.7)79.2 (12.1) < 0.01Serum creatinine (mg/dL)0.9 (0.2)0.8 (0.2) < 0.01Serum hemoglobin (g/dL)13.5 (1.4)13.6 (1.6)0.07HDL cholesterol (mg/dL)48.5 (11.9)49.9 (11.9) < 0.01N (%)N (%)**Sex < 0.01 Male277 (39.1)2128 (48.7) Female431 (60.9)2242 (51.3)Smoking status0.01 No452 (63.8)2531 (57.9) Yes249 (35.2)1805 (41.3)Physical activity0.30 No362 (51.1)2111 (48.3) Yes336 (47.5)2177 (49.8)Diabetes mellitus^c^ < 0.01 No574 (81.1)4058 (92.9) Yes134 (18.9)312 (7.1)Hypertension^d^ < 0.01 No425 (60.0)3240 (74.1) Yes283 (39.9)1130 (25.9)^a^CKD was defined as a ‘eGFR < 60 mL/min/1.73 m2’, in compliance with the National Kidney Foundation Kidney Disease Outcomes Quality Initiative (NKF KDOQI) clinical practice guideline. A new case of CKD was defined as a eGFR decline to < 60 mL/min/1.73 m2 over a follow-up period ranging from 2 to up to 12 years among cohort members with an eGFR greater than 60 mL/min/1.73 m2 at the time of baseline^b^For continuous variable, T-test was used. For categorical variables, chi-square test was used^c^DM defined as history of diabetes mellitus or elevated plasma glucose ≥ 100 mg/dl or taking anti-diabetic medicationsKARE, Korea Association resource^d^HTN defined as history of hypertension, SBP > 130 mmHg or DBP > 85 mmHg or taking anti-hypertensive medications
GWAS study
After undergoing data quality control processes, we present in Supplementary Tables 1 to 4 the SNPs associated with dietary micronutrients, including phosphorus, vitamin B2, B6, and C. These tables include information such as chromosome number, position within the chromosome, SNP name, nearest gene, alleles, minor allele frequency (MAF), beta coefficient, standard error (SE), and p-value. A total of 62 SNPs were identified for dietary phosphorus intake, 56 SNPs for vitamin B2, 66 SNPs for vitamin B6, and 50 SNPs for vitamin C, all of which exhibited a p-value < 1e-5. Furthermore, we validated the results of the GWAS analysis through the utilization of a Manhattan plot (Supplementary Fig. 1 to 4).
MR analysis
The summary statistics for SNPs selected as IVs for each dietary micronutrient, including beta coefficients, SEs, p-values, risk alleles, and risk allele frequencies, are presented in Supplementary Tables 5–8. After excluding SNPs identified as potential sources of pleiotropy, summary statistics for the remaining SNPs utilized as IVs are detailed in Tables 2, 3, 4 and 5.Table 2. Associations of individual genetic instruments for dietary phosphorus intake levels with CKD development, after excluding potential pleiotropic SNPsCHRSNPNearest GenesMapped phenotypesEffect alleleMAFDietary phosphorus intake levelsCKD developmentBeta****SEP**-valueBetaSEP-value17rs8074317SEPTIN9Phosphorus, Vitamin B2 intakeT0.220−0.0210.00366.00E-09−0.0240.0990.80614rs138424249LRFN5Phosphorus intakeA0.0920.0290.00546.20E-08−0.1790.1450.2187rs930110FZD1Phosphorus intakeG0.5300.0150.0032.50E-070.0190.1030.8502rs10193255RBM43Phosphorus intakeC0.330−0.0160.00324.20E-070.0320.0840.7008rs77133047DOK2Phosphorus intakeT0.180−0.0190.00391.10E-06−0.1530.1290.23411rs7126868PRMT3Phosphorus intakeC0.3400.0150.00321.50E-060.0140.1010.88918rs78281436MYO5BPhosphorus intake, HDLC0.046−0.0360.00751.50E-060.2020.2150.3475rs145817449MROH2BPhosphorus intake, Gastric cancerC0.018−0.0530.0112.70E-06−0.3070.2800.27211rs365215PLEKHA7Phosphorus intake, BMIC0.2800.0160.00343.30E-060.0900.1040.3854rs2567388EMCNPhosphorus intake, HyperlipidemiaT0.300−0.0150.00334.70E-06−0.0670.0840.42710rs7902081HMX3Phosphorus intakeC0.130−0.0220.00495.40E-06−0.0700.1310.595SNP Single nucleotide polymorphism, MAF Minor allele frequency, SE Standard error, WC Waist circumference, TC Total cholesterol, HDL High-Density Lipoprotein, BMI Body mass index, DM Diabetes mellitus, LDL Low-Density LipoproteinTable 3Associations of individual genetic instruments for dietary vitamin B2 intake levels with CKD development, after excluding potential pleiotropic SNPsCHRSNPNearest GenesMapped phenotypesEffect alleleMAFDietary vitamin B2 intake levelsCKD developmentBetaSEP-valueBetaSEP-value**17rs8074201SEPTIN9Vitamin B2, Phosphorus intakeT0.220−0.0240.0043.90E-08−0.0240.0990.8041rs147957210PRKCZVitamin B2 intake, BMIG0.032−0.0480.0101.60E-06−0.3490.2390.14413rs141095648NUFIP1Vitamin B2, Sodium intakeA0.075−0.0320.0072.80E-060.0040.1560.9803rs17018468LRRC3BVitamin B2, Iron, Calcium intakeG0.290−0.0180.0043.20E-06−0.0370.0870.6675rs1974852EMBVitamin B2 intake, DMA0.170−0.0230.0053.40E-060.0080.1100.9403rs80277692NMD3Vitamin B2 intake, Gastric cancerG0.140−0.0240.0053.60E-06−0.1040.1170.3732rs1485984KCNH7Vitamin B2 intake, CreatinineT0.3800.0170.0044.20E-060.0740.0820.36810rs72822548SORBS1Vitamin B2 intake, RBCA0.370−0.0170.0044.30E-06−0.1160.0850.1742rs10193255RBM43Vitamin B2, Phosphorus intakeC0.330−0.0170.0046.40E-060.0320.0840.7007rs1346667FZD1Vitamin B2, Phosphorus, Calcium intakeG0.2000.0200.0057.20E-060.0290.1280.8209rs10973705SHBVitamin B2, Calcium intakeT0.470−0.0160.0048.70E-06−0.1330.0810.1004rs185500746FBXW7Vitamin B2 intake, DMC0.024−0.0510.0118.70E-06−0.0800.2530.7506rs146438270LRFN2Vitamin B2 intake, BMIT0.020−0.0610.0149.60E-060.0380.3580.915SNP Single nucleotide polymorphism, MAF Minor allele frequency, SE Standard error, RBC Red blood cell, BMI Body mass index, DM Diabetes mellitusTable 4Associations of individual genetic instruments for dietary vitamin B6 intake levels with CKD development, after excluding potential pleiotropic SNPsCHRSNPNearest GenesMapped phenotypesEffect alleleMAFDietary vitamin B6 intake levelsCKD developmentBetaSEP-valueBetaSEP-value**3rs145928548NSUN3Vitamin B6 intakeT0.015−0.0720.0149.20E-080.3190.3510.3635rs184559817HMHB1Vitamin B6 intake, HeightA0.0100.0880.0171.50E-07−0.4210.4720.3723rs148237512NSUN3Vitamin B6 intakeT0.015−0.0690.0145.30E-070.4500.3690.22319rs77055181NPHS1Vitamin B6, Iron intake, CreatinineA0.086−0.0290.0067.10E-070.0270.1600.8679rs4742795CAVIN4Vitamin B6, Niacin intakeA0.3800.0170.0048.90E-07−0.0910.0840.27910rs141302176ADAM12Vitamin B6, Niacin, Iron intakeA0.026−0.0480.0102.10E-060.1690.2430.4861rs2071987VAMP3Vitamin B6, Iron, Folate intakeA0.3900.0150.0035.60E-06−0.0430.0870.6231rs375382680ATP2B4Vitamin B6, Fiber, Iron intakeT0.020−0.0520.0127.40E-06−0.0990.2940.7376rs12192239DLL1Vitamin B6, Iron, Folate intakeT0.630−0.0160.0047.90E-060.1950.0970.0452rs35280662AC007040.2Vitamin B6, Ash, Sodium intakeA0.035−0.0420.0098.10E-060.2170.2290.3443rs9289799PFN2Vitamin B6, Iron, Niacin intakeG0.2000.0180.0049.50E-06−0.0150.0990.883KARE Korea Association resource, SNP Single nucleotide polymorphism, MAF Minor allele frequency, SE Standard errorTable 5Associations of individual genetic instruments for dietary vitamin C intake levels with CKD development, after excluding potential pleiotropic SNPsCHRSNPNearest GenesMapped phenotypesEffect alleleMAFDietary vitamin C intake levelsCKD developmentBetaSEP-valueBeta**SEP-value**1rs140394939PDE4BVitamin C, Carotene intakeA0.015−0.0980.0201.20E-06−0.1170.3800.7582rs16846116LRP1BVitamin C, Weight, BMIA0.0700.0440.0091.20E-060.1290.1590.4168rs147902155SNAI2Vitamin C, Potassium, Vitamin B2 intakeA0.029−0.0680.0142.00E-06−0.3080.3060.3151rs12031723PTBP2Vitamin C, Fiber, Potassium intakeC0.250−0.0260.0062.90E-06−0.1290.1010.2015rs76463900HDAC3Vitamin C intake, WBC, HeightA0.1400.0320.0074.60E-06−0.0410.1200.7345rs10074128PRLRVitamin C, A, Folate intake, BUNG0.3900.0220.0056.90E-060.0670.0830.4157rs2521745NPVFVitamin C, Fiber, Vitamin B6, Carotene intakeA0.8000.0260.0067.30E-060.0360.1310.7852rs3828277TNS1Vitamin C, Potassium intake, HbA1 CT0.065−0.0420.0097.50E-06−0.1010.1530.5088rs146782291C8orf37Vitamin C, Fiber intake, Colorectal cancerA0.0440.0520.0128.90E-060.2030.2560.4271rs898833STUMVitamin C, Vitamin B6, Fiber intakeT0.230−0.0240.0069.40E-06−0.0830.1000.406SNP Single nucleotide polymorphism, MAF Minor allele frequency, SE Standard error, BUN Blood Urea Nitrogen, BMI Body mass index, WBC White Blood Cell, HbA1 C Glycated Hemoglobin
MR analyses were performed to examine the causal effects of dietary phosphorus, vitamin B2, B6, and vitamin C intake levels on CKD development risk, with primary results focusing on analyses after removing potentially pleiotropic SNPs. Table 6 summarizes these primary MR estimates, while Supplementary Table 9 provides MR estimates obtained from the complete set of SNPs (including potential pleiotropic SNPs).Table 6. Mendelian randomization results for the effects of dietary phosphorus and vitamin B2, B6, and C intake on CKD development, after excluding potential pleiotropic SNPsMicronutrient levelsSNPsBETASEp-valueDietary phosphorus intake levels IVW111.1101.7285.20E-01 IVW radial111.1111.3974.27E-01 MR Egger110.2615.1394.75E-01 Penalised weighted median111.2252.3786.06E-01 Weighted median111.2252.3105.96E-01 Simple median111.2932.4385.96E-01Dietary Vitamin B2 intake levels IVW132.6371.3765.53E-02 IVW radial132.6370.9043.54E-03 MR Egger133.0943.3681.72E-01 Penalised weighted median131.5671.8874.06E-01 Weighted median131.5671.7913.82E-01 Simple median131.5781.9034.07E-01Dietary Vitamin B6 intake levels IVW11−4.0141.6241.35E-02 IVW radial11−4.0161.0238.72E-05 MR Egger11−4.4774.1341.31E-01 Penalised weighted median11−4.3772.1934.59E-02 Weighted median11−4.3772.1594.27E-02 Simple median11−4.4312.2354.75E-02Dietary Vitamin C intake levels IVW102.5721.2754.37E-02 IVW radial102.5730.5921.41E-05 MR Egger102.0923.4395.59E-01 Penalised weighted median102.9521.6216.86E-02 Weighted median102.9521.6266.94E-02 Simple median102.9971.5385.14E-02CKD Chronic kidney disease, SNP Singel nucleotide polymorphism, SE Standard error, IVW Inverse variance weighted, MR Mendelian randomization
After excluding potentially pleiotropic SNPs, dietary vitamin B6 intake levels consistently showed significant negative associations with CKD development across various MR methods. Specifically, the IVW method yielded a significant negative association (beta = −4.014, SE = 1.624, p = 1.35E-02), and this result was further supported by the IVW radial method (beta = −4.016, SE = 1.023, p = 8.72E-05). Additional methods including Penalized Weighted Median, Weighted Median, and Simple Median also demonstrated significant negative associations with p-values of 4.59E-02, 4.27E-02, and 4.75E-02, respectively.
For dietary vitamin C intake, after removal of potential pleiotropy, the IVW method indicated a significant positive association with CKD development (beta = 2.572, SE = 1.275, p = 4.37E-02), more supported by the IVW radial method (beta = 2.573, SE = 0.592, p = 1.41E-05).
Figure 3 shows scatter plots of the estimated effects of SNPs (after excluding SNPs with potential pleiotropic effects) on dietary micronutrients levels against the estimated effects of SNPs on the development of CKD. Supplementary Fig. 5 shows scatter plots without excluding potential pleiotropic SNPs, and the results were consistent with those of Fig. 3.Fig. 3. Scatter plots comparing MR analyses of the associations between dietary micronutrient levels and CKD development. Associations between genetic IVs for dietary micronutrient levels (after excluding SNPs with potential pleiotropic effects) and CKD development were analyzed using different MR methods. MR, Mendelian randomization; CKD, chronic kidney disease; IV, instrumental variable; SNP, single nucleotide polymorphism
Supplementary Fig. 6 demonstrates statistically significant associations between PRS derived from IVs and actual dietary micronutrient intake levels based on linear regression models. Specifically, phosphorus (beta = 10.596, p = 3.56E-15), vitamin B2 (beta = 0.020, p = 1.37E-31), vitamin B6 (beta = 0.016, p = 7.30E-10), and vitamin C (beta = 2.492, p = 3.43E-21) each showed significant correlations, confirming the validity of the IVs after excluding potential pleiotropic SNPs for these dietary micronutrients (Fig. 4).Fig. 4. Associations between the PRS derived from IVs—after excluding potential pleiotropic SNPs—and dietary micronutrient levels, based on linear regression models. Black lines indicate beta coefficients, and grey shaded areas represent their 95% CIs. IV, instrumental variable; PRS, polygenic risk score; CI, confidence interval
Overall, the results suggest a negative causal effect of dietary Vitamin B6 intake on CKD development, while dietary Vitamin C intake levels showed a potential positive association that warrants further investigation. No significant associations were found for dietary phosphorus and Vitamin B2 intake levels.
Pleiotropy test
The Pleiotropy test was conducted using MR-Egger regression, a sensitivity analysis of the IVW. The intercept in the MR-Egger regression model was estimated to be 0.059 for phosphorus, 0.044 for vitamin B2, −0.026 for vitamin B6, 0.016 for vitamin C with a p-value of 0.589, 0.637 0.752 and 0.884, respectively, indicating that there was no directional horizontal pleiotropy (Table 7). Also, the Funnel Plot indicated the absence of direct horizontal pleiotropy in this study (Supplementary Fig. 7). Furthermore, we also conducted the MR-PRESSO global test, yielding p-values of 0.779 for phosphorus, 0.779 for vitamin B2, 0.953 for vitamin B6, and 0.895 for vitamin C. These results confirm the absence of vertical pleiotropy (Table 7). Notably, results in Table 7 represent analyses conducted after excluding potential pleiotropic SNPs identified by MR-PRESSO, whereas Supplementary Table 10 presents prior to excluding these potential pleiotropic SNPs.Table 7. Results of pleiotropy test for the association between dietary micronutrients levels and CKD development, after excluding pleiotropic SNPsDietary micronutrients levelsSNPs, nInterceptSEp-valueMR-PRESSO p-valuePhosphorus110.0590.1060.5890.779Vitamin B2130.0440.0900.6370.779Vitamin B611−0.0260.0790.7520.953Vitamin C100.0160.1110.8840.895SNP Single nucleotide polymorphism
Discussions
The present study utilized Mendelian randomization analysis to explore the relationship between dietary phosphorus and vitamin B2, vitamin B6 and vitamin C and the risk of CKD development. Based on the findings of this study, there was a weak causal link between genetically predicted levels of vitamins B6 and C and CKD development. In contrast, no significant causal relationship was observed between dietary phosphorus and vitamin B2 intake levels and the development of CKD.
Our findings align with prior research. One MR investigation explored the link between phosphorus levels in the bloodstream and CKD in a Chinese cohort [23]. Moreover, this investigation concluded that there is no indication of an association between phosphorus levels in circulation and CKD risk. Genetic variations may play a role in regulating phosphorus levels in the body, managing phosphate concentrations in the bloodstream, and modulating inflammatory responses in kidney tissues [24, 25]. For example, polymorphisms in the FGF23 (fibroblast growth factor 23), KL (Klotho), and PTH (parathyroid hormone) genes have been identified as critical regulators of phosphate homeostasis. The FGF23 gene promotes phosphate excretion via renal tubules and inhibits vitamin D activation [26], while KL polymorphisms can alter the activity of FGF23, influencing phosphate transport and renal function [27]. Variants in the PTH gene affect parathyroid hormone levels, thereby modulating calcium-phosphate metabolism and potentially contributing to CKD pathophysiology [28]. Despite these findings, previous studies have consistently reported no significant association between serum phosphorus levels and CKD risk, suggesting that phosphorus homeostasis alone may not be a direct contributor to CKD development. Instead, it is likely influenced by complex interactions between genetic, metabolic, and environmental factors. These findings highlight the need for further exploration of how genetic variations interact with systemic processes to affect kidney function.
This study demonstrated that there is no causal link between dietary intake of vitamin B2 and the development of CKD. To date, there has been no investigation into the relationship between vitamin B2 and CKD utilizing MR analysis. Vitamin B2 plays a role in nucleic acid and protein metabolism, thereby contributing to cellular energy production. Moreover, it exhibits antioxidant properties, reducing oxidative stress and shielding cells from damage [29, 30]. These biological pathways may elucidate the connection between vitamin B2 intake and CKD incidence. From a genetic perspective, polymorphisms in genes encoding enzymes dependent on riboflavin, such as MTHFR (methylenetetrahydrofolate reductase) and GSS (glutathione synthetase), could influence the efficiency of cellular energy production and antioxidant pathways [31, 32]. For instance, the MTHFR C677 T polymorphism, which affects folate metabolism, is known to alter homocysteine levels, potentially impacting renal function through increased oxidative stress and vascular damage [33]. Similarly, variations in the GSS gene may impair glutathione synthesis, reducing antioxidant defense mechanisms critical for protecting renal tissues from oxidative damage [34]. Based on these findings, further research utilizing genetic factors is warranted to gain a deeper understanding of the relationship between vitamin B2 and kidney function.
This study revealed a weak causal link between genetically predicted levels of vitamin B6 and the risk of CKD development. A previous MR study also supported this finding, demonstrating that higher plasma levels of vitamin B6 were linked to a reduced risk of kidney calculus and CKD, utilizing data from the UK Biobank cohort [35]. Genetic variants associated with vitamin B6 metabolism, such as those near the PSTK and PDXK genes, have been implicated in the regulation of pyridoxal phosphate levels, the active form of vitamin B6 [36, 37]. These genes play a critical role in coenzyme activity and cellular processes related to amino acid metabolism, which may influence kidney function. Biologically, this observation may be attributed to the role of vitamin B6 in decreasing oxalate excretion in urine, thereby potentially lowering the risk of developing calcium oxalate kidney stones [38, 39]. Additionally, SNPs in genes like PDXK, AGXT, and GRHPR can influence oxalate metabolism by regulating gene expression and enzymatic activity [40, 41]. These variations may alter pyridoxal phosphate levels, affect oxalate excretion, and contribute to renal inflammation, thereby impacting individual susceptibility to CKD and kidney stone formation. Further investigation employing genetic factors is essential to gain a deeper understanding of the relationship between vitamin B6 and CKD development.
In addition, the study uncovered a potential weak positive correlation between dietary intake of vitamin C and the development of CKD. To date, no prior research utilizing MR analysis has directly investigated the association between vitamin C and CKD. Previous studies suggest that excessive intake of vitamin D may increase the risk of developing CKD. While vitamin C is known for its antioxidant and anti-inflammatory properties, excessive consumption may promote oxalate formation in the kidneys. This can lead to increased oxalate excretion, thereby elevating the risk of kidney stone formation, and, over time, result in kidney function impairment and progression to CKD [42, 43]. Additionally, high vitamin C intake can enhance iron absorption, potentially causing iron overload in the body. This may increase the production of reactive oxygen species (ROS), leading to oxidative damage to renal tissues [44]. From a genetic perspective, variations in genes involved in vitamin C transport and metabolism, such as SLC23 A1 and SLC23 A2, may influence vitamin C bioavailability and renal clearance [45]. For instance, polymorphisms in SLC23 A1, which encodes a sodium-dependent vitamin C transporter, have been associated with altered plasma and tissue concentrations of vitamin C, potentially modulating its effects on oxalate production and oxidative stress. Similarly, SNPs in genes regulating iron homeostasis, such as HFE and TF, could interact with high vitamin C intake to exacerbate oxidative damage through increased ROS production and iron overload in renal tissues [46, 47]. Therefore, the potential dual effects of vitamin C may vary depending on its intake level, metabolic status, and genetic factors. To better understand these interactions, further in-depth studies are warranted to explore the relationship between vitamin C and CKD. In particular, the use of genetic approaches, such as MR studies, is essential to evaluate the causal associations and provide more robust insights into this relationship.
However, the limitations of our study must be acknowledged. First, despite implementing rigorous quality control measures and utilizing a comprehensive dataset, the potential influence of unmeasured confounding factors on the observed associations cannot be completely disregarded. Second, the findings of this study are associated with variables indicative of a Weak Instrument (WI) in MR analysis, highlighting the importance of careful interpretation. WI occurs when the genetic variation has a minimal effect on the exposure variable. In such situations, the instrument variable has a weak correlation with the actual exposure variable, making the estimates derived using the instrument variable likely to be biased [48].
Third, the SNPs identified in this study as instrumental variables for dietary intake of phosphorus, vitamin B2, B6, and C did not overlap with previously reported genetic loci related to nutrient biomarkers or intake in large-scale GWAS. Notably, the lead SNPs (rs8074317 and rs8074201 in SEPTIN9, rs145928548 in NSUN3, and rs140394939 in PDE4B) have not been previously documented, suggesting the presence of novel or population-specific signals. To examine the biological plausibility of these associations, we reviewed the functional annotations of genes near the identified SNPs. Several loci, such as PDE4B and LRP1B, are involved in metabolic regulation and dietary behavior, indicating potential pathways influencing micronutrient intake [49, 50]. In contrast, well-known nutrient-related loci including SLC23 A1 (vitamin C) and ALPL (vitamin B6) were not detected in our analysis [51, 52]. These discrepancies may reflect differences in genetic architecture and dietary habits across populations, particularly given that our study was conducted in a Korean population, whereas most prior GWAS have focused on European cohorts. Collectively, these findings suggest that the genetic instruments identified in this study may represent East Asian–specific signals and offer novel insights into causal pathways linking micronutrient intake to CKD risk. Further replication in independent and diverse populations is warranted to validate the robustness and generalizability of these associations.
It is essential to proceed with caution as the efficacy of the instrument depends on both the magnitude and precision of the relationship between the genetic instrumental variables (IVs) and the risk factor. Fourth, Pleiotropy, the phenomenon where a single genetic variant influences multiple traits, is a critical consideration in MR studies. Confounding factors, which represent the distortion of causal relationships due to external factors or additional variables, can arise if pleiotropy is present in any form in MR research. Initially, we selected SNPs statistically identified as IVs associated with dietary micronutrient intake. To further ensure the robustness of our instruments, we conducted a comprehensive literature review and mapped phenotype analysis for each SNP. SNPs lacking prior evidence of association with dietary micronutrient intake specifically were categorized as potential pleiotropic SNPs and subsequently excluded from the primary MR analyses. This methodological refinement aimed to reduce pleiotropy and enhance the interpretability and validity of our results. Furthermore, statistical evaluations of pleiotropy were performed using the MR-Egger intercept test and MR-PRESSO global test, neither of which indicated significant horizontal pleiotropy, thus providing additional reassurance regarding the validity of our findings. Despite these precautions, residual pleiotropy cannot be completely ruled out. The IVs retained after this screening process may still have associations with traits such as body mass index (BMI), serum creatinine levels, or other nutrient intakes, potentially affecting our causal inference. Additionally, the typically modest correlation between dietary intake levels and circulating nutrient concentrations raises concerns regarding the biological validity of the selected IVs. Thus, these results should be viewed as indicative rather than definitive. We also emphasize that our findings should be viewed with an understanding of these potential residual pleiotropic effects and biological validity concerns. Future research employing multivariable MR analyses or utilizing biomarker-based instrumental variables is necessary to further validate the observed causal associations and better address remaining methodological challenges.
Finally, to translate the findings of the micronutrients and CKD study into clinical practice, several approaches can be considered. Offering nutritional education emphasizing the importance of micronutrients can assist CKD patients and those at high risk in achieving adequate intake through a balanced diet. Developing treatment and prevention strategies based on observed associations between micronutrients and CKD can be beneficial, especially in cases of identified deficiencies or excesses. Encouraging healthy eating habits related to micronutrient intake can contribute to reducing the risk of CKD development and supporting kidney health maintenance for prevention purposes.
Conclusion
In conclusion, our study provides suggestive evidence of potential causal relationships between genetically predicted dietary vitamin B6 and vitamin C intake levels and the risk of CKD development. However, given the methodological limitations, including possible residual pleiotropy and modest correlation between dietary intake and circulating nutrient levels, these associations should be interpreted with caution. Despite these limitations, our results offer valuable insights into the potential role of micronutrients in CKD prevention and highlight the need for maintaining balanced nutritional intake.
Supplementary Information
Supplementary Material 1.
The reference list from the paper itself. Each links out to its DOI / PubMed record.
- 1Francis A, Harhay MN, Ong AC, Tummalapalli SL, Ortiz A, Fogo AB, Fliser D, Roy-Chaudhury P, Fontana M, Nangaku M. Chronic kidney disease and the global public health agenda: an international consensus. Nat Rev Nephrol. 2024:1–13.10.1038/s 41581-024-00820-638570631 · doi ↗ · pubmed ↗
- 2Davies NM, Holmes MV, Smith GD. Reading Mendelian randomisation studies: a guide, glossary, and checklist for clinicians. bmj. 2018;362.10.1136/bmj.k 601PMC 604172830002074 · doi ↗ · pubmed ↗
- 3Kim Y, Han B-G, Group K. Cohort profile: the Korean genome and epidemiology study (Ko GES) consortium. Int J Epidemiol. 2017;46:e 20-e 20.10.1093/ije/dyv 316PMC 583764827085081 · doi ↗ · pubmed ↗
- 4Nam K, Kim J, Lee S. Genome-wide study on 72,298 individuals in Korean biobank data for 76 traits. Cell Genom. 2022;2(10):100189.10.1016/j.xgen.2022.100189 PMC 990384336777999 · doi ↗ · pubmed ↗
- 5Yang J, Wu W, Amier Y, Li X, Wan W, Yu X. Causal relationship of genetically predicted circulating micronutrients levels with the risk of kidney stone disease: a Mendelian randomization study. Front Nutr. 2023;10.10.3389/fnut.2023.1132597 PMC 1047652637671199 · doi ↗ · pubmed ↗
- 6Clapcote SJ. Phosphodiesterase-4B as a therapeutic target for cognitive impairment and obesity-related metabolic diseases. Phosphodiesterases: CNS Functions and Diseases. 2017:103–31.10.1007/978-3-319-58811-7_528956331 · doi ↗ · pubmed ↗