Diverging Mortality Trends by Educational Attainment in the US
Eugenio Paglino, Elizabeth Wrigley-Field, Andrew C. Stokes

TL;DR
The study explores how mortality rates in the US have changed over time based on education levels and sex, including during the pandemic.
Contribution
It provides new insights into mortality trends linked to educational attainment during the pandemic.
Findings
Mortality trends were analyzed across different education levels and sexes.
The study covers the period before, during, and after the pandemic.
Educational attainment is shown to influence mortality rates.
Abstract
This cross-sectional study examines trends in US mortality rates by sex and educational attainment before, during, and after the COVID-19 pandemic.
Genes, proteins, chemicals, diseases, species, mutations and cell lines named across the full text — each resolved to its canonical identifier and authoritative record.
Click any figure to enlarge with its caption.
 Figure
| Cause of death, by sex and educational attainment | No. of observed deaths | No. of counterfactual deaths (80% PI) | Ratio of observed to counterfactual deaths (80% PI) | No. of excess deaths (80% PI) | Percentage of total |
|---|---|---|---|---|---|
|
| |||||
| <Bachelor’s degree | |||||
| All causes | 1 179 368 | 948 957 (911 653-987 353) | 1.24 (1.19-1.29) | 230 410 (192 015-267 715) | 100 |
| Circulatory diseases | 367 528 | 248 882 (234 914-263 372) | 1.48 (1.40-1.56) | 118 645 (104 155-132 613) | 51.5 |
| COVID-19 | 19 239 | 0 | NA | 19 239 | 8.3 |
| Diabetes | 43 971 | 25 326 (23 677-27 001) | 1.74 (1.63-1.86) | 18 645 (16 971-20 294) | 8.1 |
| Malignant neoplasms | 242 629 | 239 198 (231 425-247 399) | 1.02 (0.98-1.05) | 3431 (−4770 to 11 203) | 1.5 |
| Drug poisonings | 49 193 | 12 890 (12 234-13 595) | 3.82 (3.62-4.02) | 36 303 (35 598-36 959) | 15.8 |
| Other external | 77 034 | 46 673 (39 262-54 597) | 1.68 (1.41-1.96) | 30 360 (22 437-37 771) | 13.2 |
| All other causes | 379 775 | 375 988 (347 260-402 402) | 1.01 (0.94-1.09) | 3787 (−22 627 to 32 515) | 1.6 |
| ≥Bachelor’s degree | |||||
| All causes | 348 458 | 302 367 (290 253-315 047) | 1.15 (1.11-1.20) | 46 091 (33 411-58 205) | 100 |
| Circulatory diseases | 110 314 | 78 189 (74 256-82 060) | 1.41 (1.34-1.49) | 32 125 (28 254-36 058) | 69.7 |
| COVID-19 | 6621 | 0 | NA | 6621 | 14.4 |
| Diabetes | 10 055 | 6066 (5517-6648) | 1.67 (1.51-1.82) | 3989 (3407-4538) | 8.7 |
| Malignant neoplasms | 77 658 | 81 423 (78 132-84 807) | 0.95 (0.92-0.99) | −3765 (−7149 to −474) | −8.2 |
| Drug poisonings | 4296 | 2451 (2112-2833) | 1.78 (1.52-2.03) | 1846 (1463-2185) | 4.0 |
| Other external | 21 037 | 21 544 (19 591-23 587) | 0.98 (0.89-1.07) | −507 (−2550 to 1446) | −1.1 |
| All other causes | 118 477 | 112 695 (100 999-125 965) | 1.06 (0.94-1.17) | 5782 (−7488 to 17 478) | 12.5 |
| Total | 1 527 826 | 1 251 325 (1 210 109-1 291 413) | 1.22 (1.18-1.26) | 276 501 (236 413-317 717) | 100 |
|
| |||||
| <Bachelor’s degree | |||||
| All causes | 1 175 505 | 924 704 (854 937-996 164) | 1.28 (1.18-1.37) | 250 801 (179 340-320 568) | 100 |
| Circulatory diseases | 358 918 | 216 110 (198 738-234 642) | 1.67 (1.53-1.81) | 142 809 (124 276-160 180) | 56.9 |
| COVID-19 | 19 850 | 0 | NA | 19 850 | 7.9 |
| Diabetes | 34 896 | 18 823 (16 506-21 004) | 1.87 (1.66-2.11) | 16 073 (13 892-18 391) | 6.4 |
| Malignant neoplasms | 225 506 | 200 745 (184 290-217 440) | 1.13 (1.04-1.22) | 24 761 (8065-41 216) | 9.9 |
| Drug poisonings | 20 466 | 11 982 (9234-15 213) | 1.77 (1.35-2.22) | 8484 (5254-11 232) | 3.4 |
| Other external | 39 927 | 25 716 (22 709-29 063) | 1.57 (1.37-1.76) | 14 211 (10 864-17 218) | 5.7 |
| All other causes | 475 941 | 451 328 (402 081-501 008) | 1.06 (0.95-1.18) | 24 614 (−25 067 to 73 860) | 9.8 |
| ≥Bachelor’s degree | |||||
| All causes | 256 670 | 258 468 (238 421-278 793) | 1.00 (0.92-1.08) | −1797 (−22 123 to 18 249) | NA |
| Circulatory diseases | 71 604 | 63 361 (52 689-74 346) | 1.15 (0.96-1.36) | 8243 (−2742 to 18 915) | NA |
| COVID-19 | 3953 | 0 | NA | 3953 | NA |
| Diabetes | 5455 | 3941 (3359-4561) | 1.40 (1.20-1.62) | 1514 (894-2096) | NA |
| Malignant neoplasms | 62 949 | 71 166 (65 290-77 387) | 0.89 (0.81-0.96) | −8217 (−14 438 to −2341) | NA |
| Drug poisonings | 2396 | 1600 (941-2321) | 1.71 (1.03-2.55) | 796 (75-1456) | NA |
| Other external | 10 259 | 10 916 (8713-13 435) | 0.97 (0.76-1.18) | −657 (−3176 to 1546) | NA |
| All other causes | 100 053 | 107 482 (95 485-119 804) | 0.94 (0.84-1.05) | −7429 (−19 751 to 4568) | NA |
| Total | 1 432 175 | 1 183 172 (1 111 250-1 256 585) | 1.21 (1.14-1.29) | 249 003 (175 590-320 925) | 100 |
|
| |||||
| <Bachelor’s degree | 2 354 872 | 1 873 662 (1 790 017-1 953 102) | 1.26 (1.21-1.32) | 481 211 (401 771-564 855) | 100 |
| ≥Bachelor’s degree | 605 129 | 560 835 (535 889-585 290) | 1.08 (1.03-1.13) | 44 294 (19 838-69 239) | 100 |
| Total | 2 960 001 | 2 434 496 (2 350 703-2 522 689) | 1.22 (1.17-1.26) | 525 505 (437 312-609 298) | 100 |
Peer Reviews
No public reviews on file for this paper yet. If you reviewed it on a platform where reviews are public (OpenReview, ICLR, NeurIPS, ICML), you can paste yours below so the community can read it here.
Videos
No videos yet. Explain this paper in a talk, walkthrough, or lecture? Add one.
Taxonomy
TopicsHealth disparities and outcomes · Global Health Care Issues · Global Health Workforce Issues
Introduction
After decades of improvement, US mortality rate decreases have stagnated or reversed since 2010.^1,2,3^ Research suggests these trends are greatest among adults with lower educational attainment.^4^ We describe differences in mortality rates before, during, and after the COVID-19 pandemic by estimating (across educational attainment and sex) how many more deaths occurred between 2011 and 2023 than would have been expected based on 2006-2010 trends.
Methods
This cross-sectional study did not involve human participants and was deemed exempt by the Boston University Institutional Review Board. Informed consent was waived. We followed the STROBE guideline.
We obtained US death and population counts by age (≥35 years), sex, year, and education from the National Vital Statistics System and the 1-year American Community Survey Public Use Microdata Sample. Educational attainment was categorized as having a bachelor’s degree or higher (college graduate) vs having less than a bachelor’s degree (noncollege graduate).^4^ We computed age- and cause-specific mortality rates by sex and educational attainment. We used National Health Interview Survey Linked Mortality File (1986-2018) estimates to correct for education misreporting on death certificates.^5^ We modeled cause-specific age-standardized mortality rates using generalized additive models. We used 2006-2010 as a baseline and forecasted mortality rates for the prepandemic (2011-2019), pandemic (2020-2022), and postpandemic (2023) periods. We computed excess mortality as the difference between observed and expected mortality. To quantify the uncertainty in the estimates, we report 80% prediction intervals (PIs). R, version 4.1.1 (R Project for Statistical Computing), was used for data analysis. Additional details are provided in Supplement 1.
Results
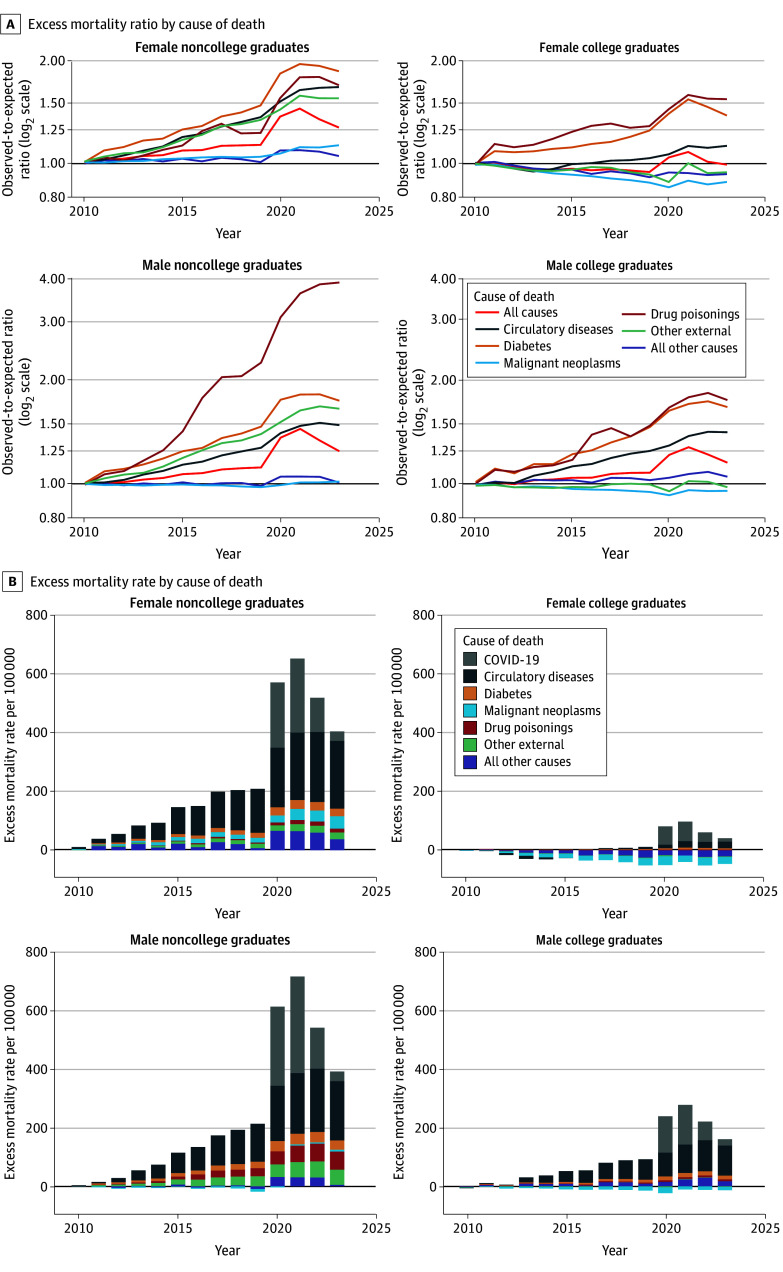
We analyzed 47 545 611 US deaths for 2006 to 2023. Mortality was markedly higher during the prepandemic, pandemic, and postpandemic periods (2011-2023) than would have been expected based on 2006-2010 trends for both male and female noncollege graduates (Figure). Excess deaths also occurred during 2011 to 2023 for male college graduates but to a lesser extent. Although COVID-19 was a leading cause of excess deaths, much of the increase in excess deaths over 2020 to 2023 was associated with increases in deaths from circulatory diseases and diabetes.
Cause-Specific Excess Mortality Ratios and Rates by Sex and Educational Attainment Among Individuals Aged 35 Years or Older, 2011-2023A and B, Excess mortality ratios and rates, respectively. Excess mortality rates were estimated as the difference between observed and expected age-standardized mortality rates. Expected rates were forecasted from the baseline period (2006-2010). Educational attainment was categorized as having a bachelor’s degree or higher (college graduate) vs having less than a bachelor’s degree (noncollege graduate). In B, the excess mortality rate for each year is the total height of the bar.
An estimated 525 505 (80% PI, 437 312-609 298) more deaths occurred in 2023 than would have been expected based on 2006-2010 mortality trends. Among noncollege graduates, mortality was 26% higher (80% PI, 21%-32%) in 2023 compared with what would have been expected based on 2006-2010 trends, equaling 481 211 (80% PI, 401 771-564 855) excess deaths (Table). In contrast, mortality was only 8% higher (80% PI, 3%-13%) among college graduates in 2023 compared with baseline, equaling 44 294 (80% PI, 19 838-69 239) excess deaths. Among both male and female noncollege graduates, circulatory diseases were the leading cause of excess deaths in 2023 (51.5% vs 56.9%, respectively). In contrast, among male vs female noncollege graduates, 15.8% vs 3.4% of excess deaths were attributable to drug poisonings, and 13.2% vs 5.7% of excess deaths were due to other external causes, respectively.
Discussion
Our findings suggest that 525 505 more deaths occurred in 2023 than would have been expected based on 2006-2010 mortality trends; 481 211 of these deaths were among noncollege graduates. The large number of excess deaths attributable to circulatory diseases underscores the ongoing association of cardiometabolic risk factors with US mortality trends, along with the social and structural conditions that shape these risks.^2^ External causes, particularly drug poisonings, were a major cause of excess deaths among male noncollege graduates in 2023, highlighting the ongoing role of deaths of despair in US mortality.^4^
This cross-sectional study has limitations. The composition of the educational categories evolved from 2006 to 2023 as more adults graduated college, meaning noncollege graduates may have represented a more disadvantaged population as the study progressed.^6^ Other limitations include the use of different data sources for death and population counts and the lack of disaggregation by more granular education categories. Future research is needed to quantify the role of specific mechanisms in producing the patterns documented here.
The reference list from the paper itself. Each links out to its DOI / PubMed record.
- 1National Academies of Sciences, Engineering, and Medicine. High and Rising Mortality Rates Among Working-Age Adults. National Academies Press; 2021. doi:10.17226/2597633656826 · doi ↗ · pubmed ↗
- 2Mehta NK, Abrams LR, Myrskylä M. US life expectancy stalls due to cardiovascular disease, not drug deaths. Proc Natl Acad Sci U S A. 2020;117(13):6998-7000. doi:10.1073/pnas.192039111732179670 PMC 7132127 · doi ↗ · pubmed ↗
- 3Preston SH, Vierboom YC. Excess mortality in the United States in the 21st century. Proc Natl Acad Sci U S A. 2021;118(16):e 2024850118. doi:10.1073/pnas.202485011833846260 PMC 8072323 · doi ↗ · pubmed ↗
- 4Case A, Deaton A. Accounting for the widening mortality gap between American adults with and without a BA. Brookings Pap Econ Act. 2023;(2):1-78. doi:10.1353/eca.2023.a 935412 · doi ↗
- 5Rostron BL, Boies JL, Arias E. Education reporting and classification on death certificates in the United States. Vital Health Stat 2. 2010;(151):1-21.25093685 · pubmed ↗
- 6Novosad P, Rafkin C, Asher S. Mortality change among less educated Americans. Am Econ J Appl Econ. 2022;14(4):1-34. doi:10.1257/app.20190297 · doi ↗